
Fisheries and Oceans Canada’s 2025-26 Departmental Results Report
On this page
- At a glance
- From the Minister
- Results: What we achieved
- Spending and human resources
- Supplementary information tables
- Federal tax expenditures
- Corporate information
- Definitions
Copyright information
© His Majesty the in Right of Canada, as represented by the Minister of Fisheries, 2026
Catalogue Number: Fs1-84E-PDF
ISSN: 2561-0236
Aussi disponible en français sous le titre : Rapport sur les résultats ministériels 2025-2026
At a glance
This Departmental Results Report details Fisheries and Oceans Canada’s actual accomplishments against the plans, priorities and expected results outlined in its 2025–26 Departmental Plan.
These results align with the priorities outlined in the May 21, 2025, mandate letter from the Prime Minister, as well as with Fisheries and Oceans Canada’s vision, mission, raison d’être and operating context.
Highlights for DFO in 2025-26
1. Strengthening sustainable fisheries management to support long-term stock health and economic sustainability
DFO strengthened sustainable fisheries management by implementing the modernized Fisheries Act, including continued delivery of Fish Stock Provisions and the completion of rebuilding plans for major fish stocks within regulated timelines. The Department advanced science-based decision making through the Sustainable Fisheries Framework. Through the Pacific Salmon Strategy Initiative, DFO also advanced habitat restoration, hatchery modernization, and collaborative stewardship with Indigenous partners to support the conservation and recovery of wild Pacific salmon. These efforts supported the conservation of fish stocks, the protection of marine ecosystems, and the long-term economic stability of Canada’s fishing sector and coastal communities. The department announced four partner-led initiatives through the National Strategy to Ensure the Future of Atlantic Salmon that strengthen Indigenous and collaborative information sharing and stakeholder collaboration to support the long-term conservation and sustainability of wild Atlantic salmon.
2. Supporting a resilient, competitive, and globally connected fishing sector
DFO supported the long-term sustainability, economic resilience, and global competitiveness of the fish and seafood sector, including aquaculture, by opening negotiations with provincial partners to renew shared fisheries innovation funding. These investments are targeted at helping harvesters and seafood businesses adapt to changing global conditions and maintain economic activity in coastal, rural, and northern communities. The Department also strengthened market access by diversifying export markets, maintaining access to the United States, and securing improved conditions for key exports such as lobster and crab in international markets, including through enhanced engagement with global partners.
3. Advancing marine conservation and ecosystem protection
DFO advanced marine conservation and ecosystem protection by establishing new marine protected areas, including Qikiqtait and Sarvarjuaq, contributing an additional 2.02 per cent to Canada’s progress toward its marine conservation target of 30 per cent by 2030. The Department also invested in ecosystem restoration through initiatives such as the Aquatic Ecosystem Restoration Fund, supporting habitat restoration projects that benefit key species and biodiversity. Efforts were complemented by strengthened protections for species at risk, including increased delivery of recovery planning and actions to address threats to aquatic species.
4. Modernizing program delivery, improving regulatory efficiency, and strengthening fisheries enforcement
DFO improved regulatory efficiency and modernized program delivery by introducing digital tools, streamlining permitting processes, and delivering new guidance and frameworks to support timely, consistent project approvals while maintaining environmental protections and respecting the constitutionally-protected rights of Indigenous Peoples. At the same time, the Department strengthened fisheries enforcement and international leadership by modernizing enforcement tools and training, enhancing compliance with international requirements, and expanding efforts to deter illegal, unreported and unregulated fishing. These efforts included strengthened collaboration with international partners, participation in joint enforcement operations, and system upgrades to maintain access to key export markets.
5. Advancing reconciliation and Indigenous partnerships in fisheries and oceans management
DFO advanced reconciliation and strengthened Indigenous partnerships by supporting co-developed governance arrangements, expanding Indigenous participation in fisheries management decision making, implementing moderate livelihood initiatives in collaboration with Indigenous communities, and implementing two Project Finance for Permanence agreements with First Nations and Inuit partners. The Department also advanced commitments under the United Nations Declaration on the Rights of Indigenous Peoples Act Action Plan, supported Indigenous access to fisheries, and strengthened the inclusion of Indigenous Knowledge and perspectives in policies, programs, and regulatory processes. Together, these efforts contributed to building long-term, Nation-to-Nation relationships and supporting sustainable economic opportunities for Indigenous Peoples.
- Total actual spending (including internal services): $3,957,510,427
- Total full-time equivalent staff (including internal services): 11,230
For detailed information on Fisheries and Oceans Canada’s total spending and human resources, read the Spending and human resources section of this report.
Summary of results
The following provides a summary of the results the Department achieved in 2025–26 under its “core responsibilities” (its main areas of activity).
Core responsibility 1: Fisheries
Actual spending: $1,425,091,012
Actual human resources: 3,667
- advanced sustainable fisheries management by continuing to implement the Fish Stock Provisions of the modernized Fisheries Act, including completing rebuilding plans for prescribed major fish stocks within regulated timelines
- published the 2025-26 Sustainable Fisheries Framework work plan to guide sustainable fisheries management
- advanced the National Strategy for Atlantic Salmon through major collaborative and Indigenous-led projects
- managed American eel through an adaptive approach and implemented new elver regulations and reporting requirements
- opened negotiations on renewing federal-provincial fisheries funds for five years to support harvesters, businesses, and coastal economies
- strengthened seafood market access by diversifying exports, securing improved access to key markets, and reinforcing Canada’s reputation for reliable and high quality products
- released the Whalesafe Fishing Gear Strategy to reduce whale entanglements and support sustainable fisheries and coastal economies through innovative and practical fishing gear solutions
- continued to advance sustainable aquaculture by implementing strengthened management measures and fish health monitoring, furthering research, contributing to pathogen testing, and collaborating with Indigenous communities and partners
- invested in climate-resilient small craft harbour infrastructure, including projects in Clyde River and Arctic Bay
- modernized fisheries enforcement through new digital tools, training, and technologies to improve safety and accountability
- reinforced action against illegal, unreported and unregulated fishing by upgrading the Fisheries Certificate System to maintain access to European Union markets, continuing major international enforcement operations in the North Pacific and on the Pacific coast, and advancing stronger global fisheries governance through international partnerships and Regional Fisheries Management Organizations
- advanced reconciliation and Indigenous participation in fisheries management through agreements, collaborative governance, moderate livelihood implementation, new Indigenous data sovereignty work, and the signing of a 20-year Reconciliation Agreement for Fisheries Resources with the A‑Tlegay Member Nations
For more information on Fisheries and Oceans Canada’s activities related to Fisheries read the “Results: What we achieved” section of this report.
Core responsibility 2: Aquatic Ecosystems
Actual spending: $650,499,473
Actual human resources: 1,902
- established two new Marine Protected Areas (Qikiqtait and Sarvarjuaq), increasing Canada’s protected and conserved marine area to over 17 per cent and making progress towards the 30 per cent by 2030 target
- strengthened Inuit-led conservation through the completion and the signing of an Inuit Impact and Benefit Agreement with the Qikiqtani Inuit Association, supporting stewardship, governance, and long-term community benefits in Nunavut
- advanced work toward the establishment of up to 14 new protected and conserved areas
- funded major aquatic ecosystem restoration projects (e.g., salmon habitat and eelgrass restoration) to rebuild critical habitats and support biodiversity
- streamlined regulatory and permitting processes for project reviews and decision making through the development of new tools, guidance, and regulatory changes
- reduced backlogs and strengthened protection for species at risk through accelerated processes and increased delivery of recovery documents and decisions
- delivered targeted conservation funding to support recovery of aquatic species at risk, including leatherback sea turtles and native trout
- led or collaborated on national and binational efforts to prevent, detect, and control aquatic invasive species, including collaboration with the United States in the Great Lakes
- strengthened science-based decision making through new research (e.g., North Atlantic right whale assessment) and expanded public access to science data and tools
- modernized marine navigation services through digital transformation, including internationally recognized S‑100 Sea Trials
- advanced Indigenous partnerships by supporting Indigenous-led conservation, and co-developing long-term stewardship funding and governance mechanisms
For more information on Fisheries and Oceans Canada’s activities related to Aquatic Ecosystems, read the “Results: What we achieved” section of this report.
Key risks
In 2025–26, Fisheries and Oceans Canada (DFO) managed a range of risks that could affect its ability to deliver on its mandate and support Government of Canada priorities in an increasingly complex operating environment. The Department's key risks aligned with three broad themes: Delivery Risk, Stewardship Risk, and Readiness for the Future Risk.
Delivery Risk reflected the Department's ability to achieve expected results amid increasing policy, regulatory, operational, and partnership complexity. Key pressures included climate change and ecosystem changes, and the need to coordinate across multiple jurisdictions and stakeholders. To mitigate these risks, DFO strengthened science-based decision making, advanced ecosystem restoration and marine conservation initiatives, supported sustainable fisheries management, and enhanced collaboration with Indigenous partners, provinces, territories, and stakeholders.
Stewardship Risk related to the Department's ability to sustainably manage its people, assets, infrastructure, and financial resources while maintaining effective program and service delivery. Aging infrastructure, including small craft harbours and scientific facilities, continued to create operational pressures. To address these risks, DFO invested in asset renewal and recapitalization, applied risk-based planning and maintenance approaches, and strengthened financial oversight and resource management practices.
Readiness for the Future Risk reflected the Department's capacity to adapt to evolving demands through modern information management, digital transformation, workforce capabilities, and evidence-based decision-making. During the year, DFO continued to modernize data and information-management practices, improve digital tools and systems, and strengthen its ability to collect, manage, and use information of business value to support timely decisions and long-term organizational resilience.
These actions contributed to the Department's ability to manage key risks while continuing to deliver programs and services for Canadians and support the sustainable management of Canada's fisheries, oceans, freshwater resources, and coastlines.
Transfer of the Canadian Coast Guard from Fisheries and Oceans Canada to the Department of National Defence
Order in Council 2025-0639, approved on September 2, 2025, transferred responsibility for Canadian Coast Guard (CCG) from DFO to the Department of National Defence (DND). This Departmental Results Report (DRR) focuses on 2025-26, a period in which the CCG was still part of DFO; however, reporting for CCG will be reflected through DND’s 2025-26 DRR and for all subsequent years.
From the Minister

On behalf of Fisheries and Oceans Canada, I am pleased to present the 2025-26 Departmental Results Report. It highlights some of what we’ve accomplished over the past fiscal year.
As a lifelong resident of Newfoundland and Labrador, I have a deep and personal connection to the ocean and to the people and communities who depend on it every day. Growing up by the sea, I know first-hand what the ocean means to the people who make their living on the water. This connection continues to guide my work as Minister and reinforces my commitment to protect Canada’s oceans, coasts, waterways, and fisheries, and to keep them healthy for future generations.
The world's oceans continue to face large and complex challenges related to climate change, biodiversity loss, habitat degradation, marine pollution, and pressures on the resources that people, communities, and economies rely on.
Addressing these challenges requires meaningful collaboration across jurisdictions, sectors, and communities. No one meets these challenges alone.
Over the past year, the Department continued to work closely with Indigenous partners, provincial and territorial governments, industry, coastal and rural communities, environmental organizations, academia, other federal departments, and the international community to protect and sustainably use Canada’s oceans, freshwater, and aquatic resources.
As you will see in this Departmental Results Report, progress is strongest when it is built on partnerships, shared knowledge, and common goals. By working together, we were able to grow our fish and seafood sector, advance reconciliation with Indigenous Peoples, and conserve and protect aquatic species and habitats. At the same time, we invested in safe, working small craft harbours for the communities that depend on them, and we put science to work so we can manage our fisheries wisely.
As Minister, I am deeply proud of everyone at Fisheries and Oceans Canada for what they accomplished in service to Canadians. Whether they were working on the water and wharves or in offices and laboratories, they helped strengthen one of Canada's most important economic sectors and protected the health and abundance of our oceans, freshwater, and fisheries.
I invite all Canadians to read this report and to see what this work means for the harvesters, workers, and coastal communities who depend on healthy oceans.
The Honourable Joanne Thompson, P.C., M.P.
Minister of Fisheries
Results: What we achieved
Core responsibilities and internal services
Core responsibility 1: Fisheries
Description
Manage Canada’s fisheries, Indigenous fisheries programs, aquaculture activities and support commercial fishing harbours while applying relevant legislation.
Quality of life impacts
Fisheries and Oceans Canada contributed to quality of life in the Prosperity and Environment domains by managing fisheries, aquaculture, Indigenous programs, and small craft harbours to support sustainable economic activity and growth. Departmental actions helped maintain fish stocks that underpin jobs and income in coastal and Indigenous communities, supported by science-based decision making.
The Department advanced Indigenous participation through renewed programming, capacity building, and collaborative management approaches. Conservation measures, including stock rebuilding and targeted fishing restrictions, supported ecosystem sustainability. Together, these efforts promoted resilient fisheries, environmental stewardship, and long-term economic well-being.
Progress on results
This section details the Department’s performance against its targets for each departmental result under Core responsibility 1: Fisheries.
Table 1 shows the target, the date to achieve the target and the actual result for each indicator under “Canadian fisheries are sustainably managed” in the last three fiscal years.
| Departmental result indicator | Target | Date to achieve target | Actual result |
|---|---|---|---|
| Percentage of key fish stocks that have limit reference points and harvest control rulesFootnote 1 | At least 52% | March 31, 2026 | 2023–24: 45%Footnote 2
2024–25: 45% 2025–26: 47.2%Footnote 3 |
| Percentage of decisions for fisheries on key fish stocks where harvest control rules were followedFootnote 4 | 100% | March 31, 2026 | 2023–24: 97%
2024–25: 98% 2025–26: 98.4%Footnote 5 |
| Percentage of key fish stocks in the cautious and healthy zoneFootnote 6 | At least 55% | March 31, 2026 | 2023–24: 46%Footnote 7
2024–25: 47% 2025–26: 46.7%Footnote 8 |
Table 2 shows the target, the date to achieve the target and actual result for each indicator under “Canadian aquaculture is sustainably managed” in the last three fiscal years.
| Departmental result indicator | Target | Date to achieve target | Actual result |
|---|---|---|---|
| Percentage of aquaculture farms that are compliant with the Fisheries Act regulations | At least 90% | March 31, 2026 | 2023–24: 100%
2024–25: 100% 2025–26: 99% |
| Level of Canadian aquaculture productionFootnote 9 | At least 170,000 tonnes | December 31, 2025 | 2023–24: 166,265 tonnesFootnote 10
2024–25: 145,985 tonnes 2025–26: 160,238 tonnesFootnote 11 |
Table 3 shows the target, the date to achieve the target and actual result for each indicator under “The commercial fishing industry has access to safe harbours” in the last three fiscal years.
| Departmental result indicator | Target | Date to achieve target | Actual result |
|---|---|---|---|
| Percentage of core harbours that are in fair or better condition | At least 87% | March 31, 2026 | 2023–24: 89%
2024–25: 88.5% 2025–26: 88.5% |
Table 4 shows the target, the date to achieve the target and actual result for each indicator under “Fisheries, oceans and other aquatic ecosystems are protected from unlawful exploitation and interference” in the last three fiscal years.
| Departmental result indicator | Target | Date to achieve target | Actual result |
|---|---|---|---|
| Percentage of inspection activities that have resulted in compliance actionsFootnote 12 | At most 60% | March 31, 2026 | 2023–24: 63%Footnote 13
2024–25: 68.7% 2025–26: 41.7% |
Table 5 shows the target, the date to achieve the target and actual result for each indicator under “Scientific information on fisheries resources is available to inform management decisions” in the last three fiscal years.
| Departmental result indicator | Target | Date to achieve target | Actual result |
|---|---|---|---|
| Percentage of approved requests to the Canadian Science Advisory Secretariat (CSAS) for peer-reviewed science advice on fisheries completed each yearFootnote 14 | At least 90% | March 31, 2026 | 2023–24: 95%Footnote 15
2024–25: 90% 2025–26: 94.4% |
| Percentage of sustainable aquaculture research projects which provide information and/or advice to policy and decision makersFootnote 16 | At least 90% | March 31, 2026 | 2023–24: 100%Footnote 17
2024–25: 100% 2025–26:100% |
Table 6 shows the target, the date to achieve the target and actual result for each indicator under “Enhanced relationships with, involvement of, and outcomes for Indigenous people” in the last three fiscal years.
| Departmental result indicator | Target | Date to achieve target | Actual result |
|---|---|---|---|
| Number of agreements / arrangements involving Indigenous groups | At least 545 | March 31, 2026 | 2023–24: 701
2024–25: 677 2025–26: 751 |
| Number of Indigenous people trained through agreements / arrangementsFootnote 18 | At least 647 | March 31, 2026 | 2023–24: 1,924
2024–25: 1,218Footnote 19 2025–26: 1,811 |
| Number of Indigenous people employed through agreements / arrangementsFootnote 20 | At least 5,035 | March 31, 2026 | 2023–24: 5,991
2024–25: 5,587Footnote 21 2025–26: 5,453 |
The Results section of the Infographic for Fisheries and Oceans Canada on GC Infobase provides additional information on results and performance related to its program inventory.
Details on results
The following section describes the results for Fisheries in 2025-26 compared with the planned results set out in Fisheries and Oceans Canada’s Departmental Plan for the year.
Canadian fisheries are sustainably managed
Results achieved
DFO ensured that Canada maintained international and domestic commitments to implement the precautionary approach into its fisheries decision making framework.
The Department continued the development of rebuilding plans for depleted fish stocks. DFO's 2025-26 Sustainable Fisheries Framework Work Plan identified the continued development of this work for fish stocks in all regions.
This work supports the Fish Stocks provisions of the Fisheries Act, which require management measures to maintain stocks at levels to promote sustainability and reduce the risk of serious or irreversible harm. This supports the long-term sustainability of commercial, recreational, and Indigenous fisheries in Canada and the communities that are reliant upon them.
In 2025-26, DFO received funding of $33 million over five years to continue to implement the Fish Stock Provisions of the modernized Fisheries Act. These provisions focus on working with industry and Indigenous groups to manage prescribed major fish stocks at levels necessary to promote environmental and economic sustainability, including the development of rebuilding plans for depleted fish stocks. Since 2022, the Department has developed and completed within regulated timelines the 15 required rebuilding plans for prescribed stocks, with three completed in 2025-26.
The Department developed and published the 2025-26 Sustainable Fisheries Framework work plan with four main streams, including Precautionary Approach Reference Points and Harvest Control Rules, Fish Stock Rebuilding Plans, Integrated Fisheries Management Plans, and implementation of the Fishery Monitoring Policy. Together, efforts under this work plan in 2025-26 supported DFO’s commitment to sustainable fisheries management, helping to maintain healthy fish stocks, protect marine ecosystems, and ensure long-term economic and social benefits for Canadians and coastal communities.
The Pacific Salmon Strategy Initiative (PSSI) guides the efforts of the Department through a strategic and coordinated long-term response to stem the steep decline of many Pacific salmon populations, working collaboratively with British Columbia and Yukon First Nations, harvesters, and external partners. In 2025-26, the final year of the initial five-year investment, the Department advanced a number of actions under each of the three different PSSI strategic outcomes: Restoring Vulnerable Salmon and Salmon Habitat, Sustainable Salmon Fishing Opportunities, and Partner-Driven Salmon Recovery Actions. Examples of what was achieved included:
- Implementation of the Pacific Salmon Commercial Licence Retirement Program: over the five years of the PSSI program, 576 commercial salmon licence eligibilities were retired across 10 commercial fisheries in British Columbia and Yukon, representing a total reduction of over 43 per cent of eligible licences
- Pacific salmon habitat restoration actions with partners: over five years, 15.7 million m² of wild Pacific salmon habitat was restored, supporting healthier ecosystems and improved spawning and rearing conditions. The Department supported over 440 partners to deliver habitat restoration, emergency drought response, hatchery enhancement, and conservation projects across British Columbia and Yukon
- Modernization of salmon hatchery programming to support stocks at risk: over five years, PSSI invested in building new conservation hatcheries and retrofitted more than 70 existing hatcheries, and expanded conservation enhancement partnerships
On March 31, 2026, PSSI was renewed for $412.9 million over five years. The renewed PSSI will build on the successes achieved since the initiative first launched in 2021, enabling continued collaboration with Indigenous Peoples, provincial and territorial governments, harvesters, stewardship partners, environmental organizations, academia, and communities across the west coast.
The Government of Canada announced four projects to advance Canada’s National Strategy to Ensure the Future of Atlantic Salmon, the implementation of which will strengthen governance, knowledge, and collaboration over its 12‑year timeframe. DFO is supporting several partner-led initiatives to advance Atlantic salmon conservation:
- The Atlantic Policy Congress of First Nations Chiefs Secretariat is developing an Indigenous-led collaborative governance approach for conservation, protection, and habitat restoration
- The Institut de développement durable des Premières Nations du Québec et du Labrador is engaging communities to gather Indigenous Knowledge on Atlantic salmon and convening roundtables to integrate Two-Eyed SeeingFootnote 22
- The Atlantic Salmon Federation is conducting habitat connectivity assessments and barrier prioritization to enhance monitoring and reporting of freshwater connectivity
- The Foundation for Conservation of Atlantic Salmon is hosting interprovincial symposiums in Nova Scotia and New Brunswick to share information and best practices, and to foster collaboration among stakeholders
Collectively, these initiatives support the long‑term sustainability of wild Atlantic salmon by strengthening collaborative conservation approaches, improving knowledge and governance, and enhancing capacity to protect a species that remains central to the ecological health, cultural heritage, and economic well‑being of Eastern Canada.
During the 2025 elver (juvenile eels) harvesting season, DFO worked collaboratively with partners across regions from the Maritimes to Ontario, where elvers are repackaged and exported internationally. This work supported the first year of the new Regulations for the possession and export of elvers, as well as their new requirements for licences and a new reporting system to ensure conservation outcomes and socio‑economic benefits are balanced.
Over the past 9 years, DFO, in partnership with provinces, has invested hundreds of millions of dollars to promote innovation, infrastructure, and science partnerships in the fish and seafood sector through the fisheries funds. These funds consisted of the Atlantic Fisheries Fund, the Quebec Fisheries Fund, and the British Columbia Salmon Restoration and Innovation Fund. In 2025-26, negotiations with provincial partners began to extend the funds for five additional years to help Canadian harvesters, seafood businesses, and aquaculture operators adapt to changing global conditions and to help support continued economic contributions to rural and coastal communities across Canada, building on existing federal‑provincial partnerships.
The Department continued to implement the Regional Plan for Knowledge Acquisition and Development of the Lobster Fishery in Quebec by issuing 76 exploratory fishing licences in underutilized areas of the St. Lawrence Estuary and the northern Gulf of St. Lawrence, including Anticosti Island. Activities carried out under this initial phase will help to increase knowledge of the resource and assess opportunities for the responsible and sustainable development of the lobster fishery in Quebec.
The Department supported industry in diversifying export markets by advancing engagement with European partners, strengthening relationships with key importers and retailers, and promoting Canada as a reliable, high-quality supplier, notably through participation at Seafood Expo Global 2025 in Barcelona. There has also been a strong focus on preserving access to the United States market, the sector’s largest and most established export market. Through leadership in the development and delivery of the Ministerial program for Seafood Expo North America (SENA) in Boston, the Department advanced Government priorities related to trade diversification while reinforcing the quality and reliability of Canadian fish and seafood products, including Canadian farmed products. SENA also provided a critical platform to engage stakeholders and gather input to inform Canada’s approach to international trade agreement negotiations.
Access to the Chinese market was also advanced through the Canada-China Preliminary Joint Arrangement announced on January 16, 2026, with the removal of tariffs on lobster and crab until the end of 2026. DFO’s work, undertaken in close collaboration with Government of Canada partners, provided high-quality strategic analysis and critical insights to support engagement with Chinese counterparts, help resolve trade issues, strengthen Canada’s negotiating position, and secure improved and sustained market access for the fish and seafood sector.
Canada’s Whalesafe Fishing Gear Strategy, a five-year plan led by DFO, was released by the Government of Canada in 2025-26. The strategy aims to reduce whale entanglements while supporting sustainable fisheries and coastal economies. The strategy guides the development and implementation of innovative fishing gear, such as on demand (ropeless) systems, in fisheries where the risk of whale interactions is highest, particularly for endangered species like the North Atlantic right whale. Developed through engagement with harvesters, Indigenous communities, gear manufacturers, scientists, and non governmental organizations, the strategy emphasizes solutions that protect whales, and enable harvesters to continue fishing sustainably.
In addition to the release of the strategy, DFO continued to work with industry, stakeholders, and Indigenous groups in the development of the Canadian Ghost Gear Action Plan, with specific DFO activities in this area focusing on addressing abandoned, lost, or otherwise discarded fishing gear (“ghost gear”). Based on information gathered from five years of program activities, five key action areas were identified: risk reduction, ghost gear retrievals, reporting, storage and disposal, and traceability. In-person and virtual workshops were held across Canada in early 2025 to discuss and seek feedback on these action areas and proposed activities towards addressing ghost gear. The Action Plan, targeting a release in 2027, will provide a national framework for addressing ghost gear and will outline regulatory tools, policies, and gear management practices to address ghost gear in the future while supporting market access and sustainability.
Canadian aquaculture is sustainably managed
Results achieved
Throughout 2025-26, DFO advanced the sustainable management of aquaculture. In British Columbia, where DFO is the lead regulator of aquaculture, DFO conducted 117 fish health/sea lice audit and surveillance activities, and 24 per cent of active marine finfish farms underwent environmental site audits as part of ongoing aquaculture activities to mitigate risk to aquatic habitat and species in B.C.
Efforts last year also included ongoing monitoring and response measures to address aquatic animal diseases, such as work undertaken with federal partners to assess and respond to oyster diseases (e.g., Multinucleate Sphere Unknown (MSX) and Dermo) affecting the Atlantic wild and farmed oyster sectors. DFO continued to regulate oyster movements into and within each province through the Introductions and Transfers program, in collaboration with provincial partners and in consultation with the Canadian Food Inspection Agency. This included assessments of genetic, ecological, and disease risks prior to authorizing imports of disease-resistant oysters from the United States. Under the Aquaculture Activities Regulations, DFO collects and reviews required annual reports from operators in the aquaculture industry regarding operational procedures, drug and pesticide use, and environmental considerations. In 2025-26, there were 1,996 completed reports submitted and reviewed by the Department.
The Department also continued to engage in multilateral forums to improve the sustainable management of aquaculture, namely through the Organization for Economic Co operation and Development Committee on Fisheries, the Food and Agriculture Organization Sub committee on Aquaculture, and Five Country Partnership on Aquaculture among the top salmon producing countries globally. Canada hosted the 2026 Annual Five Country Meeting in Halifax, Nova Scotia in March 2026, bringing together Norway, Scotland, the Faroe Islands, and Chile, and reaffirming its leadership in sustainable aquaculture management. In the second year of funding provided under Budget 2024, DFO continued to coordinate and lead engagement with First Nations regarding bivalve shellfish harvest for Food, Social, and Ceremonial (FSC) purposes in areas where lack of monitoring by the Canadian Shellfish Sanitation Program prevented the collection of data. In collaboration with the program partners, the Canadian Food Inspection Agency, Environmental and Climate Change Canada, and the First Nations, DFO activities supported expanded harvest access, sharing of scientific and Traditional Knowledge, and strengthened relationships with First Nations. The lessons learned will guide discussions on potential strategies and considerations for advancing Indigenous-led approaches for safe FSC shellfish harvesting.
The commercial fishing industry has access to safe harbours
Results achieved
Work to maintain and repair small craft harbours continued in 2025-26, ensuring that investments resulted in climate‑resilient infrastructure that served the needs of the fishing industry and local residents. DFO continued to leverage the $463.3 million investment provided over three years through Budget 2024 to repair and maintain small craft harbours, including those damaged by Hurricane Fiona. Every new project incorporated climate data into its design, including the use of data from coastal studies and bathymetric surveysFootnote 23, including the most current construction codes and climate resilience measures.
In addition, DFO awarded the contract to start construction on a new small craft harbour in Arctic Bay, Nunavut, in 2025-26. This five‑year project, from 2025-26 to 2029-30, will build essential infrastructure, including a breakwater, a fixed wharf, and float wharves. Initial planning activities have since begun following the award of the construction contract in February 2026. The new Arctic Bay small craft harbour is expected to deliver significant benefits to the region by expanding marine infrastructure to support safe ocean access, reliable community resupply, and strengthen Arctic sovereignty. Harbour infrastructure also provides important economic and environmental benefits to local communities.
Fisheries, oceans and other aquatic ecosystems are protected from unlawful exploitation and interference
Results achieved
DFO plays a law enforcement role to promote and maintain compliance with legislation, regulations, policies, and management measures implemented to ensure the conservation and sustainable use of Canada's aquatic resources. In 2025‑26, the Department worked on the digital foundations for modern, accountable enforcement and safe operations, underpinned by modern training and technology. National virtual training for conservation and protection officers was supported through the Fishery Officer Learning Series, and significant progress was made towards the implementation of a Learning Management System in partnership with the Canada School of Public Service to enable future self‑paced training and improved certification tracking. Officer safety and accountability were strengthened through the use of body‑worn cameras and the modernization of operational radio procedures. To address aging digital assets and renew IT infrastructure, the Department also advanced the creation of a modern case management system. Together, these initiatives strengthened DFO’s digital backbone, which positions the Department for accelerated and sustainable modernization.
In 2025–26, updates were made to the Fisheries Certificate System to meet new European Union requirements aimed at preventing illegal fishing and improving seafood traceability. Without these updates, Canada’s access to EU markets, worth about $418 million in exports in 2023, would have been at risk. The improvements to the system mean Canada can now issue the catch certificates and other documents needed to meet the EU’s rules, helping ensure continued access to these important markets.
Efforts under Operation North Pacific Guard continued to detect and deter illegal, unreported, and unregulated (IUU) fishing with the third annual high seas patrol in the North Pacific, including the first patrol to host enforcement representatives from four nations (Canada, Japan, the Republic of Korea, and the United States). Over the two month mission, fishery officers patrolled more than 17,000 km, resulting in the detection of 39 potential violations. Canada also deployed a long range fisheries aerial surveillance aircraft to Japan, which identified 51 potential violations Together, these activities strengthened international cooperation and contributed to the protection of fish stocks and marine ecosystems in the North Pacific.
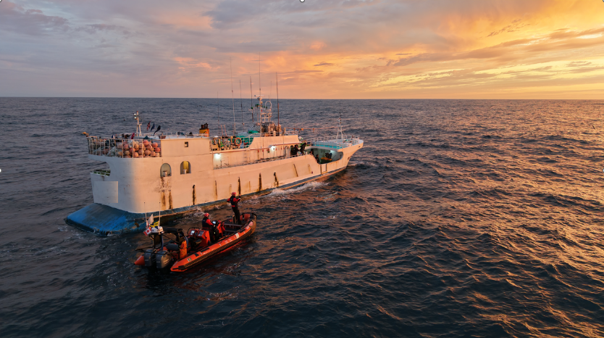
© Fisheries and Oceans Canada, Pacific Region
Image description:
During Operation North Pacific Guard in the North Pacific Ocean, a fast rescue craft carrying several crew members approaches a fishing vessel at sea. The vessels are surrounded by open water under a sunset sky, with ward orange and pink colours reflected on the waves.
DFO also supported the sustainable management of fisheries, effective compliance and enforcement, and collaboration with domestic and international partners through its participation in Operation Sea Dog 2025, including patrols in the Southern Gulf Islands, Strait of Juan de Fuca, and Strait of Georgia. The initiative strengthened cross border intelligence sharing and joint enforcement with U.S. and Canadian partners to protect shared marine resources.
DFO supported counter-IUU fishing and capacity-building efforts, in concert with numerous international partners, including countries and non-governmental organizations, through the Shared Ocean Fund as part of Canada’s Indo-Pacific Strategy in 2025-26. The aim of the Shared Ocean Fund is to help increase maritime cooperation and create a healthy marine environment in the Indo-Pacific while supporting measures against IUU fishing. To advance this objective, the Shared Ocean Fund focuses international efforts through three key pillars: strengthening governance, enhancing enforcement, and building partnerships.
As part of Canada’s engagement at Regional Fisheries Management Organizations (RFMOs), DFO advanced Canadian priorities to support the Canadian fishing industry, sustainable ocean management, healthy aquatic ecosystems, and efforts to curb IUU fishing. In 2025-26, the Department did the following:
- supported the adoption of strengthened measures related to bycatch species, particularly sharks, including advocating for measures to improve provisions to strengthen the ban on shark finning, improving safe handling and release requirements, and implementing stronger mitigation techniques through conditions of licences (gear restrictions, catch and release, season dates, etc.). For example, in the swordfish pelagic longline (fishing gear), the licence holder/operator must immediately release all sharks upon capture, and, where the shark is alive, must cut the line as close as possible to the hook and return the shark to the place from which it was taken
- supported RFMO measures that prohibit the abandonment and discard of fishing gear and other pollutants in accordance with International Maritime Organization MARPOL requirements. Canada will continue to lead the review of the Western and Central Pacific Fisheries Commission's Conservation and Management Measure on Marine Pollution to strengthen efforts to prevent and reduce marine pollution from fishing vessels
- advanced work to map where vulnerable marine ecosystems are concentrated in the Northwest Atlantic Fisheries Organization (NAFO) Regulatory Area – including key indicators such as large sponges, sea pens, and corals. This supports NAFO's 2027 reassessment of these ecosystems and how bottom fishing (fishing on the sea floor with a weighted lure) affects them
- contributed to the development and review of the North Atlantic Salmon Conservation Organization (NASCO) Guidelines for the Protection, Restoration, and Improvement of Atlantic Salmon Habitat, and supported its adoption at the 43rd Annual Meeting of the NASCO. The Guidelines serve as an updated and valuable resource for jurisdictions to further effective Atlantic salmon conservation and a timely and informative addition for Canada as it advances the implementation of the National Atlantic Salmon Strategy (2024-2036)
- provided resources to Regional Management Fisheries Organizations and Bilateral Fisheries Commissions to conduct fish surveys. These surveys include data that considers the impact of climate change on ecosystems, species health, and migration patterns. For example, in 2026 Canada invested $2.4 million to support the International Pacific Halibut Commission’s Fishery-Independent Setline Survey, which provides data required to make a sustainable management decision for Pacific halibut
Collectively, these efforts enhanced enforcement capacity, strengthened international collaboration, and reinforced global fisheries governance, contributing to the sustainable management of marine resources and the protection of Canada’s economic and environmental interests.
Scientific information on fisheries resources is available to inform management decisions
Results achieved
DFO continued to improve its understanding of seal and sea lion populations, their ecological roles, and their potential impacts on fish stocks. In 2025–26, DFO conducted surveys to assess the abundance and distribution of grey seals, harbour seals, sea lions, ringed seals, and hooded seals across Canadian waters. Satellite tags were deployed on harbour seals, grey seals, and Steller sea lions to study their movements, behaviour, and habitat use. DFO also collected and analyzed diet samples from multiple seal and sea lion species across the Arctic, Atlantic, and Pacific regions to better understand their feeding ecology and ecosystem interactions. The data and information from these activities will support science advice to inform the sustainable management of fisheries.
DFO continued to prioritize scientific research to study the impacts of climate change on fisheries, ecosystems, and coastal infrastructure by funding ten climate-related projects to assess climate-related risks to marine species and support the integration of climate vulnerabilities into the Coastal Infrastructure Vulnerability Index framework. Through the publication of the DFO Climate Change Science Community Needs Evaluation 2025, DFO identified key climate-related science needs to help plan and prepare for climate change impacts on coastal communities, ecosystems, and infrastructure. DFO also initiated development of a science-based framework to improve the inclusion of climate change considerations into fisheries management decision making. These activities will provide both decision makers and Canadians with information that can help plan and adapt to a changing climate.
Enhanced relationships with, involvement of, and outcomes for Indigenous people
Results achieved
DFO continued to advance the development of tools, in alignment with the principles of the United Nations Declaration on the Rights of Indigenous Peoples (UNDA). In 2025-26, the Department worked in partnership with Indigenous Peoples to make progress on its Action Plan Measures and support measures led by other federal departments. Efforts focused on advancing key objectives of the Declaration, including self-determination, recognition of treaties, participation in decision making, and the strengthening of Indigenous institutions. Key initiatives include policy reviews, co-development of the Nunavut Fishery Regulations, collaborative fisheries governance agreements, data sovereignty guidance, Pacific salmon conservation, and collaborative marine planning. These actions demonstrate the Department’s ongoing commitment to reconciliation and the advancement of Indigenous rights and interests, using a distinctions-based and regionally tailored approach that reflects the diverse priorities of First Nations, Inuit, and Métis communities.
Progress continued in collaboration with communities to implement the right to fish in pursuit of a moderate livelihood through the roll-out of the Community-Based Access Acquisition (CBAA) initiative. The Department signed CBAA agreements with 15 Indigenous communities in 2025-26. Authorization of status quo licences and conditions to support the implementation of Moderate Livelihood Fishing Plans (MLFPs) in implicated lobster fisheries, including the Unama'ki and Kespukwitk MFLPs. In addition, the Maritimes region continued to facilitate the implementation of the Rights Reconciliation Agreement with the Peskotomuhkati First Nation at Skutik through the established Chief/Regional Director General Joint Committee, as well as working level planning and projects.
DFO also launched the publicly accessible Bridging Indigenous and Science-Based Knowledge (BIAS-K) web portal, which highlights collaborative projects and case studies across Canada that bridge multiple knowledge systems and support greater awareness of diverse approaches to aquatic ecosystem research. Other activities directly contributing to the UNDA Action Plan under Shared Priorities Measures 30 (on Indigenous data sovereignty) and 40 (on Indigenous Knowledge systems) included:
- establishment of a cross-Canada First Nations and DFO Indigenous data sovereignty task force to work towards co-development of departmental policy on Indigenous data and Knowledge sovereignty. Bringing together DFO staff and 9 First Nations organizations, the task force has begun planning for cross-Canada engagement with First Nations to support policy co-development and has produced resources to guide this work, including an Indigenous data sovereignty thematic analysis and a draft set of principles for mechanisms of engagement
- development of interim internal guidance resources for employees around the creation of Data Sharing Agreements that respect Indigenous assertions of data and Knowledge sovereignty. These resources are intended to address immediate needs for guidance while longer-term co-development efforts with Indigenous partners are conducted
In 2025-26, DFO continued to advance collaborative fisheries management and reconciliation with Indigenous partners across regions. In the Pacific region, the Department continued implementation of the Coastal First Nations Fisheries Resources Reconciliation Agreement and completed the second year of the Incremental Reconciliation Agreement with the Five Nuu‑chah‑nulth Nations, supporting consensus‑based, nation‑to‑nation fisheries governance. Progress was also made toward Indigenous self‑government in fisheries through the marking of the Musqueam Self‑Government Agreement. In Atlantic Canada and Quebec, DFO continued the implementation of Rights Reconciliation Agreements with Mi’kmaq, Wolastoqey, and Peskotomuhkati Nations. The Department also advanced new approaches to implementing the right to fish in pursuit of a moderate livelihood, supported by $259.5 million in federal funding. Across the country, DFO expanded Indigenous‑led and Indigenous‑focused engagement mechanisms to support meaningful participation in fisheries decision making.
DFO also continued to advance UNDA Action Plan Measure 41, which seeks to support Indigenous-led conservation measures through meaningful collaboration and partnerships to protect and revitalize Pacific salmon populations and their habitats. The Trilateral Salmon Accord, supported under the Pacific Salmon Strategy Initiative, is one example. The Accord was signed by DFO, the Province of B.C., and First Nations, and has supported early engagement at the provincial scale to support the rebuilding, conservation, and protection of wild Pacific salmon.
The Government of Canada and five A‑Tlegay Member Nations signed a 20‑year Reconciliation Agreement for Fisheries Resources (RAFR) covering the central northeast coast of Vancouver Island, including the northern Strait of Georgia and Johnstone Strait. The agreement supports economic diversification and long‑term prosperity by enabling access to commercial fishing licences and quotas through open‑market processes, supporting sustainable shellfish aquaculture, and facilitating training and business development opportunities. The RAFR also commits to establishing a collaborative fisheries management governance structure with DFO, strengthening coordinated, Nation‑to‑Nation approaches to fisheries management in a region that supports diverse and intensive marine activities, consistent with Canada’s commitment to reconciliation and the implementation of the UNDA.
DFO's Indigenous Collaborative Programs (ICP) continued to deliver foundational capacity building programs that supported workforce development and Indigenous-led conservation and fisheries management in over 180 Indigenous communities and organizations, while also implementing Management Action Plan activities under the 2023-24 Evaluation of the Aboriginal Fisheries Strategy and Aboriginal Aquatic Resource and Oceans Management Programs. Specifically, ICP engaged key Indigenous partners, including those on a joint Collaborative Programs Management Committee, to strengthen program governance, performance measurement, and guidance and training, especially by better aligning them with Indigenous needs and definitions of success.
Finally, an evaluation of the Indigenous commercial fisheries initiatives was performed in 2025-26.
Resources required to achieve results
Table 7 provides a summary of the planned and actual spending and full-time equivalents required to achieve results.
| Resource | Planned | Actual |
|---|---|---|
| Spending | $1,410,375,899 | $1,425,091,012 |
| Full-time equivalents | 3,848 | 3,667 |
The Finances section of the Infographic for Fisheries and Oceans Canada on GC Infobase page and the People section of the Infographic for Fisheries and Oceans Canada on GC Infobase page provide complete financial and human resources information related to its program inventory.
Related government priorities
This section highlights government priorities that are being addressed through this core responsibility.
Gender-based Analysis Plus
Gender-based Analysis Plus
Programs under this core responsibility are focused on maintaining and enhancing existing practices, such as expanding engagement and refining data collection strategies to strengthen inclusivity. A robust GBA Plus data collection strategy was implemented in one area to obtain disaggregated data and performance information, supporting analyses, informing the development of Cabinet documents, and strengthening evidence‑based planning and decision making. This strategy is updated as new data becomes available to reflect emerging insights and evolving needs.
GBA Plus is also embedded in regulatory and impact assessment processes, where analyses are conducted for all relevant projects. These analyses consider diverse subgroups through intersectional approaches and disaggregated data, helping to ensure that decisions account for differential impacts. Similarly, GBA Plus is applied in species conservation decision-making to assess and mitigate potential disproportionate effects on specific populations.
United Nations 2030 Agenda for Sustainable Development and the Sustainable Development Goals
United Nations 2030 Agenda for Sustainable Development and the Sustainable Development Goals
More information on Fisheries and Oceans Canada’s contributions to Canada’s Federal Implementation Plan on the 2030 Agenda and the Federal Sustainable Development Strategy can be found in our Departmental Sustainable Development Strategy and reports on progress.
Artificial intelligence
Artificial intelligence
In 2025-26, several artificial intelligence (AI) initiatives were implemented to increase operational efficiency, improve data quality, and support the sustainable management of fisheries. AI was used to analyze video footage collected aboard fishing vessels to automatically detect and identify harvested species, events, and fishing activities. These initiatives have the potential to complement existing monitoring methods and accelerate data processing. Additional efforts focused on the automated digitization of handwritten documents, enabling information to be converted and integrated directly into databases and reducing manual data entry requirements. AI was also used in sentiment analyses to analyze articles and audio excerpts in order to classify sentiments expressed during public consultations and engagement activities, facilitating the synthesis and interpretation of stakeholder feedback. Finally, AI models were applied to Automatic Identification System vessel data to analyze vessel movements, detect potential fishing activities, and identify activities that may have occurred in marine protected areas or conservation zones. The results of these analyses support monitoring, conservation, and aquatic resource protection activities while contributing to more efficient data-driven decision-making.
The Department also implemented several measures to prepare employees for the responsible adoption of AI. These efforts focused on strengthening staff knowledge and skills through the establishment and renewal of engagement mechanisms designed to promote best practices, support the responsible experimentation and use of AI, and facilitate the sharing of expertise. Training and awareness activities were also delivered to support the safe, ethical, and effective use of AI, including information on approved tools, associated risks, and applicable governance principles. At the same time, employees were encouraged to use approved AI tools to support activities such as drafting, translation, procurement, programming, and the automation of specialized tasks. To support these efforts, a centralized resource hub was made available, bringing together departmental AI-related resources, including strategies, governance documents, projects, guides, and directives. Finally, new coordination and information-sharing forums were established to facilitate collaboration on ongoing initiatives, strengthen data governance, and support the change management efforts required for broader AI adoption across the organization.
Program inventory
Fisheries is supported by the following programs:
- Fisheries Management
- Aboriginal Programs and Treaties
- Aquaculture Management
- Salmonid Enhancement
- International Engagement
- Small Craft Harbours
- Conservation and Protection
- Fish and Seafood Sector
- Aquatic Animal Health
- Biotechnology and Genomics
- Aquaculture Science
- Fisheries Science
- Economics and Statistics
Additional information related to the program inventory for Fisheries is available on the Results page on GC InfoBase.
Core responsibility 2: Aquatic Ecosystems
Description
Conserve and protect Canada’s oceans and other aquatic ecosystems and species from human impact and invasive species
Quality of life impacts
Fisheries and Oceans Canada contributed to quality of life in the Environment domain by protecting and restoring aquatic ecosystems, species, and habitats, while supporting safe and environmentally responsible use of Canada’s marine and freshwater environments. Actions included establishing and managing marine protected and conserved areas, addressing aquatic invasive species, restoring fish habitat using science-based and risk-informed approaches.
The Department also contributed to the quality of life within the domain of Prosperity by providing marine information and services that facilitated safe and reliable navigation. Actions included working towards digital products and services that support safe navigation.
Collaboration with Indigenous partners supported co-management, stewardship, and capacity building. These efforts also generated socio-cultural and local economic benefits. Overall, departmental actions helped to strengthen biodiversity, ecosystem resilience, and environmental stewardship for Canadians.
Progress on results
This section details the department’s performance against its targets for each departmental result under Core responsibility 2: Aquatic Ecosystems.
Table 8 shows the target, the date to achieve the target and the actual result for each indicator under “Negative impacts on Canada’s oceans and other aquatic ecosystems are minimized or avoided” in the last three fiscal years.
| Departmental result indicator | Target | Date to achieve target | Actual result |
|---|---|---|---|
| Percentage of Canada’s oceans that are conservedFootnote 24 | At least 25% | December 31, 2025 | 2023–24: 14.66%Footnote 25
2024–25: 15.54% 2025–26: 17.6%Footnote 26 |
| Percentage of development projects occurring in or near water that effectively avoid, mitigate or offset impacts to fish and fish habitat | 100% | March 31, 2026 | 2023–24: 90%Footnote 27
2024–25: 88.5% 2025–26: 87.7%Footnote 28 |
| Percentage of aquatic species / populations at risk listed under the Species at Risk Act for which a recovery strategy / management plan is completedFootnote 29 | At least 80% | March 31, 2026 | 2023–24: 89%
2024–25: 92% 2025–26: 95% |
| Percentage of approved requests to the Canadian Science Advisory Secretariat (CSAS) for peer-reviewed science advice on aquaticFootnote 30invasive species completed each yearFootnote 31 | At least 90% | March 31, 2026 | 2023–24: Not applicableFootnote 32
2024–25: 33% 2025–26: 33%Footnote 33 |
Table 9 shows the target, the date to achieve the target and actual result for each indicator under “Scientific information on Canada’s oceans and other aquatic ecosystems is available to inform management decisions” in the last three fiscal years.
| Departmental result indicator | Target | Date to achieve target | Actual result |
|---|---|---|---|
| Number of science products related to aquatic ecosystems that are available | At least 100 | March 31, 2026 | 2023–24: 100
2024–25: 100 2025–26: 110 |
| Percentage of approved requests to the Canadian Science Advisory Secretariat (CSAS) for peer-reviewed science advice on aquatic ecosystems completed each yearFootnote 34 | At least 90% | March 31, 2026 | 2023–24: 87%
2024–25: 100% 2025–26: 100% |
Table 10 shows the target, the date to achieve the target and actual result for each indicator under “Mariners safely navigate Canada’s waters” in the last three fiscal years
| Departmental result indicator | Target | Date to achieve target | Actual result |
|---|---|---|---|
| Number of official navigational products created and/or updated per year, from incorporation of new and modern hydrography and/or navigationally significant informationFootnote 35 | At least 200 | March 31, 2026 | 2023–24: 1,568
2024–25: 1,685Footnote 36 2025–26: 1697 |
Table 11 shows the target, the date to achieve the target and actual result for each indicator under “Enhanced relationships with, involvement of, and outcomes for Indigenous people” in the last three fiscal years.
| Departmental result indicator | Target | Date to achieve target | Actual result |
|---|---|---|---|
| Number of agreements / arrangements involving Indigenous groups | At least 273 | March 31, 2026 | 2023–24: 290
2024–25: 239 2025–26: 325 |
| Number of Indigenous people trained through agreements / arrangements | At least 312 | March 31, 2026 | 2023–24: 916
2024–25: 1,098 2025–26: 1149 |
| Number of Indigenous people employed through agreements/arrangements | At least 62 | March 31, 2026 | 2023–24: 2
2024–25: 60 2025–26: 18Footnote 37 |
The Results section of the Infographic for Fisheries and Oceans Canada on GC Infobase provides additional information on results and performance related to its program inventory.
Details on results
The following section describes the results for Aquatic Ecosystems in 2025-26 compared with the planned results set out in Fisheries and Oceans Canada’s departmental plan for the year.
Negative impacts on Canada’s oceans and other aquatic ecosystems are minimized or avoided
Results achieved
In 2025-26, under the OPP Renewal initiative, DFO funded projects through the Aquatic Ecosystem Restoration Fund (AERF), which helps restore aquatic ecosystems and mitigate human impacts on Canadian coastal and marine environments. The project under the AERF supported progress toward Departmental Plan 2025–26 commitments by achieving several key milestones that support departmental performance indicators. In 2025–26, AERF:
- restoring 3,033,639 m2 of marine habitat and 284,923.90 m² of freshwater habitat, contributing to the protection and restoration of fish and fish habitat
- engaging 36 Indigenous partners, contributing to the departmental indicator on the number of agreements/arrangements involving Indigenous groups
- supporting the creation of 127 jobs, including employment opportunities for Indigenous Peoples where applicable
- training 521 people, contributing to capacity building and supporting the departmental indicator on Indigenous people trained through agreements/arrangements, where applicable
- supporting 48 activities contributing to climate change adaptation and resilience
In addition to these performance results, significant project milestones were achieved through ongoing restoration initiatives:
- The Ditidaht First Nation worked on implementing restoration activities in the Doobah Creek watershed on the west coast of Vancouver Island. Through an Indigenous-led, nature-based restoration approach and community-driven initiatives, the project is restoring lost and degraded critical salmon spawning and rearing habitats.
- The Fisheries and Marine Institute of Memorial University of Newfoundland, in collaboration with the Mi'kmaq Alsumk Mowimsikik Koqoey Association, advanced restoration activities in Placentia Bay, Newfoundland. The project is restoring eelgrass beds to recreate nursery and refuge habitats for fish and benthic (sea floor) species, contributing to marine biodiversity conservation and supporting the recovery of species such as Atlantic cod and American eel.
In 2025-26, DFO continued work towards conserving 30 per cent of Canada’s Oceans by 2030 by advancing collaborative work on establishing new marine protected and conserved areas. For example, in March 2026, Qikiqtait and Sarvarjuaq marine protected areas (MPAs) were announced as the first new protected areas established under the SINAA Agreement. Together, these areas contribute just over two per cent to Canada's marine conservation targets, bringing Canada's total protected and conserved marine area to over 17 per cent. In addition, an Inuit Impact and Benefit Agreement was signed covering these two MPAs as well as terrestrial areas in the Belcher Islands, reflecting Canada's commitment to Inuit-led conservation and stewardship in the Canadian Arctic and to supporting Inuit rights, knowledge, governance, and long-term community benefits.
Progress towards 30% concerved by 2030
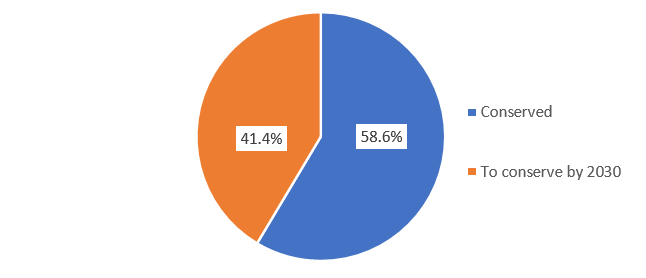
Image description:
Progress towards 30% conserved by 2030
- Conserved: 58.6%
- To conserved by 2030: 41.4%
DFO also continued its work toward the designation of the Fundian Channel-Browns Bank Area of Interest as an MPA. This work was supported by socio-economic analysis, ocean and climate modelling, and preparations to move toward an official designation under the Oceans Act. DFO also continued work with the Kivalliq Inuit Association and local hunter and trapper organizations to advance a potential MPA in the Southampton Island Area of Interest. In addition, DFO published Canadian Science Advisory Secretariat reports on the Eastern Shore Islands Area of Interest and the Western/Emerald Banks Marine Refuge.
In parallel, the Department continued to advance the management and monitoring of existing protected and conserved areas to support the achievement of conservation objectives and biodiversity conservation outcomes. For example, DFO published the second series of annual reports on Canada’s 14 Oceans Act MPAs, highlighting both the value of these sites and the ongoing work to effectively manage them.
The Department organized a series of topic-specific workshops with the Assembly of First Nations Water Sector to strengthen collaborative approaches to advance First Nations-led marine Indigenous Protected and Conserved Areas (IPCAs). Discussions included the relationship between fisheries management and marine conservation measures, the role of DFO conservation tools in supporting IPCAs and how cultural objectives inform the site establishment process.
DFO and A Force of Nature: Canada’s Strategy to Protect Nature
The Strategy outlines significant investments for DFO under three pillars: Protecting Nature in Canada, Building Canada Well, and Valuing Nature and Mobilizing Capital.
These include expanding marine protected and conserved areas (the Marine Conservation Targets Initiative), ratifying the High Seas Treaty, providing additional funding for the Ghost Gear Fund, protecting fish and fish habitat, strengthening and protecting Species at Risk, restoring vulnerable Pacific salmon populations and their habitat, and stabilizing and rebuilding Atlantic salmon populations.
DFO, in collaboration with Environment and Climate Change Canada and Parks Canada, proposed a plan for renewal of the Marine Conservation Targets initiative, which has been approved through the Force of Nature Strategy. The renewal supports the establishment of new marine protected and conserved areas, including through the implementation of Project Finance for Permanence agreements (PFPs) with Indigenous partners.
Canada also continued to advocate for the protection of vital biodiversity of marine areas ensuring coherence and coordination among internal efforts towards its conservation and sustainable use. DFO continued to advance the implementation of the 30 per cent target internationally, including through Canada’s 2023 Nature Strategy and through existing global and regional mechanisms.
Canada continued to actively contribute to, and implement work stemming from, the High Level Panel for a Sustainable Ocean Economy (Ocean Panel).
DFO led Canada’s engagement in the Preparatory Commission established to prepare the groundwork to support the operationalization and implementation of the Agreement under the United Nations Convention on the Law of the Sea on the Conservation and Sustainable Use of Marine Biological Diversity of Areas Beyond National Jurisdiction (BBNJ Agreement), which entered into force in January 2026. In addition, DFO continued to advance the necessary steps toward ratifying the BBNJ Agreement and participated in initiatives such as the Chile-led BBNJ First Movers initiative, which aims to lay the groundwork for adoption of the first generation of high seas area-based management tools, including MPAs.
The implementation of the Letter of Intent for Cooperation on the Pikialasorsuaq, signed by the then Minister of DFO and the Minister of Agriculture, Self-Sufficiency, Energy and Environment of the Government of Greenland in 2023 will serve to better integrate Indigenous knowledge into planning and policy decisions through Inuit-led, transboundary cooperation on marine matters in the shared waters of the Governments of Canada and Denmark, in respect of Greenland. The Pikialasorsuaq is a dynamic area of open sea that remains ice-free throughout the winter and is considered to be one of the most biologically productive regions north of the Arctic Circle. In 2025-26, DFO pursued discussions with the Government of Greenland, Inuit Circumpolar Council Canada, and the Qikiqtani Inuit Association on advancing the development of the terms of reference for a Joint Steering Committee, which will facilitate Inuit-led, transboundary marine cooperation in this region.
In 2025-26, DFO continued to improve program efficiency and clarity for project proponents and supported the government’s commitments to accelerate approval processes for projects in a number of ways, including:
- publishing the Red Tape Review Progress Report, which describes the Department’s actions towards Regulatory efficiency for fish and fish habitat protection under the Fisheries Act
- developing guidance, including Standard Mitigation, Tailored Impact Statement Guidelines, and a detailed permitting plan template in collaboration with the Impact Assessment Agency of Canada
- publishing proposed regulations for authorizing repair and maintenance works in Ontario municipal drains in Canada Gazette Part I for public comment
- developing proposed amendments to the regulations that set out the documents and information required when applying for an authorization under the Fisheries Act and conducting targeted engagement
- publishing Project Planning: Application Form Tips and interim internal guidance on the duty to consult and accommodate
- publishing a Risk Management Framework overview as well as three interim Standards
- launching the Project Submission Tool, a single, standardized digital entry point for project proponents, replacing fragmented regional and paper-based processes.
In 2025-26, the Department entered into partnerships with Indigenous groups, academia, non-governmental organizations, and other partners and stakeholders across Canada to enhance coordination, increase awareness, and advance work on reducing impacts from marine stressors such as ocean noise, marine contaminants, and marine debris. For example, DFO-funded research provided new tools to monitor Arctic ocean noise and better understand its potential effects on marine mammals such as bearded seals. In addition, partners also conducted underwater noise monitoring in the Arctic, James Bay, Sept-Îles Bay, and Burrard Inlet; assessments of vessel traffic impacts on marine mammals; monitoring of seal abundance; studies of mercury and metal contamination; Indigenous-led watershed health assessments; and community-based marine debris reduction and shoreline cleanup programs. In the summer of 2025, the Working Group on Marine Traffic and Protection of Marine Mammals, co-chaired by DFO and Parks Canada, renewed scientific trials to assess the effects of a shipping route designed to divert commercial vessels away from an area heavily frequented by the endangered St. Lawrence beluga. The final Ocean Noise Strategy and its implementation is anticipated to be published in 2026-27.
DFO continued its work to ensure that the protections provided under the Species at Risk Act (SARA) are available to the species that need it. The Department also continued to prioritize eliminating the backlog of species awaiting a decision on whether they should be listed under SARA, or whether they need recovery planning and progress reporting. In 2025-26, DFO implemented streamlined processes that enabled the publication of a total of 9 recovery documents, 16 progress reports, and 1 critical habitat order, reducing the backlog for aquatic species at risk and supporting delivery of analyses and decisions within legislated timelines.
Through contributions to four projects under the Canada Nature Fund for Aquatic Species at Risk (CNFASAR), DFO funded work towards addressing threats to endangered leatherback sea turtles from fishing interactions, plastic pollution, and habitat disturbance. Three projects advanced scientific understanding of key species and ecosystems through collaborative research while also identifying mitigation measures. Two projects expanded the collection of plastic fishing gear that poses a danger to these turtles and promoted live release practices through dockside engagement with harvesters supporting the sustained stewardship for leatherback sea turtles in Canada.
Also under CNFASAR, DFO provided funding in Alberta through collaboration with four Indigenous organizations and partners to support the recovery of Alberta’s endangered native trout species by applying science-based evaluation of threats and habitats, which will continue to inform recovery actions.
DFO continued to lead federal efforts for the management of aquatic invasive species, which can pose ecological and economic risks, across Canada. This work was done through programs like the Aquatic Invasive Species Prevention Fund, focusing primarily on prevention, early detection, education, outreach, and on-the ground response activities.
For example, in 2025-26, DFO successfully delivered the Canadian elements of the binational Sea Lamprey Control Program in keeping with Canada’s obligations under the treaty level Convention on Great Lakes Fisheries with the United States, and performed hundreds of larval and adult eel assessments in Great Lakes tributaries and connected freshwater areas, as well as management efforts like operating barriers to sea lamprey migration. In addition, under the Great Lakes Water Quality Agreement with the United States, the Invasive Carp Program conducted early detection surveillance with partners, and funded six contribution agreements with Ontario non-governmental organizations, conservation authorities, and an Indigenous community to help address invasive carp.
In 2025-26, the Department also launched a one-year pilot project fishery in southwest New Brunswick to help control the invasive European Green Crab, which are highly resilient, feed on native animals, and compete with native crab species for food.
In British Columbia, DFO continues to advance work on an European Green Crab (EGC) Management Framework, which will provide consistent guidance for First Nations to develop area-specific EGC management plans throughout British Columbia.
In 2025-26, DFO confirmed the presence of invasive goldfish in freshwater in Newfoundland and Labrador, originally released illegally by pet owners before becoming an established population that now poses risks to native species and ecosystems. In response, DFO conducted removal activities in collaboration with the Town of Massey Drive, with a focus on limiting spread and impacts of the invasive species.
DFO also continued work to prevent the spread of invasive zebra and quagga mussels within Canada by inspecting thousands of watercraft that were being transported over land and, in several cases, decontaminating them, in partnership with the Government of Manitoba and Canada Border Services Agency. This work helped to prevent the spread of invasive mussels and helped to inform mariners of the importance of ensuring their watercraft are clean, drained, and dry before being transported from one body of water to another.
On top of work that focused directly on invasive species, DFO developed a framework to advance the regulatory process for potential amendments to the Aquatic Invasive Species Regulations, which are needed to improve the efficiency and environmental protections of authorized control activities that use pesticides. In Fall 2025, the proposed Regulations Amending the Aquatic Invasive Species Regulations were published in the Canada Gazette, Part I, for a 30-day public comment period.
Scientific information on Canada’s oceans and other aquatic ecosystems is available to inform management decisions
Results achieved
In keeping with the federal Open Science objectives, DFO published science findings on the state of the ocean, including Canada’s Oceans Now: Arctic Ecosystems, 2023, in English, French, Inuktitut, and Inuinnaqtun.
In 2025-26, the Department continued its research and monitoring activities on priority at-risk whale populations and presented new scientific findings on the status and recovery potential of North Atlantic right whales (NARW) as part of a Recovery Potential Assessment (RPA). RPAs synthesize the best available science on a species’ status, threats, habitat needs, and recovery potential. The NARW assessment found that their habitat range had migrated due to global warming’s impact on prey distribution, and that human activities, particularly vessel strikes and fishing gear entanglements, were identified as primary threats to survival and recovery. These scientific findings will inform updates to the NARW Recovery Strategy and ongoing management measures, supported by science, stakeholder and Indigenous engagement, and socioeconomic considerations. As a complementary initiative, DFO translated NARW science into action through Whale Insight, an online map that displays validated NARW detections in near real time. Whale Insight draws on contributions from federal, academic, and non governmental partners and is used to inform dynamic management measures such as fishery closures and vessel slowdown zones. In 2025, Whale Insight introduced enhanced analytical and accessibility features, along with the FishPro dashboard, which visualizes fishing prohibitions aimed at reducing risk to NARW. Altogether, these efforts demonstrate an end to end approach to government science: producing rigorous advice, communicating it openly, and applying it through tools that support conservation, regulatory decision making, and public trust.
In 2025-26, DFO also deployed high-impact Geographic Information System (GIS) solutions such as the Aquatic Invasive Species Data Viewer (a Canadian first, supporting national transparency and stakeholder engagement) and the bilingual Salmon Space Dashboard for accessible science and policy decision support.
The Department worked with partners to strengthen early detection of aquatic invasive species using environmental DNA (eDNA) and traditional net surveys. For example, combined eDNA and net surveys have supported surveillance for invasive carp species and informed rapid response and monitoring programs in high-risk waters across Canada.
Mariners safely navigate Canadian Waters
Results achieved
DFO is responsible for ensuring that mariners in Canadian waters have access to up-to-date navigational charts. In 2025-26, the Department continued to modernize and streamline its hydrographic operations, products, and services under the Department’s Digital Transformation initiative, supporting a digital-first approach to e-navigation and the growing needs of the blue economy. The public Canadian S-100 Sea Trials were conducted successfully, allowing mariners, pilots, hydrographic offices, system manufacturers, and regulators to freely experiment with digital maps, which supported navigation, planning, and decision making. These trials received international recognition from the International Hydrographic Organization as a model initiative.
Enhanced relationships with, involvement of, and outcomes for Indigenous people
Results achieved
In 2025-26, DFO advanced its commitment to strengthening relationships with Indigenous Peoples and supporting the inclusion of Indigenous Knowledge in departmental decision making. For example, the Indigenous Habitat Participation Program (IHPP) funded projects that supported Indigenous participation in Fish and Fish Habitat Protection Program decisions. This included enabling Indigenous partners to bring their knowledge and perspectives to Fisheries Act authorizations and Species at Risk Act permits and documenting those conversations to inform future engagement and consultation. The IHPP also funded projects strengthening relationships with Indigenous Peoples by increasing collaboration on the conservation and protection of fish and fish habitat through monitoring, information-sharing, and establishing shared priorities.
In 2025-26, DFO also supported Indigenous leadership in marine conservation through the SINAA Qikiqtani and Great Bear Sea PFP initiatives. Collaborative efforts were key to the protection of the Qikiqtait and Sarvarjuaq areas under the SINAA Agreement and participation in the development of the Great Bear Sea Lessons Learned Report (PDF 3.8 MB), led by Coast Funds to inform future conservation finance initiatives. The launch of SINAA’s implementation phase in November 2025 marked a key milestone, with the announcement of the Qikiqtait and Sarvarjuaq Marine Protected Areas in March 2026 as the first protected areas under the agreement. Through the Salish Sea Initiative, DFO also co-developed governance for the $50 million Indigenous Coastal Waters Stewardship Fund, establishing long-term support for First Nations-led monitoring of cumulative effects in marine ecosystems.
Engagement with the Assembly of First Nations supported implementation of the United Nations Declaration on the Rights of Indigenous Peoples Act Action Plan (Measure 42).
Resources required to achieve results
Table 12 provides a summary of the planned and actual spending and full-time equivalents required to achieve results.
| Resource | Planned | Actual |
|---|---|---|
| Spending | $660,911,204 | $650,499,473 |
| Full-time equivalents | 1,920 | 1,902 |
The Finances section of the Infographic for Fisheries and Oceans Canada on GC Infobase page and the People section of the Infographic for Fisheries and Oceans Canada on GC Infobase page provide complete financial and human resources information related to its program inventory.
Related government priorities
This section highlights government priorities that are being addressed through this core responsibility.
Gender-based Analysis Plus
A number of DFO programs integrate Gender-based Analysis Plus (GBA Plus) into program design, policy development, stakeholder engagement and decision-making. Under the Aquatic Ecosystems Core Responsibility, the Fish and Fish Habitat Protection Program (FFHPP) continues to apply an inclusive and accessibility-focused approach to engagement in support of the conservation and protection of fish and fish habitat. Through the Indigenous Habitat Protection Program (IHPP), DFO has provided funding to organizations like the Native Women’s Association of Canada (NWAC), which helps strengthen consideration of the experiences of Indigenous women, girls, Two-Spirit, transgender, and gender-diverse people.
GBA Plus considerations are integrated into efforts to prevent the introduction and spread of aquatic invasive species through a partnership-based funding approach that supports on-the-ground activities and helps protect ecosystems and aquatic-based livelihoods. This approach includes collecting information on recipient affiliation (e.g., Indigenous groups, academia, industry, and non-governmental organizations), project team composition, and geographic location, as well as tracking performance indicators such as the number of Indigenous groups engaged, jobs created (including for Indigenous individuals), and training outcomes. While complete reporting for 2025-26 is pending, data collection will continue through 2026-27. This work supports a better understanding of how benefits, such as healthier aquatic ecosystems and the protection of Indigenous fisheries and aquatic-based livelihoods, are experienced by diverse groups. The results of this work will help inform how to better support the participation of Indigenous groups and local communities in the program moving forward.
United Nations 2030 Agenda for Sustainable Development and the UN Sustainable Development Goals
More information on Fisheries and Oceans Canada’s contributions to Canada’s Federal Implementation Plan on the 2030 Agenda and the Federal Sustainable Development Strategy can be found in our Departmental Sustainable Development Strategy and reports on progress.
Artificial intelligence
DFO increased the awareness, availability, and use of approved artificial intelligence (AI) services in its conservation and science programs under the Aquatic Ecosystems core responsibility to facilitate productivity and efficiency. In general, awareness and training efforts, alongside deliverables in annual performance management reviews, supported early change management by building foundational knowledge, encouraging responsible experimentation, and identifying areas where further guidance, governance, and data readiness work may be required. Staff increasingly used approved AI tools to support drafting, summarizing, synthesis, briefing preparation, and other internal workflows. These early outcomes helped improve awareness of available tools and their functionality, while also identifying opportunities for future measurement of productivity gains, service delivery improvements, and mandate-related impacts.
In addition, employees in the science sector contributed over 80 projects and initiatives to DFO's AI registry, which is used to document AI use and monitor its effectiveness or risks. These contributions demonstrate the interest and enthusiasm present in the sector for adopting AI technology. In addition, examples of AI application in scientific research include models for verification of data quality, oceanographic and environmental anomaly detections, fish counting, sound detection, and identification of organisms in large sets of data.
In 2025-26, AI was applied across several areas of activity to enhance data analysis and support decision making. Computer vision models were developed to automatically detect and identify marine mammals, including belugas, harp seals, and grey seals, from aerial survey imagery. These models provided fast and accurate results, significantly reducing the time required to analyze images while improving the reliability of population estimates. Automated vision technologies were also used to detect and track organisms that live on the floor of a body of water, observed in coral and sponge marine refuges in the Gulf of St. Lawrence, which contributed to a better understanding of these sensitive ecosystems. In addition, pilot projects explored the use of AI to improve the efficiency of reviewing applications received through funding programs and to support the analysis of monitoring reports associated with projects requiring departmental regulatory authorization. AI applications in scientific research also include data quality assurance, image analysis, and the automated identification of organisms within large datasets. Collectively, these initiatives helped to optimize operational processes, improve information processing, and strengthen the Department’s ability to support the conservation and sustainable management of aquatic ecosystems.
Program inventory
Aquatic Ecosystems is supported by the following programs:
- Fish and Fish Habitat Protection
- Aquatic Invasive Species
- Species at Risk
- Marine Planning and Conservation
- Aquatic Ecosystem Science
- Oceans and Climate Change Science
- Hydrographic Services, Data and Science
Additional information related to the program inventory for Aquatic Ecosystems is available on the Results page on GC InfoBase.
Internal services
Description
Internal services are the activities and resources that support a department in meeting its corporate obligations and delivering its programs. The 10 categories of internal services are:
- acquisition management services
- communications services
- financial management services
- human resources management services
- information management services
- information technology services
- legal services
- material management services
- management and oversight services
- real property management services
Progress on results
This section presents details on how the department performed to achieve results and meet targets for internal services.
DFO is a large department with a wide variety of activities and responsibilities, and internal services support all programs to ensure that they have the resources needed to provide effective services to Canadians. Internal services ensure that the Department’s work is done in a fiscally responsible manner that effectively manages Canadian taxpayers’ dollars, and in a sustainable manner that protects Canada’s environment. A focus on employee experience and retention through mental and physical well-being and diversity, along with professional development and training, and the necessary information technology tools needed to do work efficiently and effectively, are also essential. The following are some of the Department’s achievements for 2025-26.
Efficiencies through modernization
Modernization efforts continued to drive efficiencies across departmental operations, supported by integrated planning, strengthened AI and digital capabilities, and enhanced data and risk management practices. These initiatives have improved operational effectiveness, supported informed decision making, and reinforced the delivery of modern, reliable services to programs and Canadians.
During a period of significant change due to the transition of Canadian Coast Guard to DND and government-wide reductions, DFO maintained its stewardship in 2025-26 by integrating financial planning, performance management, and workforce sustainability. The implementation of a centralized program management and budgeting model strengthened oversight and enhanced program delivery. Effective monitoring, analysis, and risk management improved access to timely, reliable information to support data‑informed decision making, address immediate pressures, and sustain programs and sound financial management over the long term.
DFO advanced the implementation of SAP Enterprise Asset Management (EAM), further expanding the capabilities of its SAP S/4HANA platform. The solution establishes standardized processes for planning, maintaining, and monitoring departmental assets while improving the integration of operational and financial information to support sound stewardship, regulatory compliance, and evidence-based investment decisions. The implementation of this new software module, combined with a mature risk-based asset management planning approach, enhances the Department’s ability to consistently prioritize investments, allocate resources to the highest‑risk assets, and improve long‑term planning accuracy across the portfolio. This results in a more sustainable, defensible, and transparent asset management framework.
The Department also advanced the implementation of its Digital Strategy by strengthening its approach to AI adoption and cybersecurity to support the delivery of efficient, modern, and secure services to programs and Canadians. DFO also reinforced cybersecurity safeguards with a new Cyber Security Advisory Committee and by building security principles and processes into its AI activities to ensure the secure implementation of digital and AI investments. The protection of key information assets was further enhanced through the addition of new data labelling and data loss prevention capabilities that will help secure the modern digital services that Canadians expect.
Under the AI Strategy, DFO continued to advance its implementation of AI through the launch of the DFO AI Registry, AI Governance, and the implementation of a Strategic AI Operating Model. These efforts focused on responsible AI, data ethics, investment planning, and Indigenous data sovereignty.
In 2025-26, the Department increased its effectiveness by continuing to modernize key departmental systems and fisheries program delivery. This included the Elver Monitoring and Traceability tool, the Commercial Fisheries Information System (CFIS), electronic logbooks (eLogs), the Enterprise Grants and Contributions Solution, and the Fish and Fish Habitat Protection Program Project Submission Tool. The use of eLogs continued to increase, with 5,473 users submitting over 200,000 electronic logbooks in 2025-26. Mandatory use is now in place for 17 targeted fisheries. Under CFIS, new modern licensing and quota management capabilities were introduced for a group of harvesters in Newfoundland and Labrador, representing the first major release of new tools in more than 40 years. As part of the accelerated delivery of CFIS, electronic purchase slips were also deployed in the Maritimes region for the lobster and crab fisheries, enabling buyers to submit purchase information electronically to the Department, with additional deployments planned for 2026-27. Together, these modernization initiatives strengthen the sustainability, efficiency, and transparency of Canada’s fisheries management, supporting resilient coastal and Indigenous communities and responsible stewardship of aquatic resources for current and future generations.
Reconciliation
The Department advanced engagement initiatives with Indigenous Peoples in alignment with United Nations Declaration on the Rights of Indigenous Peoples. It implemented internal governance and processes to advance reconciliation commitments related to contaminated sites assessment and remediation. For example, across regions, DFO advanced Indigenous engagement activities to support the Environmental Training Program for First Nations communities, although program delivery varied. This included maintaining relationships to support project implementation, collaborating with community‑based businesses, conducting outreach to educational institutions and First Nations, and identifying future training opportunities with partners such as the Confederacy of Mainland Mi’kmaq in Nova Scotia.
In 2025-2026, the Department continued to advance implementation of the Inuit Employment Plan (2023-2033), demonstrating concrete progress toward increasing Inuit participation in Nunavut. Efforts were made across five key areas: recruitment, assessment and selection, advancement and talent management, retention, and measures to address constraints impacting wellbeing. Targeted recruitment initiatives and actions to strengthen workplace inclusivity and retention remained central to this work. Notably, Inuit representation in Nunavut increased from 31 per cent to 42 per cent by March 2025, exceeding the 2026 target of 40 per cent one year ahead of schedule. In March 2026, DFO completed its review of the Inuit Employment Plan Action Plan for 2023-2025, further supporting continuous improvement. Implementation of the Plan remains ongoing, with progress in 2025-26 contributing to longer-term objectives of building a more representative and inclusive workforce in Nunavut that meets the needs of Nunavut Inuit.
Inclusion, diversity, equity, and accessibility
In 2025–26, DFO continued implementing the 2023–2027 Employment Equity (EE), Diversity and Inclusion Action Plan through targeted, evidence-based measures to improve workforce representation, strengthen inclusion, and address EE gaps. Representation of Indigenous Peoples, persons with a disability, and racialized people increased compared to workforce availability for this year, although the racialized group remains under-represented overall.
Efforts to attract talent from designated EE groups included Indigenous student recruitment supports, the Public Service Commission's Federal Internship Program for Canadians with Disabilities and, most recently, DFO’s Black Student Recruitment Initiative pilot project targeting Black science students for various opportunities across the nation, in partnership with the Canadian Black Scientist Network. The pilot initiative supported commitments and efforts towards diversity and inclusion and the Clerk of the Privy Council’s Call to Action by addressing representation gaps in science occupations, and has partially qualified 17 students seeking employment with DFO. The successful initiative, which will be carried out annually, results in diverse student recruitment while building a sustainable talent pipeline and creating future bridging opportunities to address representation gaps in the Department.
As part of advancing inclusive recruitment practices, support was provided in the Fishery Officer Initial Training Program to promote inclusivity and accessibility. Targeted advice and guidance focused on identifying and removing systemic barriers at each stage of recruitment. Engagement with key stakeholders, including the Indigenous Career Navigator Program and the Centre for Anti-Racism team, helped improve communication materials, assessment strategies, and recruitment tools. As a result of these efforts, several improvements were recommended and implemented to better support equitable participation. Simultaneously, referral and selection practices were strengthened to ensure that qualified candidates who self-declared are considered early in the process. This approach reflects a continued commitment to addressing representation gaps and building a more diverse workforce.
Retention and advancement of talent from EE groups included second official language training programs for Black and EE employees, the promotion of Black career and leadership development programs sponsored by the Task Force for Black Public Servants, and other opportunities such as career navigation, acting opportunities, and assignments that support career growth and progression for EE group members. DFO also continued to apply a data-driven approach to monitor progress on EE key performance indicators, which supported efforts to assess and mitigate the potential impacts of workforce reductions on EE-seeking groups.
The Department completed the 2022–2025 Accessibility Action Plan. In addition, DFO published the 2026–2028 Accessibility Action Plan, developed with direct input from persons with disabilities (PwD). Together, these efforts support the Government of Canada's commitment under the Accessible Canada Act to achieve a barrier-free Canada by 2040. Results included an 80 per cent completion rate for mandatory accessibility training, an increase in PwD representation from 12.4 per cent to 13.3 per cent, and a 15-percentage-point increase in employee self-identification rates.
DFO also continued efforts to foster a safe, respectful, and equitable workplace through employee engagement and learning opportunities, and support for employee networks. These efforts contributed to increased retention rates, reaching 98 per cent, and increased participation in self-identification, which reached 99.3 per cent, demonstrating continued progress toward a workforce that is representative, inclusive, and reflective of the diverse communities served by DFO.
Greening government and climate resiliency
The implementation of the Greening Government Strategy continued to progress toward achieving net-zero, climate-resilient operations by 2050 across real property, the on-road vehicle fleet, and procurement. As of March 31, 2025, greenhouse gas emissions from facilities have been reduced by 42 per cent below 2005-06 levels. In addition, in 2025-26, DFO identified its list of High Environmental Impact Categories of procurement and started to develop evaluation criteria to minimize the environmental footprint of these procurements.
The transition toward a greener on‑road fleet also continued to advance, supported by a significant increase in the number of Zero‑Emission Vehicles (ZEV), including plug‑in hybrids and fully battery‑electric models. Within DFO, the ZEV count rose from 64 to 91 vehicles, demonstrating steady growth and a strengthened commitment to reducing operational emissions.
DFO continued to support the implementation and reporting on Canada’s National Adaptation Strategy and 2030 Emissions Reduction Plan through actions that help aquatic ecosystems, fisheries, and coastal communities adapt to the impacts of climate change while supporting their long-term sustainability. Key efforts included advancing climate change science, assessments, tools, and decision-support resources; restoring and conserving aquatic ecosystems; advancing marine protected and conserved area initiatives; incorporating climate considerations into the design, maintenance, and upgrades of small craft harbour infrastructure; supporting sustainable and climate-informed fisheries management; and advancing ghost gear prevention and retrieval initiatives that help reduce pressures on marine ecosystems.
Official Languages
Progress toward official languages obligations was guided by the Official Languages Action Plan 2025-2028, ensuring alignment with departmental priorities, legislative requirements, and operational activities. Ongoing collaboration with the Treasury Board Secretariat’s (TBS) Official Languages Centre of Excellence, the Department of Canadian Heritage, and the Office of the Commissioner of Official Languages supported consistent policies, sharing best practices, and timely responses to government-wide official languages priorities.
In 2025-26, support for the Official Languages Act and the equal use of both official languages remained a priority, with strengthened alignment to TBS requirements for official languages training. A new tracking system was implemented to monitor second official language training expenditures, alongside the launch of two targeted training cohorts: one for 21 Black public servants in collaboration with TBS, and another for 43 employees who self‑identified as members of designated employment equity groups. Efforts to implement the modernized Act also included engagement across all sectors and regions to support the appointment of bilingual supervisors for employees in bilingual regions.
Additional progress was achieved through the Official Languages Regulations Reapplication Exercise, with 29 offices newly designated as bilingual to enhance service delivery in both official languages. Together, these measures improved transparency, equity, and accountability and strengthened the Department’s ability to maintain a representative, inclusive, and bilingual workforce. This enables Canadians to access programs and services more easily in the official language of their choice, contributing to more equitable, responsive, and high‑quality service delivery nationwide.
Comprehensive Expenditure Review
Analysis and recommendations for reductions under the Comprehensive Expenditure Review were completed and approved as part of Budget 2025. Following this approval, the Department shifted its focus to implementation by leveraging existing departmental processes, oversight mechanisms, and governance structures.
To support the implementation of these measures, effective people management practices were implemented to minimize the impacts on employees, resulting in 59 per cent of reductions being achieved through attrition, voluntary departures, and other non-workforce adjustment related measures.
Resources required to achieve results
Table 13 provides a summary of the planned and actual spending and full-time equivalents required to achieve results.
| Resource | Planned | Actual |
|---|---|---|
| Spending | $616,192,140 | $519,313,888 |
| Full-time equivalents | 2,592 | 2,366 |
The Finances section of the Infographic for Fisheries and Oceans Canada on GC Infobase and the People section of the Infographic for Fisheries and Oceans Canada on GC Infobase provide complete financial and human resources information related to its program inventory.
Risk and compliance process
The Risk and Compliance Process (RCP) is a self-assessment designed to help deputy heads verify that they have controls and practices in place to meet their accountabilities under legislation and Treasury Board policy, and to effectively manage risks in their organizations.
In 2025–26, Fisheries and Oceans Canada completed the RCP self-assessment. The results indicate that the Department has in place appropriate and generally consistent practices and controls across most areas, with the majority of responses assessed as compliant and broadly aligned with government-wide results. Strengths were observed in many areas, including financial and expenditure management, procurement, real property governance, technology, security oversight, and values and ethics, supported by established governance structures and monitoring practices. Areas for improvement were identified in service management and integration, the maturity of data and information management, aspects of security and planning, and elements of talent management.
In response, the Department developed and implemented action plans to strengthen management practices in areas where policy compliance concerns were noted. These include advancing service modernization and a client centric approach supported by improvements to service inventory and governance; enhancing data governance and accessibility; strengthening security and governance practices including integrated risk monitoring; modernizing the management of grants and contributions; and improving performance management and training tracking.
These actions will support continued improvements in management practices and strengthen the Department’s capacity to effectively manage risks and deliver on its mandate.
Contracts awarded to Indigenous businesses
Government of Canada departments are required to award at least 5% of the total value of contracts to Indigenous businesses every year.
As shown in Table 14, Fisheries and Oceans Canada awarded 9.9% of the total value of all contracts to Indigenous businesses for the fiscal year.
| Contracting performance indicator | 2025–26 result |
|---|---|
| Total value of contracts awarded to Indigenous businesses (A) | $45,232,642.78 |
| Total value of contracts awarded to Indigenous and non‑Indigenous businesses (B) | $594,572,138.76 |
| Value of exceptions approved by deputy head (C) | $138,246,612.17 |
| Proportion of contracts awarded to Indigenous businesses [A / (B−C) × 100] | 9.9% |
|
Notes
For the purposes of the minimum 5% target, Indigenous Services Canada defines “Indigenous businesses” as:
A “contract” is a binding agreement for the procurement of a good, service or construction and does not include real property leases. It includes contract amendments and contracts entered into by means of acquisition cards of more than $10,000. DFO has included one sub-contract valued at $3,739,549.85 in its overall total. This represents approximately 1% of the overall portion of contracts awarded to Indigenous Business. |
|
In its 2026–27 Departmental Plan, Fisheries and Oceans Canada estimated that it would award 5% of the total value of its contracts to Indigenous businesses by the end of 2025–26.
Spending and human resources
-
In this section
Spending
This section presents an overview of the department’s actual and planned expenditures from 2023–24 to 2028–29.
Budgetary performance summary
Table 15 shows the money that Fisheries and Oceans Canada spent in each of the past three years on its core responsibilities and on internal services.
| Core responsibilities and internal services | 2025–26 Main Estimates | 2025–26 total authorities available for use | Actual spending over three years (authorities used) |
|---|---|---|---|
| Fisheries | 1,410,375,899 | 1,658,503,754 |
|
| Aquatic Ecosystems | 660,911,204 | 673,556,112 |
|
| Marine Navigation | 385,176,621 | 144,960,865 |
|
| Marine Operations and Response | 2,979,891,314 | 1,217,645,190 |
|
| Subtotal | 5,436,355,038 | 3,694,665,921 |
|
| Internal services | 616,192,140 | 680,655,396 |
|
| Total | 6,052,547,178 | 4,375,321,317 |
|
Note: Figures include the Canadian Coast Guard's financials up to the coming into force of the Order in Council on September 2, 2025, in order to align with the Main Estimates.
Analysis of the past three years of spending
The $669 million increase in expenditures from 2023-24 to 2024-25 is primarily related to spending on the Canadian Coast Guard fleet projects and the Great Bear Sea Initiative.
The $1,258 million decrease in expenditures from 2024-25 to 2025-26 is primarily related to the transfer of the Canadian Coast Guard to the Department of National Defence.
The Finances section of the Infographic for Fisheries and Oceans Canada on GC Infobase provides more financial information from previous years.
Planned spending for next three years
Table 16 shows Fisheries and Oceans Canada’s planned spending for each of the next three years on its core responsibilities and on internal services.
| Core responsibilities and internal services | 2026–27 planned spending | 2027–28 planned spending | 2028–29 planned spending |
|---|---|---|---|
| Fisheries | 1,169,011,070 | 862,285,706 | 806,867,780 |
| Aquatic Ecosystems | 329,744,920 | 283,313,118 | 259,314,191 |
| Subtotal | 1,498,755,990 | 1,145,598,824 | 1,066,181,971 |
| Internal services | 387,004,151 | 368,855,527 | 324,538,996 |
| Total | 1,885,760,141 | 1,514,454,351 | 1,390,720,967 |
Analysis of the next three years of planned spending
The ($371) million decrease in planned spending from 2026-27 to 2027-28 is primarily related to:
- funding changes to the Small Craft Harbours Program, as Budget 2024 funding is set to conclude in 2026-27
- ongoing negotiations related to Indigenous programs and planned completion of associated agreements
The ($124) million decrease in planned spending from 2027-28 to 2028-29 is primarily related to:
- reductions related to the Comprehensive Expenditure Review exercise
- funding changes related to implementation of Canada's Indo-Pacific Strategy
Note: The Small Craft Harbours program received $957.8 million in new funding over 5 years starting in 2026-27. As the funding announcement was made outside of the timeframe of this report, the new funds will first be reflected in the 2026-27 Departmental Results Report.
The Finances section of the Infographic for Fisheries and Oceans Canada on GC Infobase provides more detailed financial information related to future years.
Budgetary actual gross spending
Table 17 reconciles gross planned spending with net spending for 2025–26.
| Core responsibilities and internal services | 2025–26 actual gross spending | 2025–26 actual revenues netted against expenditures | 2025–26 actual net spending (authorities used) |
|---|---|---|---|
| Fisheries | 1,425,091,012 | - | 1,425,091,012 |
| Aquatic Ecosystems | 650,499,473 | - | 650,499,473 |
| Marine Navigation | 162,603,133 | 17,642,269 | 144,960,864 |
| Marine Operations and Response | 1,217,645,189 | - | 1,217,645,189 |
| Subtotal | 3,455,838,807 | 17,642,269 | 3,438,196,539 |
| Internal services | 519,313,888 | - | 519,313,888 |
| Total | 3,975,152,695 | 17,642,269 | 3,957,510,427 |
| Note: Figures include the Canadian Coast Guard's financials up to the coming into force of the Order in Council on September 2, 2025, in order to align with the Main Estimates. | |||
Analysis of budgetary actual gross spending summary
For certain services, the Canadian Coast Guard collects service fees to ensure that, where appropriate, the entire cost of delivering the service is not borne by taxpayers. Fees for icebreaking, marine navigation, and dredging support the safe navigation of Canadian waters.
The Finances section of the Infographic for Fisheries and Oceans Canada on GC Infobase provides information on the alignment of Fisheries and Oceans Canada’s spending with Government of Canada’s spending and activities.
Funding
This section provides an overview of the department’s voted and statutory funding for its core responsibilities and for internal services.
Graph 1 summarizes the Department’s approved voted and statutory funding from 2023–24 to 2028–29.
Graph 1: Approved funding (statutory and voted) over a six-year period
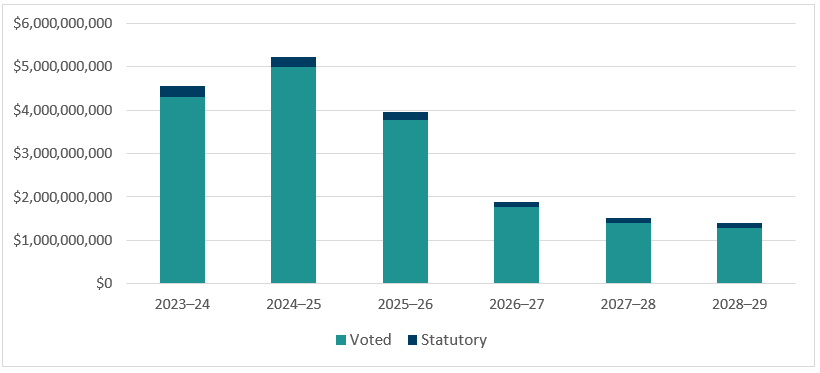
Text version of Graph 1:
| Fiscal year | Statutory | Voted | Total |
|---|---|---|---|
| 2023–24 | $236,618,702 | $4,309,443,705 | $4,546,062,407 |
| 2024–25 | $224,946,353 | $4,990,084,701 | $5,215,031,054 |
| 2025–26 | $192,650,552 | $3,764,859,874 | $3,957,510,427 |
| 2026–27 | $115,019,060 | $1,770,741,081 | $1,885,760,141 |
| 2027–28 | $112,005,112 | $1,402,449,239 | $1,514,454,351 |
| 2028–29 | $103,094,391 | $1,287,626,576 | $1,390,720,967 |
Analysis of statutory and voted funding over a six-year period
The difference between actual and planned spending is primarily attributable to the transfer of the Canadian Coast Guard to the Department of National Defence, as well as timeline changes in the completion of projects, which result in unspent funding to be carried forward to future years.
In addition, the variance reflects in-year funding not yet received for 2026-27 to 2028-29 fiscal years, such as Supplementary Estimates.
See detailed analysis under the tables above for significant year-over-year variances.
Consult the Public Accounts of Canada for further information on Fisheries and Oceans Canada’s departmental voted and statutory expenditures.
Financial statement highlights
This section presents Fisheries and Oceans Canada’s Financial statements (Unaudited) for the year ended March 31, 2026 (PDF, 904 KB).
The financial statement highlights presented in this Departmental Results Report are intended to serve as a general overview of DFO’s Condensed Statement of Operations and Condensed Statement of Financial Position as presented in Fisheries and Oceans Canada’s unaudited financial statements. These financial statements are prepared in accordance with accrual accounting principles and, therefore, are different from the figures provided in other sections of this Departmental Results Report and information published in the Public Accounts of Canada, which are prepared on appropriation-based reporting.
Table 18 summarizes the expenses and revenues for 2025–26, which net to the cost of operations before government funding and transfers.
| Financial information | 2025–26 actual results | 2025–26 planned results | Difference (actual results minus planned) |
|---|---|---|---|
| Total expenses | $2,749,191,302 | $4,035,913,258 | $(1,286,721,956) |
| Total revenues | $18,950,987 | $40,011,000 | $(21,060,013) |
| Net cost of operations before government funding and transfers | $2,730,240,315 | $3,995,902,258 | $(1,265,661,943) |
Analysis of expenses and revenues for 2025–26
The 2025–26 planned results information is provided in Fisheries and Oceans Canada’s Future-Oriented Statement of Operations and Notes 2025–26.
Total actual expenses for 2025-26 were $1,286.7 million lower than planned results, primarily due to the transfer of CCG operations to DND, effective September 2, 2025.
The total actual revenues for 2025-26 were $21.1 million lower than planned results. This decrease was mainly driven by the transfer of the CCG to DND and lower revenues from fines and interest on overdue accounts receivable.
Table 19 summarizes actual expenses and revenues and shows the net cost of operations before government funding and transfers.
| Financial information | 2025–26 actual results | 2024–25 actual results | Difference (2025–26 minus 2024–25) |
|---|---|---|---|
| Total expenses | 2,749,191,302$ | 3,953,310,718 $ | (1,204,119,416)$ |
| Total revenues | 18,950,987 $ | 45,909,939 $ | (26,958,952)$ |
| Net cost of operations before government funding and transfers | 2,730,240,315 $ | 3,907,400,779 $ | (1,177,160,464)$ |
Analysis of differences in expenses and revenues between 2024–25 and 2025–26
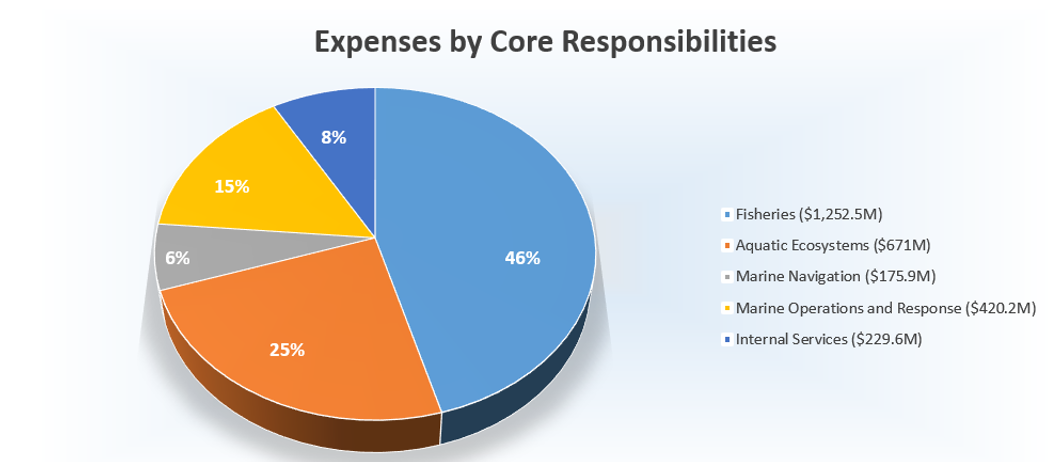
Text version: Expenses by Core Responsibilities
- Fisheries ($1,252.5M)
- Aquatic Ecosystems ($671M)
- Marine Navigation ($175.9M)
- Marine Operations and Response ($420.2M)
- Internal Services ($229.6M)
Total expenses in support of Fisheries and Oceans Canada’s programs and services were $2,749.2 million in 2025-26, a decrease of $1,204 million or 30% when compared to the previous year’s total expenses of $3,953.3 million.
The decrease is mainly attributable to lower spending in Marine Operations and Response ($701.9 million), Internal Services ($452.6 million), and Marine Navigation ($183.2 million). This variance is largely explained by the transfer of employees from DFO to DND, settlements related to assets under construction (AUCs) associated with vessels that were previously accounted for by DFO but are now reported by DND, and measures implemented under the Refocusing Government Spending (RGS) initiative.
Total actual revenues were $18.9 million in 2025-26, representing a decrease of $27.0 million (59%) compared to the previous year. This decrease is primarily attributable to the transfer of authorities related to respendable revenues from DFO to DND, effective September 2, 2025.
Table 20 provides a brief snapshot of the amounts the Department owes or must spend (liabilities) and its available resources (assets), which helps to indicate its ability to carry out programs and services.
| Financial information | Actual fiscal year (2025–26) | Previous fiscal year (2024–25) | Difference (2025–26 minus 2024–25) |
|---|---|---|---|
| Total net liabilities | 1,436,925,706$ | 2,221,980,748$ | (785,055,042)$ |
| Total net financial assets | 776,012,668$ | 793,618,629$ | (17,605,961)$ |
| Departmental net debt | 660,913,038$ | 1,428,362,119$ | (767,449,081)$ |
| Total non-financial assets | 2,848,782,878$ | 10,166,130,104$ | (7,317,347,226)$ |
| Departmental net financial position | 2,187,869,840$ | 8,737,767,985$ | (6,549,898,145)$ |
Analysis of department’s liabilities and assets since last fiscal year
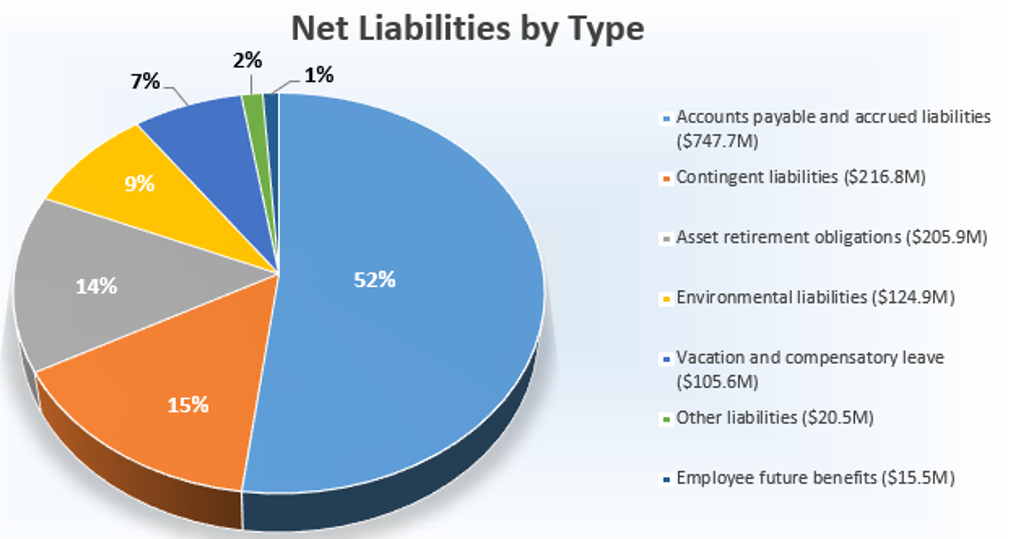
Text version: Net Liabilities by Type
- Accounts payable and accrued liabilities ($747.7M)
- Contingent liabilities ($216.8M)
- Asset retirement obligations ($205.9M)
- Environmental liabilities ($124.9M)
- Vacation and compensatory leave ($105.6M)
- Other liabilities ($20.5M)
Total net liabilities were $1,436.9 million as at March 31, 2026, representing a decrease of $785.1 million (35%) from the previous year's balance of $2,222.0 million. This decrease is primarily attributable to a $293.1 million reduction in contingent liabilities, driven by payments made, changes in the status of litigation cases, and the transfer of CCG-related cases to DND. The decrease was further impacted by the transfer of asset retirement obligations ($223.5 million) and environmental liabilities ($159.5 million) from DFO to DND.
Total net financial assets were $776.0 million as at March 31, 2026, a decrease of $17.6 million or 2.0% when compared to the previous year’s balance of $793.6 million
Total non-financial assets were $2,848.8 million as at March 31, 2026, representing a decrease of $7,317.3 million (72%) from the previous year's balance of $10,166.1 million. This decrease is primarily attributable to the transfer of $7,927.8 million in tangible capital assets from DFO to DND as part of the CCG transition. In addition, inventory ($110.9 million) and prepaid expenses ($121.7 million) were transferred to DND, further contributing to the decline.
Human resources
This section presents an overview of the Department’s actual and planned human resources from 2023–24 to 2028–29.
Table 21 shows a summary in full-time equivalents of human resources for Fisheries and Oceans Canada’s core responsibilities and for its internal services for the previous three fiscal years.
| Core responsibilities and internal services | 2023–24 actual full-time equivalents | 2024–25 actual full-time equivalents | 2025–26 actual full-time equivalents |
|---|---|---|---|
| Fisheries | 3,822 | 3,882 | 3,667 |
| Aquatic Ecosystems | 1,994 | 1,997 | 1,902 |
| Marine Navigation | 1,784 | 1,713 | 959 |
| Marine Operations and Response | 4,714 | 4,715 | 2,366 |
| Subtotal | 12,314 | 12,307 | 8,894 |
| Internal services | 2,543 | 2,573 | 2,336 |
| Total | 14,857 | 14,880 | 11,230 |
| Note: Figures include the Canadian Coast Guard's financials up to the coming into force of the Order in Council on September 2, 2025, in order to align with the Main Estimates. | |||
Analysis of human resources for the last three years
The FTE increase between 2023-24 and 2024-25 is primarily related to planned changes to in-year funding.
The FTE decrease between 2024-25 and 2025-26 is primarily attributable to the transition of the Canadian Coast Guard (CCG) to the Department of National Defence (DND).
Table 22 shows the planned full-time equivalents for each of Fisheries and Oceans Canada’s core responsibilities and for its internal services for the next three years. Human resources for the current fiscal year are forecast based on year to date.
| Core responsibilities and internal services | 2026–27 planned full-time equivalents | 2027–28 planned full-time equivalents | 2028–29 planned full-time equivalents |
|---|---|---|---|
| Fisheries | 3,548 | 3,487 | 3,293 |
| Aquatic Ecosystems | 1,789 | 1,697 | 1,534 |
| Subtotal | 5,337 | 5,184 | 4,827 |
| Internal services | 1,555 | 1,527 | 1,365 |
| Total | 6,892 | 6,711 | 6,192 |
Analysis of human resources for the next three years
The FTE decrease between 2025-26 and 2026-27 is primarily attributable to the transition of the Canadian Coast Guard (CCG) to the Department of National Defence (DND) and the Comprehensive Expenditure Review.
The FTE decrease between 2026-27 and 2027-28 is primarily attributable to planned reductions in funding and reductions related to Comprehensive Expenditure Review.
The FTE decrease between 2027-28 and 2028-29 is primarily attributable to planned reductions in funding and reductions related to Comprehensive Expenditure Review.
Supplementary information tables
The following supplementary information tables are available on Fisheries and Oceans Canada’s website:
- Details on transfer payment programs
- Up-front multi-year funding
- Gender‑based Analysis Plus
- Horizontal initiatives
- Response to parliamentary committees and external audits
- Regulatory and Permitting Efficiency for Clean Growth Projects
Federal tax expenditures
The tax system can be used to achieve public policy objectives through the application of special measures such as low tax rates, exemptions, deductions, deferrals and credits. The Department of Finance Canada publishes cost estimates and projections for these measures each year in the Report on Federal Tax Expenditures. This report also provides detailed background information on tax expenditures, including descriptions, objectives, historical information and references to related federal spending programs as well as evaluations and GBA Plus of tax expenditures.
Corporate information
Departmental profile
Appropriate minister: The Honourable Joanne Thompson, P.C., M.P.
Institutional head: Paul MacKinnon, Deputy Minister
Ministerial portfolio: Fisheries and Oceans Canada
Enabling instruments:
- Oceans Act
- Fisheries Act
- Species at Risk Act
- Coastal Fisheries Protection Act
- Fishing and Recreational Harbours Act
- Canada Shipping Act, 2001 (Transport Canada-led)
- Wrecked, Abandoned or Hazardous Vessels Act (Transport Canada-led)
Year of incorporation or commencement: 1979
Departmental contact information
Mailing address:
Fisheries and Oceans Canada
Communications
200 Kent Street
13th Floor, Station 13E228
Ottawa, Ontario K1A 0E6
Telephone: 613-993-0999
TTY: 1-800-465-7735
Fax: 613-990-1866
Email: info@dfo-mpo.gc.ca
Website: Fisheries and Oceans Canada homepage
Definitions
List of terms
appropriation (crédit)
Any authority of Parliament to pay money out of the Consolidated Revenue Fund.
budgetary expenditures (dépenses budgétaires)
Operating and capital expenditures; transfer payments to other levels of government, departments or individuals; and payments to Crown corporations.
core responsibility (responsabilité essentielle)
An enduring function or role of a department. The departmental results listed for a core responsibility reflect the outcomes that the department seeks to influence or achieve.
Departmental Plan (plan ministériel)
A report that outlines the anticipated activities and expected performance of an appropriated department over a three-year period. Departmental Plans are usually tabled in Parliament in spring.
departmental priority (priorité)
A plan, project or activity that a department focuses and reports on during a specific planning period. Priorities represent the most important things to be done or those to be addressed first to help achieve the desired departmental results.
departmental result (résultat ministériel)
A high-level outcome related to the core responsibilities of a department.
departmental result indicator (indicateur de résultat ministériel)
A quantitative or qualitative measure that assesses progress toward a departmental result.
departmental results framework (cadre ministériel des résultats)
A framework that connects the department’s core responsibilities to its departmental results and departmental result indicators.
Departmental Results Report (rapport sur les résultats ministériels)
A report outlining a department’s accomplishments against the plans, priorities and expected results set out in the corresponding Departmental Plan.
Full-time equivalent (équivalent temps plein)
Measures the person years in a departmental budget. An employee’s scheduled hours per week divided by the employer’s hours for a full-time workweek calculates a full-time equivalent. For example, an employee who works 20 hours in a 40-hour standard workweek represents a 0.5 full-time equivalent.
Gender-based Analysis Plus (GBA Plus) (analyse comparative entre les sexes plus [ACS Plus])
An analytical tool that helps to understand the ways diverse individuals experience policies, programs and other initiatives. Applying GBA Plus to policies, programs and other initiatives helps to identify the different needs of the people affected, the ways to be more responsive and inclusive, and the methods to anticipate and mitigate potential barriers to accessing or benefitting from the initiative. GBA Plus goes beyond biological (sex) and socio-cultural (gender) differences to consider other factors, such as age, disability, education, ethnicity, economic status, geography (including rurality), language, race, religion, and sexual orientation.
government priorities (priorités pangouvernementales)
For the purpose of the 2025–26 Departmental Results Report, government priorities are the high-level themes outlining the government’s agenda as announced in the 2025 Speech from the Throne.
horizontal initiative (initiative horizontale)
A program, project or other initiative where two or more federal departments receive funding to work collaboratively on a shared outcome usually linked to a government priority, and where the ministers involved agree to designate it as horizontal. Specific reporting requirements apply, including that the lead department must report on combined expenditures and results.
Indigenous business (entreprise autochtones)
Requirements for verifying Indigenous businesses for the purposes of the departmental result report are available through the Indigenous Services Canada Mandatory minimum 5% Indigenous procurement target website.
non‑budgetary expenditures (dépenses non budgétaires)
Net outlays and receipts related to loans, investments and advances, which change the composition of the financial assets of the Government of Canada.
performance (rendement)
What a department did with its resources to achieve its results, how well those results compare to what the department intended to achieve, and how well lessons learned have been identified.
performance indicator (indicateur de rendement)
A qualitative or quantitative measure that assesses progress toward a departmental-level or program-level result, or the expected outputs or outcomes of a program, policy or initiative.
plan (plan)
The articulation of strategic choices, which provides information on how a department intends to achieve its priorities and associated results. Generally, a plan will explain the logic behind the strategies chosen and tend to focus on actions that lead to the expected result.
planned spending (dépenses prévues)
For Departmental Plans and Departmental Results Reports, planned spending refers to the amounts presented in Main Estimates. Departments must determine their planned spending and be able to defend the financial numbers presented in their Departmental Plans and Departmental Results Reports.
program (programme)
An Individual, group, or combination of services and activities managed together within a department and focused on a specific set of outputs, outcomes or service levels.
program inventory (répertoire des programmes)
A listing that identifies all the department’s programs and the resources that contribute to delivering on the department’s core responsibilities and achieving its results.
result (résultat)
An outcome or output related to the activities of a department, policy, program or initiative.
statutory expenditures (dépenses législatives)
Spending approved through legislation passed in Parliament, other than appropriation acts. The legislation sets out the purpose and the terms and conditions of the expenditures.
target (cible)
A quantitative or qualitative, measurable goal that a department, program or initiative plans to achieve within a specified time period.
voted expenditures (dépenses votées)
Spending approved annually through an appropriation act passed in Parliament. The vote also outlines the conditions that govern the spending.
Page details
- Date modified: