
User guide: Whale Insight
Whale Insight is an interactive visualization tool that displays detections of North Atlantic right whales in eastern Canadian waters. These detections are either visually observed by aerial and at-sea surveillance, or recorded with acoustic technologies. Whale Insight collects these detections from a variety of partners and groups that undertake monitoring and surveillance activities in Canadian waters.
On this page
- Mapcentric widgets
- Datacentric widgets
- Application support widgets
- Whale Insight advanced map
- Questions or comments
Mapcentric widgets

The Zoom-in widget looks like a plus sign (+) and is located in the top-left corner of the map.
Click the + to zoom in for a closer inspection of the map.

The Zoom-out widget looks like a minus sign (-) and is located in the top-left corner of the map under the Zoom-in widget.
Click the - to zoom out for a larger view of an area.
The Home widget looks like a house and is located in the top-left corner of the map under the Zoom-out widget.
Click the house to zoom and pan the map to the default view.
The Measurement widget looks like a ruler and is located in the top-right corner of the map.
Click the Measurement widget to obtain the size of an area on the map or the distance covered by a line.Datacentric widgets

The Admin widget looks like a closed lock with a circle in the middle and is the first widget from the left in the blue header ribbon.
Click the Admin widget to sign into Whale Insight as a User or Admin.
The Layers widget looks like 3 pieces of paper stacked on top of each other and is the third widget from the left in the blue header ribbon.
Click the Layers widget to add or remove certain features to the map. You can turn layers on and off and view sublayers.
The Legend widget has 3 horizontal lines and is the fourth widget from the left in the blue header ribbon.
Click the Legend widget to display labels and symbols for layers in the map. This is a good place to find out which layers are turned on and what they look like.
The Basemap Gallery widget looks like a square window with 4 panes and is the fifth widget from the left in the blue header ribbon.
Click the Basemap Gallery widget to see a collection of maps from which you can make a selection to change the appearance of the base map in the application.
The FishPro widget looks like a whale tail emerging from two waves and is the seventh widget from the left in the blue header ribbon.
Click the FishPro widget to access the Fishing Prohibitions to Protect North Atlantic Right Whales dashboard.Application support widgets

The About widget looks like a lowercase letter I (i) in a circle. It is the second widget from the left in the blue header ribbon.
Click the i to view statements about the purpose and limitations of the application.
The Guide widget looks like a question mark (?) in a circle and is the sixth widget from the left in the blue header ribbon.
Click the ? to access this user guide.Whale Insight advanced map
The dynamic filter ribbon
On the left side of the map is a dynamic filter ribbon that allows you to quickly narrow down the data displayed to only those records of interest. When you make a selection in the filter ribbon, it will change based on what you search and will only show options with available whale detection data. For example, if you search a time period when there were no acoustic buoys listening for whales, then “buoy” will not be listed as an option under By Platform. To view the results of your query, click on the “Apply” button. To reset your filter selections, click on the “Reset” button.
Note: The larger your query in time or space, the greater the volume of data and the longer it will take the system return the information. For large queries, the Track Lines layer will automatically become hidden to preserve performance but can be manually re-enabled.

At the top of the filter ribbon, there are two key tabs:
Filter: This is where you make your selections across various categories such as date, platform type and name, species, detection score, calves sighted, and number of whales.
Applied filters: This tab displays a summary of your most recent query. It updates automatically when you click the Apply button and shows the selected values for each filter category, helping you quickly review and confirm the criteria used in your current data view.
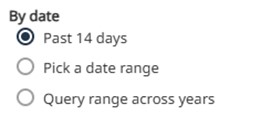
Filter by date
Select a time period to see detections. “Past 14 days” is the default display.
Use “Pick a date range” option to select specific dates from the drop-down calendar. Use “Query range across years” to select one date range across multiple years.
The data is filtered by day from 12:00 am to 11:59pm based on Coordinate Universal Time (UTC).
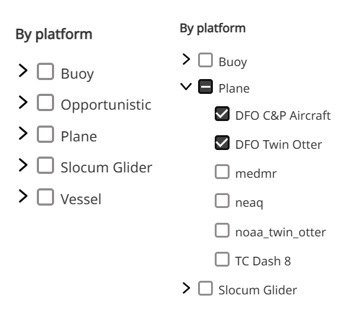
Filter by platform type and platform name
Select one or more platform types to see detections from a specific monitoring activity.
Select one or more specific detection platforms within a platform type using the drop-down arrow.
All platform types and platform names are shown by default, and no checkmarks are selected.
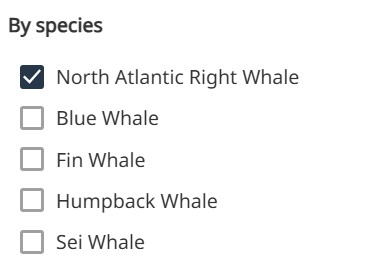
Filter by species
Select a species to see detections of certain species.
“North Atlantic Right Whale” is selected by default.
Note: Most near real-time detections focus on the North Atlantic right whale. Detections of the other whale species are displayed only if the information is available in near real-time.
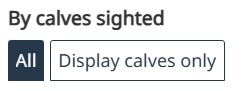
Filter by calves sighted
Select “Display calves only” to see all sightings that included a calf.
“All” is the default display and includes all detections, regardless of whether a calf was sighted.
Note: Calf counts may change after the photos are reviewed and the identification of the calf is validated by marine mammal experts.
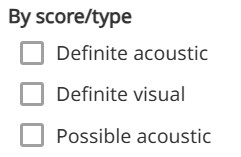
Filter by score/type
Select one or more scores/types of detection.
Detections from all scores/types are shown by default, and no checkboxes are selected.
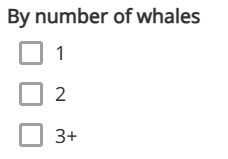
Filter by number of whales
Select the number of whales detected during a sighting event.
A sighting event is when one or more whales are visually observed.
Detections from all sighting events are shown by default.
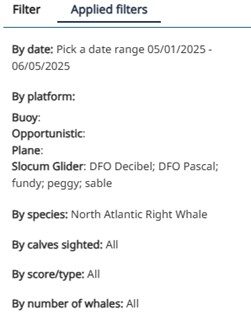
Applied filters
This tab displays a summary of the most recent query based on the filters applied. It appears at the top of the filter ribbon and updates automatically once a new query is made by selecting the "Apply" button.
It shows the selected values for each filter category, such as date range, platform type and name, species, detection score, calves sighted, and number of whales.
This feature helps users quickly review and confirm the criteria used in their current data view.
Note: A blank field means no selection was made for that category.
Currently viewing
On the right side of the map is the Currently Viewing panel. The Currently Viewing panel will show the correct metrics based on the map extent and applied filters.
Note: A map extent is the portion of area of a region shown in a map.

Number of definite sighting events
The number of definite sighting events is shown based on the map extent.
A definite sighting event is when one or more whales are visually observed and the species has been validated by an expert. Sightings are often associated with a dedicated survey platform, but can also be reported opportunistically and validated with photographic or video evidence.
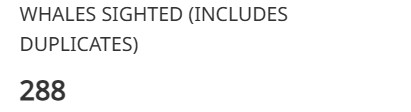
Number of whales sighted
The number of whales sighted is shown based on the map extent.
The number of whales sighted accounts for the total number of individual whales visually observed during sighting events, and may include multiple sightings of the same unique individual, also referred to as duplicates.
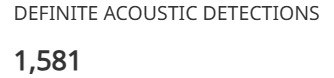
Number of definite acoustic detections
The number of definite acoustic detections is shown based on the map extent.
Detections are categorized as “definite acoustic” when a whale call is detected from an acoustic platform (slocum glider or buoy) and the species has been validated by an expert.
Learn more about acoustic platforms and the analysis protocols for slocum gliders and buoys.
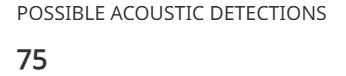
Number of possible acoustic detections
The number of possible acoustic detections is shown based on the map extent.
Detections are categorized as “possible acoustic” when a whale call is detected from an acoustic platform (slocum glider or buoy) but cannot be validated with certainty by an expert.
Learn more about acoustic platforms and the analysis protocols for slocum gliders and buoys.

Earliest observation
The earliest visual observation or acoustic detection is shown based on the map extent.
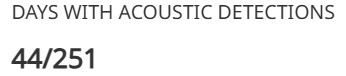
Number of days with acoustic detections
The number of days where a definite or possible acoustic detection was made from an acoustic platform (slocum glider or buoy) out of the total number of days contained within a given query is shown based on the map extent.
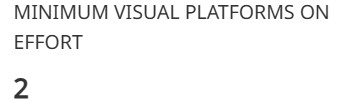
Minimum number of visual platforms on effort
The minimum number of visual platforms (Plane, Vessel, Opportunistic, or RPAS) actively looking for whales is shown based on the map extent.
Note: Not all visual platforms looking for whales report to Whale Insight. Of those that do, not all share effort information. As such, this number does not represent the true extent of visual survey effort within the map extent.
Minimum number of acoustic platforms on effort
The minimum number of acoustic platforms (slocum glider or buoy) actively listening for whales is shown based on the map extent.
Note: Not all acoustic platforms listening for whales report to Whale Insight. Of those that do, not all share effort information. As such, this number does not represent the true extent of acoustic effort within the map extent.
Bar charts
Below the map, there are two graphs that adjust to the map extent and the filter ribbon.
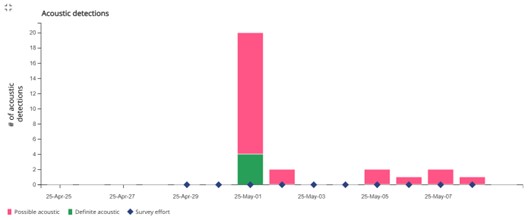
Acoustic detections and acoustic survey effort
This graph visually depicts the acoustic detections per day based on the map extent.
Days on which acoustic platforms were listening for whale calls are represented by blue diamonds.
The x-axis is the time scale and the y-axis is the number of detections.
Note: The first date on the x-axis will be based on the starting date in the range selected in the filter ribbon.
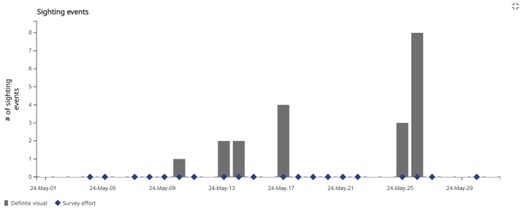
Sighting events and visual survey effort
This graph visually depicts sighting events per day based on the map extent.
Days on which there were survey crews looking for whales are represented by blue diamonds.
The x-axis is the time scale and the y-axis is the number of detections.
Note: The first date on the x-axis will be based on the starting date in the range selected in the filter ribbon.
Questions or comments
Contact us at DFO.WhaleInsight-BaleineEnVue.MPO@dfo-mpo.gc.ca
- Date modified: