
Socio-economic profile (marine harvest activities)
Fundian Channel – Browns Bank Area of Interest
![]()
Socio-Economic Profile (marine Harvest Activities) Fundian Channel – Browns Bank Area of Interest
(PDF, 454 KB)

Map: DFO’s Maritimes region (outlined in black) highlighting the Fundian Channel-Browns Bank Area of Interest in yellow
This report is a socio-economic profile of marine harvesting activities associated with the Fundian Channel – Browns Bank Area of Interest (AOI). A five-year period (2015 to 2019) was used to smooth annual variations in harvesting activity and reflects recent data years in DFO’s Maritimes Fisheries Information System (MARFIS), at the time of analysis. All catches recorded within the boundaries are analyzed, except for the inclusion of a 40 kilometer buffer zone beyond the AOI’s proposed boundaries for the pelagic longline fisheries due to gear drift.
The landed values ($) represent only the value of harvesting activities when landed and does not include additional value-added activities, such as processing or transportation. The analysis incorporates direct (primary) economic aspects of marine harvesting activities, though other economic aspects (for example, spin-offs) are not included, as information is not readily available.
This document is intended to provide economic information for discussion purposes and does not represent actual socio-economic impacts of a Marine Protected Area (MPA) designation, as necessary details (for example, measures, boundaries) are not yet finalized. However, additional analysis has been added to help address the inputs received during the consultative process.
Key findings:
- ~$5 million worth of landings are associated with the AOI each year.
- Swordfish and shellfish account for the majority of the area’s landed value.
- ~76 licence holders fish within the AOI each year.
- 6% of licence holders are highly dependent on landings from the AOI.
- The relative values of fisheries in the area have significantly changed over time.
What commercial fisheries operate within the Fundian Channel - Browns Bank AOI?
Over the 5 year period examined, fisheries that have been active within the AOI include various shellfish (for example, lobster, scallop), swordfish, tuna, and groundfish.
What gear types are used within the AOI?
Vessels fishing within the AOI often use trap, longline, drag, harpoon/spear, angling, otter trawl, tended line, and electric harpoon. Occasionally, gill net, trap net, and hand line are used.
What are the landed values and weights associated with commercial fisheries in the AOI?
Over the 2015 to 2019 period, the total annual landed value of all species associated with the AOI fluctuated from $3 million to $7 million, and averaged $5 million per year. Fishery landings data has been grouped to protect privacy. The ‘swordfish, tuna and shark’ category represented more than half of this annual total, while the ‘lobster, scallop and other shellfish’ category accounted for nearly 40% of this annual total. Groundfish fisheries totalled $400,000 per year. Further detail is summarized in Table 1.
| Landed species | Landed value ($) | Landed weight (kg) |
|---|---|---|
| Swordfish, tuna, and sharkFootnote 1 | $3,000,000 | 285,000 |
| Lobster, scallop, and other shellfish | $2,000,000 | 263,000 |
| Groundfish (fixed gear) | $300,000 | 40,000 |
| Groundfish (mobile gear) | $100,000 | 53,000 |
| All other | negligible | negligible |
| Total | $5.4 million | 645,000 kg |
How many licence holders actively fish in the AOI?
A total of 186 licence holders recorded landings associated with the AOI at some point during the 5 year period. The number of active licence holders fluctuated between 100 licence holders in 2015 to 59 licence holders in 2018, and averaged 76 active licence holders per year. The breakdown of licence holders by licence species is summarized in Table 2.
| Licence species | Average number of FINs per year |
|---|---|
| Other tunas (restricted) | 24 |
| Swordfish (longline) | 19 |
| Groundfish (fixed gear) | 16 |
| Swordfish (harpoon) | 11 |
| Groundfish (mobile gear) | 11 |
| Bluefin tuna | 8 |
| Lobster | less than 5 |
| Scallop | less than 5 |
| All other | less than 5 |
Notes:
- Some licence holders hold licences in more than one fishery.
- Contains information on Maritimes Region based licence holders only.
- A Fisher Identification Number (FIN) is a unique number assigned to each fish harvester.
How does recent commercial fishing in the AOI compare to the potential level of access?
This analysis compares all licences issued in 2019 that permit fishing in management units that overlap with the AOI to licences that were active (i.e. associated with reported catches) in the AOI. Given that the management area(s) are often significantly larger than the AOI, there is potential for licence holders to fish in areas outside of the AOI. The restricted tuna and Swordfish longline licence holders fish a larger proportion of their potential access within the AOI compared to other fisheries that use the area. For more information on the potential versus active licences associated with the AOI, see Table 3 below.
| Licence species | Number of licences that could potentially fish in the AOI | Number of active licences associated with the AOI | % Active licences relative to potential |
|---|---|---|---|
| Other tunas (restricted) | 77 | 25 | 32% |
| Swordfish (longline) | 77 | 18 | 23% |
| Bluefin tunaFootnote 2 | 32 | 5 | 16% |
| Groundfish (mobile gear) | 321 | 16 | 5% |
| Swordfish (harpoon)Footnote 2 | 848 | 20 | 2% |
| Groundfish (fixed gear) | 1,783 | 17 | 1% |
| Mackerel | 1,736 | 0 | 0% |
| Herring | 1,552 | 0 | 0% |
| Squid | 306 | 0 | 0% |
| Jonah crab | 8 | 0 | 0% |
| Lobster | 8 | * | * |
| Scallop | 6 | * | * |
| Hagfish | 4 | * | * |
| Red crab | 2 | * | * |
| Rock crab | 2 | * | * |
| Offshore tuna | 1 | * | * |
*Data withheld when either there are less than 5 active licences, or there are less than 5 licences issued and thus the corresponding information on the activity level is not shown.
How dependent are the active licence holders on catches from the AOI?
Most of the licence holders (FINs) associated with the AOI are not highly dependent on the area for landings, when each of the licence holder’s portfolio of licences are considered. Active licence holders received, on average, 11% of their total landed value from the AOI. There are, however, a small proportion (6%) of licence holders with half or greater of their total annual landed value attributed to the AOI. The licence holder dependency is summarized in Table 4.
| Level of dependency | Percentage share of FINs |
|---|---|
| Very low (less than 5%) | 54% |
| Low (5% to 24%) | 33% |
| Moderate (25% to 49%) | 7% |
| High (50% or greater) | 6% |
Another measure of dependency analyzes landings associated with the AOI on an individual licence basis, relative to total landings in the Maritimes Region on that licence. As such, landings recorded under other licences that are not fished within the AOI and may represent a large proportion of the licence holder’s total annual landed value are excluded. This analysis indicates that there are a quarter of these licences with 50% or greater of the total annual landed value attributed to the AOI. These licences are highly dependent on landings of swordfish and tunas (for example, bluefin and/or bigeye) from the AOI in at least one of those years analyzed.
| Level of dependency | Percentage share of licences |
|---|---|
| Very low (less than 5%) | 28% |
| Low (5% to 24%) | 24% |
| Moderate (25% to 49%) | 23% |
| High (50% or greater) | 25% |
How important are landings from the AOI to the fishery/fleet?
On a fishery/fleet basis, landings associated with the AOI represent a larger proportion of the fishery’s/fleet’s Maritimes Region total annual landed value particularly for tunas and swordfish fleets. For the other tuna (restricted) fleet, a quarter of the fleet’s annual Maritimes Region total is attributed to landings associated with the AOI. See Table 6 for more information.
| Fishery/fleet | AOI - average annual | Percentage of Maritimes Region's | ||
|---|---|---|---|---|
| landed value | active licence holder count | average annual total landed value | all active licence holders | |
| Other tunas (restricted) | $1,800,000 | 24 | 25% | 60% |
| Swordfish (longline) | $880,000 | 19 | 10% | 55% |
| Bluefin tuna | $220,000 | 8 | 11% | 18% |
| Groundfish Fixed Gear <45' fleet | $150,000 | 11 | 1% | 2% |
| Swordfish (harpoon) | $110,000 | 11 | 18% | 35% |
| Groundfish Mobile Gear <65' fleet | $70,000 | 10 | 0% | 24% |
| Other groundfish fleets (4) | $150,000 | 7 | less than 1% | n/a |
| All other fleets/fisheries (5) | $2,000,000 | 5 | less than 15% | n/a |
Notes:
- Active fisheries/fleets that did not meet the minimum rule of 5 are grouped to protect privacy.
- Only fleets/fisheries that are based in the Maritimes Region are shown.
- The average landed values by fishery/fleet will include both directed species and any incidental bycatches.
How important are landings from the AOI to the communities?
During the 2015 to 2019 period, vessels reporting landings associated with the AOI landed in over 40 ports in the region. Most of these ports were located in Shelburne County of Nova Scotia and about 70% of the total landed value occurring in 2 ports, Shelburne and Woods Harbour (each with port dependency levels of less than 10%). No port in the region was highly dependent on landings, in aggregate, from the AOI.
Overall, landings from the AOI represented a small portion (i.e. under 2%) of the total landed value in the counties where landings from the AOI occurred. See Table 7 for more information.
| Nova Scotia County | Landed value from AOI area per year | Total landed value from all areas per year | % of total landed value from AOI |
|---|---|---|---|
| Shelburne | $4.5 million | $297 million | 1.5% |
| Yarmouth | $373,000 | $248 million | 0.2% |
| Lunenburg | $175,000 | $69 million | 0.3% |
| Five other counties | $288,000 | $269 million | 0.1% |
In terms of seasonality, summer and autumn are key seasons for landings associated with this AOI. About two-thirds of the total annual value of landings associated with the AOI were landed in the summer months and 20% were landed in the autumn months. The differences in seasonality between the AOI and the Maritimes Region are primarily attributed to the relative proportions of species landed. See Figures 1 and 2 for more information.

Figure 1: Seasonality of landed value by area, 2015-2019 average (%)
Description
Line graph describing the seasonality of landed value by area with average percentages and seasons. Two lines are shown: blue, solid line representing AOI and black dotted line representing Maritimes region.
Spring (AOI: ~10%) (Maritimes region: ~26%)
Summer (AOI: ~68%) (Maritimes region: ~24%)
Autumn (AOI: ~24%) (Maritimes region: ~20%)
Winter (AOI: ~2%) (Maritimes region: ~29%)
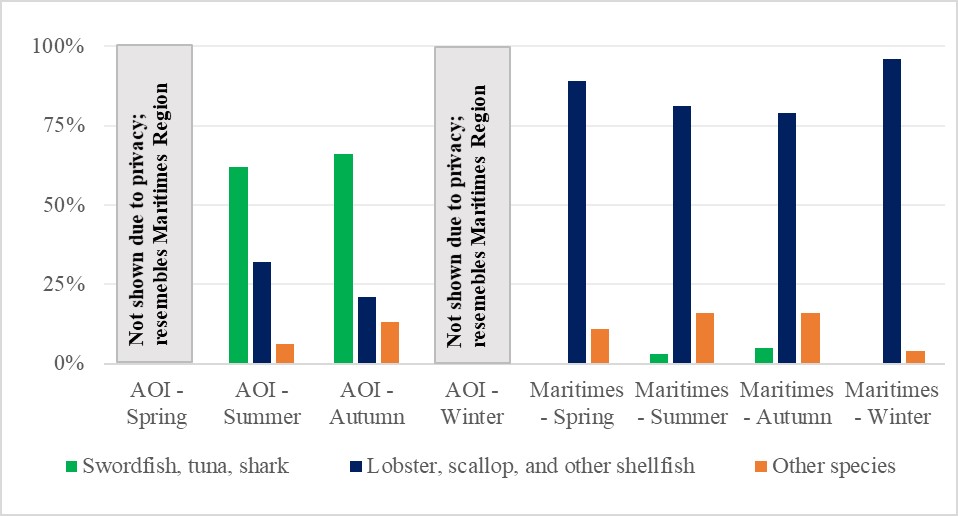
Figure 2: Seasonal landed value by species category and area, 2015-2019 average (%)
Description
Bar graph describing the seasonal landed value by species category and area between AOI and Maritimes region with average percentages and seasons.
Colour legend:
Green: Swordfish, tuna, shark
Blue: Lobster, scallop and other shellfish
Orange: Other species
AOI
- Spring
- Not shown due to privacy; resembles Maritimes Region
- Summer
- Swordfish, tuna, shark (~60%)
- Lobster, scallop and other shellfish (~30%)
- Other species (~10%)
- Autumn
- Swordfish, tuna, shark (~68%)
- Lobster, scallop and other shellfish (~20%)
- Other species (~12%)
- Winter
- Not shown due to privacy; resembles Maritimes Region
Maritimes region
- Spring
- Swordfish, tuna, shark (0%)
- Lobster, scallop and other shellfish (~87%)
- Other species (~13%)
- Summer
- Swordfish, tuna, shark (~3%)
- Lobster, scallop and other shellfish (~80%)
- Other species (~17%)
- Autumn
- Swordfish, tuna, shark (~7%)
- Lobster, scallop and other shellfish (~77%)
- Other species (~16%)
- Winter
- Swordfish, tuna, shark (~0%)
- Lobster, scallop and other shellfish (~95%)
- Other species (~5%)
Were marine harvesting activities in the broader area(s) different in the past?

Map: DFO’s Maritimes region (outlined in black) showing the Fundian Channel-Browns Bank area of interest highlighted in yellow and the NAFO divisions that surround it, 4X and 5Z, shown in red.
Although information on historical harvesting activity for the specific AOI is not available, landings from the 2 associated North Atlantic Fisheries Organization (NAFO) divisions 4X and 5Ze suggest that the relative values of key fisheries have significantly changed over the past few decades.
Since the 1980s, lobster and scallop fisheries have been the two most significant fisheries that occur in NAFO divisions 4X and 5Ze combined. The lobster fishery has grown to represent more than 70% of the total annual landed value in the combined area. Some groundfish species, such as cod and pollock, were more significant in the 1980s, prior to the groundfish moratorium. See Figure 3 for more information.
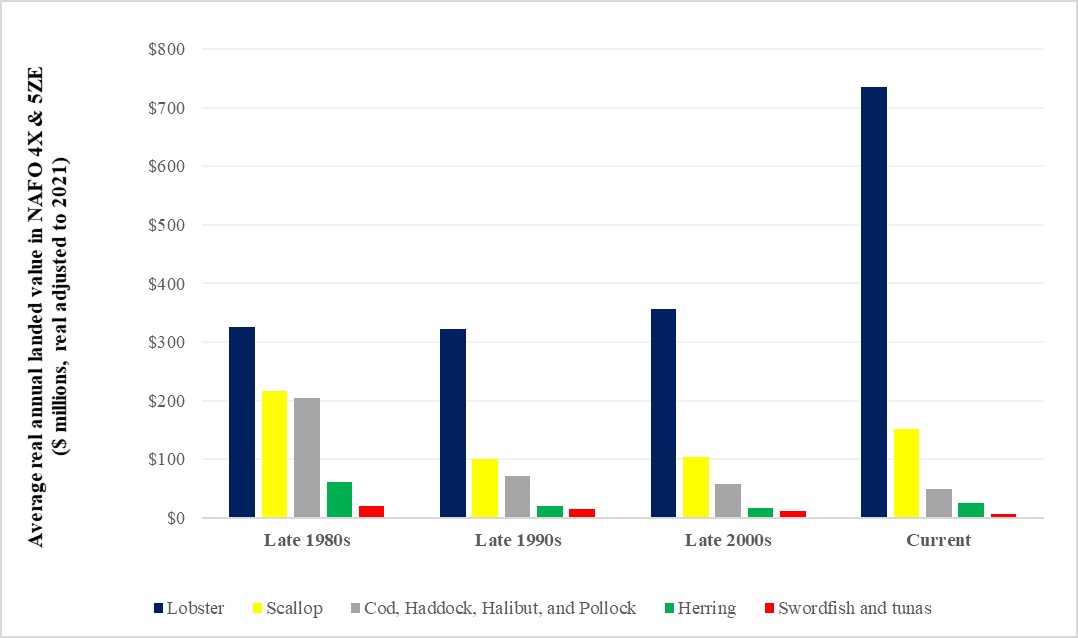
Figure 3: Annual historical landed value by species in NAFO divisions 4X and 5Ze, in real 2021 dollars
Description
Bar graph describing the annual historical landed value by species in NAFO divisions 4X and 5ZE.
The Y-axis: average real annual landed value in NAFO 4X & 5ZE ($ millions, real adjusted to 2021)
The X-axis: dates (years)
Colour legend:
Blue: Lobster
Yellow: Scallop
Grey: Cod, Haddock, Halibut and Pollock
Green: Herring
Red: Swordfish and tunas
- Late 1980s
- Lobster (~$320)
- Scallop (~$210)
- Cod, Haddock, Halibut and Pollock (~$205)
- Herring (~$60)
- Swordfish and tunas (~$20)
- Late 1990s
- Lobster (~$315)
- Scallop (~$95)
- Cod, Haddock, Halibut and Pollock (~$70)
- Herring (~$20)
- Swordfish and tunas (~$15)
- Late 2000s
- Lobster (~$355)
- Scallop (~$105)
- Cod, Haddock, Halibut and Pollock (~$50)
- Herring (~$15)
- Swordfish and tunas (~$10)
- Current
- Lobster (~$730)
- Scallop (~$250)
- Cod, Haddock, Halibut and Pollock (~$50)
- Herring (~$25)
- Swordfish and tunas (~$5)
Notes:
- Only significant fisheries (i.e. average annual landed value in excess of $5 million in nominal dollars) in the combined NAFO divisions 4X and 5Ze that are relevant to the AOI are shown.
- Due to data confidentiality, the inshore and offshore figures have been grouped for lobster and scallop, as offshore figures cannot be shown separately; only the offshore portions of lobster and scallop pertain to this AOI.
Will additional socio-economic analysis be conducted?
Socio-economic analysis is an important part of an MPA designation process. Additional socio-economic analysis will be conducted, as required, to help determine what boundaries and management measures (for example, zones, prohibitions, allowable activities) should be proposed for a potential MPA. If the Fundian Channel – Browns Bank AOI is officially put forward for an MPA designation, a formal socio-economic analysis will be conducted. This information will be used during consultations and form part of the required, formal documentation.
Appendix
Were there variations in landed weights and values over a longer time period?
Over a longer time period (2010 to 2019), the total annual landed value of species associated with the AOI fluctuated between $3 million to $7 million, and averaged $5 million per year. Decreasing trends in terms of landed weights and values occurred over this time frame for many fisheries. The “lobster, scallop, and other shellfish” category however experienced an increasing trend. Further detail is summarized in Tables A1 and A2.
| Landed species | Annual landed value ($) | ||
|---|---|---|---|
| Lowest | Highest | 10-year trend | |
| Swordfish, tuna, and shark | $1 million | $5 million | Decreasing |
| Lobster, scallop, and other shellfish | less than $500K* | less than $5M* | Increasing |
| Groundfish (fixed gear) | $200,000 | $1 million | Decreasing |
| Groundfish (mobile gear) | $20,000 | $200,000 | None |
| All other | negligible* | less than $100K* | None |
| All species | $3 million | $7 million | - |
Notes:
- Some cells are denoted with an asterisk (*) for which very broad ranges are shown for illustrative purposes, due to data confidentiality.
- The figures may correspond to different years, so columns may not be additive.
- The lowest and highest annual landed values may not be associated with the lowest and highest annual landed weights.
| Landed species | Annual landed weight (kg) | ||
|---|---|---|---|
| Lowest | Highest | 10-year trend | |
| Swordfish, tuna, and shark | 100,000 | 600,000 | Decreasing |
| Lobster, scallop, and other shellfish | less than 50K* | less than 500K* | Increasing |
| Groundfish (fixed gear) | 20,000 | 700,000 | Decreasing |
| Groundfish (mobile gear) | 20,000 | 100,000 | None |
| All other | negligible* | less than 50K* | None |
| All species | 330,000 kg | 1 million kg | - |
Note: All notes below Table A1 also applies to Table A2.
Were there any trends in landings of key species over the past 10 years?
- Swordfish: Swordfish landed weights and values from this area have fluctuated, with a decreasing trend over the past 10 years. The highest landings and landed values occurred in the earlier years, with swordfish landings as high as 465,000 kilograms in 2012 and valued at $3.5 million.
- Offshore scallop: Scallop harvesting often follows a somewhat cyclical pattern that is typically longer than the five-year timeframe used in our analysis. When considering a longer period, the data suggests that scallop landed weights and values from this area exhibited a fluctuating pattern, with the highest landings and landed values occurring in recent years. Figures are grouped in the “lobster, scallop, and other shellfish”.
- Offshore lobster: Lobster landed weights and values from this area have a strong increasing trend over the past 10 years. The highest landings and landed values occurred in recent years. Figures are grouped in the “lobster, scallop, and other shellfish”.
How many harvesters fish in this AOI?
About 500 harvesters (including crew members) per year are associated with this AOI (i.e. not full-time equivalents). A significant portion participate in the Swordfish longline fishery.
How much employment income is generated by harvesters fishing in this AOI?
Roughly $2 million in employment income per year are collected by commercial marine harvesters associated with this AOI in recent years. This represents less than 0.5% of the annual employment income generated from all commercial fishing in the Maritimes Region.
How are commercial fisheries that have access to the AOI currently managed?
How fisheries are managed is too complex to describe succinctly in this document, please refer to the relevant Integrated Fisheries Management Plans (IFMPs) for more information:
| Fishery/fisheries | Integrated fisheries management plans (IFMPs) |
|---|---|
| Bluefin tuna | www.dfo-mpo.gc.ca/fisheries-peches/ifmp-gmp/bluefin-tuna-thon-rouge/bluefin-tuna-thonrouge2017-eng.html |
| Groundfish | www.dfo-mpo.gc.ca/fisheries-peches/ifmp-gmp/groundfish-poisson-fond/groundfish-poisson-fond-4vwx5-eng.html |
| Offshore lobster | www.dfo-mpo.gc.ca/fisheries-peches/ifmp-gmp/lobster-crab-homard/2019/index-eng.html |
| Offshore scallop | www.dfo-mpo.gc.ca/fisheries-peches/ifmp-gmp/scallop-petoncle/2018/index-eng.html |
| Swordfish and other tunas | www.dfo-mpo.gc.ca/fisheries-peches/ifmp-gmp/swordfish-espadon/NEW-swordfish-2013-espado-eng.html |
| Other fisheries | www.dfo-mpo.gc.ca/fisheries-peches/ifmp-gmp/index-eng.html |
How has the draft marine harvester profile for this AOI evolved?
Comments gathered throughout the consultative process have been carefully considered and incorporated, where feasible. Significant changes since the initial version are summarized below:
| Section(s) | Type of change(s) | Summary of change(s) |
|---|---|---|
| Page 1 | Revised text | Clarified introduction text |
| Pages 1 & 2 | Revised text | Corrected for the term licence holder versus harvester |
| Table 2 | Added information | Expanded licence holder information for tunas and swordfish |
| Table 3 | Additional analysis | Added active versus potential access analysis |
| Table 5 | Additional analysis | Added licence-level dependency analysis |
| Table 6 | Additional analysis | Added fleet/fishery level dependency analysis |
| Figures 1 & 2 | Additional analysis | Added seasonality analysis |
| Throughout | Revised analysis | Included a 40 km buffer zone for the pelagic longline fisheries |
| Appendix | Additional analysis | Harvester employment figures are estimated |
| Appendix | Added information | Provided links to Integrated Fisheries Management Plans |
- Date modified: