
Offshore Scallop - Maritimes Region
Foreword
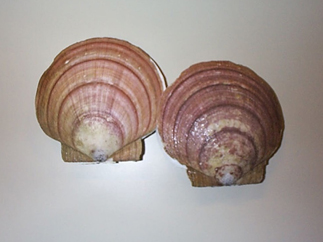
Sea Scallop
(Placopecten magellanicus)
The purpose of this Integrated Fisheries Management Plan (IFMP) is to identify the main objectives and requirements for the fishing for sea scallops (Placopecten magellanicus) and Iceland scallops (Chlamys islandica) by Canadian fishing vessels greater than 19.8m (65’) in overall length within Scallop Fishing Areas 25 – 27 in the Maritimes Region and Scallop Fishing Areas 10 – 12 in the Newfoundland Region, as well as the management measures that will be used to achieve these objectives. This document also serves to communicate the basic information on the fishery and its management to government, stakeholders and the public. This IFMP provides a common understanding of the basic “rules” for the sustainable management of the fisheries resource.
Through IFMPs, Fisheries and Oceans Canada (DFO) intends to implement an ecosystem approach to management (EAM) across all marine fisheries. The approach considers impacts extending beyond those affecting the target species and, in this respect, is consistent with the Food and Agriculture Organization’s Code of Conduct for Responsible Fisheries. Implementation will take place in a step by step, evolutionary way, building on existing management processes. Advances will be made incrementally, beginning with the highest priorities and issues that offer the greatest scope for progress. A summary of the regional EAM Framework is included as Appendix 1 to the IFMP.
This IFMP is not a legally binding instrument which can form the basis of a legal challenge. The IFMP can be modified at any time and does not fetter the Minister's discretionary powers set out in the Fisheries Act. The Minister can, for reasons of conservation or for any other valid reasons, modify any provision of the IFMP in accordance with the powers granted pursuant to the Fisheries Act.
Where DFO is responsible for implementing obligations under land claims agreement, the IFMP will be implemented in a manner consistent with these obligations. In the event that an IFMP is inconsistent with obligations under land claim agreements, the provisions of the land claims agreements will prevail to the extent of the inconsistency.
Signed: Regional Director, Fisheries Management, Maritimes Region
Table of Contents
1. Overview of the fishery
- 1.1. History of the fishery
- 1.2. Type of fishery
- 1.3. Participants
- 1.4. Location of fishery
- 1.5. Fishery characteristics
- 1.6. Governance
3. Social, cultural and economic importance of the fishery
- 3.1. Overview
- 3.2. Landings and landed value
- 3.3. Average price
- 3.4. Landings and landed value by bank
- 3.5. Canadian scallop exports
4. Management issues
- 4.1. Fisheries issues
- 4.2. Depleted species concerns
- 4.3. Oceans and habitat considerations
- 4.4. Benthic impacts
- 4.5. Lost gear
- 4.6. International issues
5. Objectives
6. Strategies and tactics
- 6.1. Productivity
- 6.2. Biodiversity
- 6.3. Habitat
- 6.4. Culture and sustenance
- 6.5. Prosperity
- 6.6. Insignificant pressures
11. Safety at sea
12. Glossary
13. References
Appendices
- Appendix 1: Summary of Maritimes Region EAM framework
- Appendix 2: The enterprise allocation program
- Appendix 3: History of EA percentage shares
- Appendix 4: Advisory committee terms of reference
- Appendix 5: Advisory committee membership list
- Appendix 6: Annual fishing plan procedures
- Appendix 7: TAC and landings values
- Appendix 8: Authorization to fish two banks
- Appendix 9: Quota carry-forward guidelines
- Appendix 10: C & P compliance summary
Figures
- Figure 1: Offshore scallop fishing areas (SFA) within Maritimes Region
- Figure 2: Offshore scallop fishing areas (SFA) within Newfoundland Region
- Figure 3: Georges (A) biomass estimates 1986 - 2015
- Figure 4: Maritimes region landed value by scallop fleets and major species groups, 2015p (preliminary)
- Figure 5: Offshore scallop landings and landed value, 1990-2015p (2014 and 2015 are preliminary)
- Figure 6: Scallop average price, Maritimes Region, 1998-2015p (2015 is preliminary)
- Figure 7: Canadian scallop export value by province, 2000-2015
- Figure 8: Canadian scallop exports by major market, 2015
- Figure 9: Canadian scallop export value by product form, 2000-2015
- Figure 10: Canadian scallop export value by product form and major market, 2015
- Figure 11: The Western/Emerald bank conservation area
Tables
- Table 1: Offshore scallop licence holders and EA shares (effective January, 2016)
- Table 2: The number of active vessels in 2016 and the number of vessels that remain eligible to be licensed, by company
- Table 3: SARA listed species
- Table 4: COSEWIC assessed species caught as bycatch
- Table 5: Discards on transboundary species on Georges bank
- Table 6: Strategies and tactics incorporating candidate reference points
- Table 7: Compliance issues and objectives
- Table 8: Compliance risks and mitigating strategies
- Table 9: Evaluation, monitoring and plan enhancement
1. Overview of the fishery
1.1. History of the fishery
Canadian participation in the offshore scallop fishery first began in 1945 with exploration on a number of banks off Nova Scotia and with the first landing (3.63t of meats) from Georges Bank by an offshore vessel. For the next 30 years the offshore scallop fishery was focused almost exclusively on Georges Bank with fleets operating from Nova Scotian ports in Lunenburg, Shelburne, Yarmouth, Saulnierville, Riverport, Liverpool and Port Mouton. Over the past 4 decades important beds of scallops have also been found and fisheries developed on Browns, German, Middle Ground, Sable, Western, Banquereau and St. Pierre banks. Nevertheless, Georges Bank still accounts, on average, for about 70-80% of annual offshore scallop landings.
A number of milestones mark the evolution of management of this fishery and it is important, from the historical perspective, that these milestones be recorded in this IFMP.
- In 1973, limited entry was introduced and the fishery restricted to 76 licensed vessels (vessels > 65’ length overall (LOA)).
- In 1977, Canada declared a 200-mile fishing zone - the result was that Canadian access to Georges Bank was limited to a zone disputed by Canada and the United States. Competitive fishing by both the Canadian and US scallop fleets continued in the disputed zone and grew more intensive until 1984.
- In 1984 the International Court of Justice (ICJ) established an international boundary in the Gulf of Maine. The northeast portion of Georges Bank was awarded to Canada and this set the stage for a shift away from competitive fishing.
- On October 30, 1986, the Minister announced the permanent separation of the inshore and offshore scallop fleets at the 43° 40’ North Latitude line near Yarmouth, NS. This announcement followed a series of discussions between DFO, the offshore scallop industry and inshore fishing fleets, which culminated in an agreement between fleet representatives.
- In 1986, the offshore scallop industry, with the approval of DFO, initiated a trial enterprise allocation (EA) program for Georges Bank.
- In 1989, the EA program first initiated as trial in 1986 was made permanent by the Minister.
- On July 5, 1996, following a court challenge, Justice W. Andrew MacKay, Federal Court of Canada confirmed the validity of the Minister’s decision in 1989 to continue fleet separation.
- By 1998, the EA program had expanded beyond Georges Bank to include all banks on which offshore scallop fishing occurred.
- In 2006 the Minister announced, for St. Pierre Bank, the geographical separation of the Newfoundland and Labrador inshore scallop fleet and the offshore scallop fleet. The inshore fleet obtained exclusive access to sea scallops on the North Bed of St. Pierre Bank and the offshore fleet obtained exclusive access to sea scallops on the Middle and South Beds.
1.2. Type of fishery
The offshore scallop fishery is entirely commercial in nature and managed on the basis of an enterprise allocation (EA) program. Each company receives a percentage share of the annual Total Allowable Catch (TAC) for each Scallop Fishing Area (SFA). The percentage shares were negotiated between the companies holding offshore scallop vessel licences in 1986 and were based on their historical fishing performance on Georges Bank and the number of vessel licences held by each company. For a complete document of the Enterprise Allocation Program see Appendix 2.
1.3. Participants
There are currently six companies (Table 1) holding offshore scallop licences.
The move from competitive fishing to an EA program in 1986, with permanent implementation in 1989, enabled companies to modernize an aging wooden fleet and, at the same time, match their fishing capacity to the available scallop resources. In 1986, there were nine companies holding licences for 76 offshore scallop vessels, of which 68 were active. In 2004, the six remaining licence holders had consolidated the EA shares which have remained constant through 2016 (Table 1) and operated 17 vessels which by 2016 had been reduced to 12 active vessels (Table 2). Appendix 3 provides the complete history of the company names and their respective EA shares for the period 1986 to 2016.
| Company Name | % Share of TAC |
|---|---|
| LaHave Seafoods Limited | 5.92 |
| Mersey Seafoods Limited | 7.00 |
| Adams and Knickle Limited | 9.77 |
| Comeau’s Sea Foods Limited | 16.68 |
| Ocean Choice International L.P. | 16.77 |
| Clearwater Seafoods Limited Partnership | 43.86 |
| Company Name | Active 2016 | Eligible |
|---|---|---|
| LaHave Seafoods Limited | 1 | 4 |
| Mersey Seafoods Limited | 2 | 6 |
| Adams and Knickle Limited | 2 | 7 |
| Comeau’s Sea Foods Limited | 3 | 12 |
| Ocean Choice International L.P. | 1 | 12 |
| Clearwater Seafoods Limited Partnership | 3 | 35 |
1.4. Location of fishery
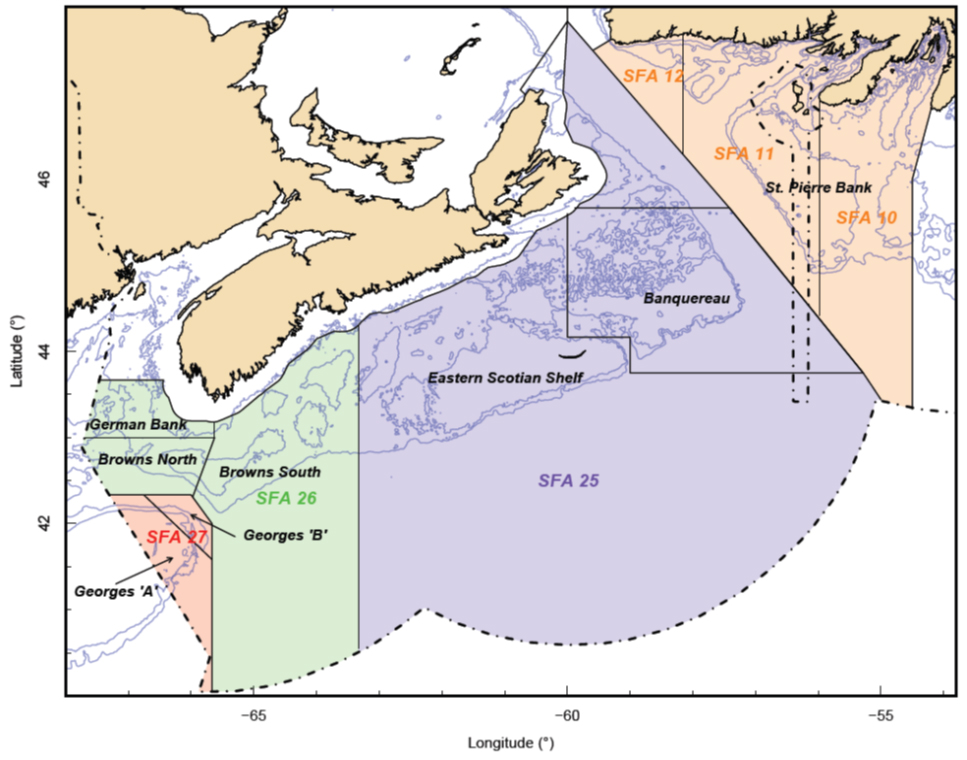
Offshore scallop fisheries are conducted on Georges Bank (Scallop Fishing Area 27), Browns and German Banks (Scallop Fishing Area 26), the Eastern Scotian Shelf (Scallop Fishing Area 25) and St. Pierre Bank (Scallop Fishing Areas 10, 11 and 12). Figures 1 and 2 contain maps delineating the Scallop Fishing Areas (SFAs).
In 1998, Georges Bank was split into Georges Bank (A) and (B) and Browns Bank was split into Browns Bank (North) and (South) based on their productivity and historical fishing patterns. Georges Bank (A) was identified as the more productive (traditional) fishing area and Georges Bank (B) as the less productive (non-traditional) area. Similarly for Browns Bank; Browns Bank (North) was identified as the more productive area and Browns Bank (South) as the less productive area.
Figure 1: Offshore Scallop Fishing Areas (SFA) within Maritimes region
Description
Figure 1—Offshore Scallop Fishing Areas (SFA). Individual banks are indicated by text within the SFAs. The dotted line indicates the Exclusive Economic Zone (EEZ) of France.
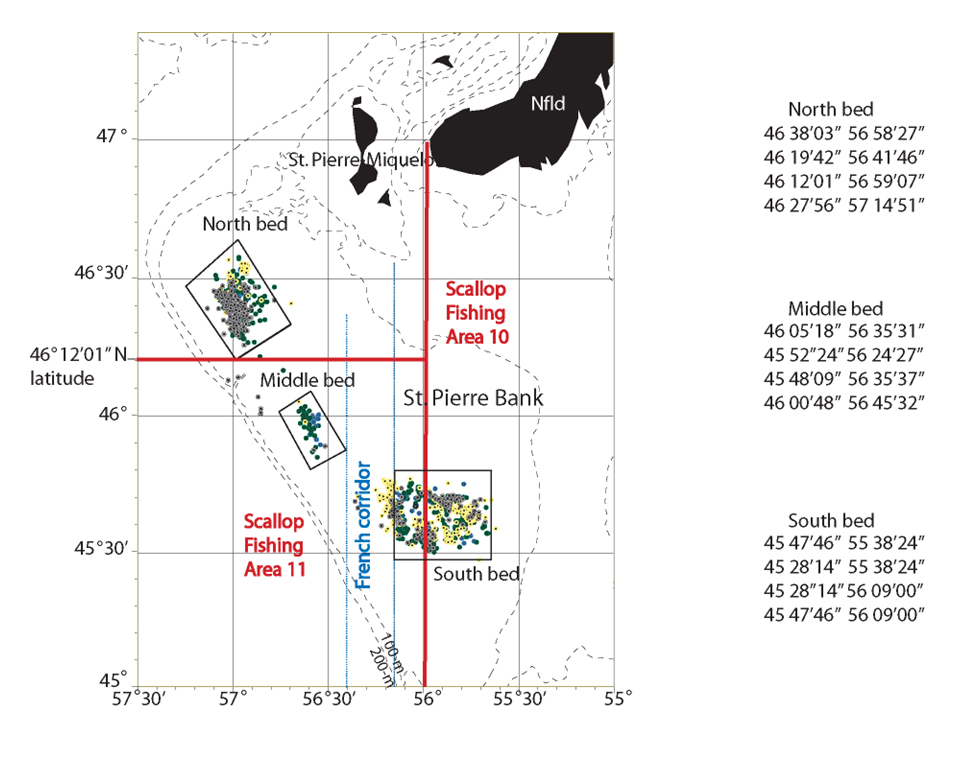
Figure 2: Offshore Scallop Fishing Areas (SFA) within Newfoundland region
Description
Figure 2: Offshore Scallop Fishing Areas (SFA) within Newfoundland region
| North Bed | |
|---|---|
| Latitude | Longitude |
| 46°38'03" | 56°58'27" |
| 46°19'42" | 56°41'46" |
| 46°12'01" | 56°59'07" |
| 46°27'56" | 57°14'51" |
| Middle Bed | |
|---|---|
| Latitude | Longitude |
| 46°05'18" | 56°35'31" |
| 45°52'24" | 56°24'27" |
| 45°48'09" | 56°35'37" |
| 46°00'48" | 56°45'32" |
| South Bed | |
|---|---|
| Latitude | Longitude |
| 45°47'46" | 55°38'24" |
| 45°28'14" | 55°38'24" |
| 45°28'14" | 56°09'00" |
| 45°47'46" | 56°09'00" |
1.5. Fishery characteristics
1.5.1. Management measures
To ensure sustainability of the offshore scallop fishery, different management measures or controls have evolved through the years. Some of these measures may be found in the regulations that govern the fishery while others have been developed and implemented through licence conditions or by policy to address specific fishery issues. Some regulatory measures such as average meat count and season openings can be modified with DFO approval through the use of DFO Variation Orders. Details of the annual quotas, seasons, and management measures are included in the annual fleet fishing plans which are available upon request.
Limited entry
The offshore scallop fishery is a limited entry fishery. Current licence holders who wish to exit the fishery may request the reissuance of their licence to fishers who meet the general criteria of the Commercial Fisheries Licensing Policy for Eastern Canada, 1996 and satisfy the provisions governing the permanent transfer of EAs as set out in the Administrative Guidelines for the Enterprise Allocations in the Offshore Scallop Fishery (Appendix 2). However, no additional licences are available.
Licence conditions
Management measures are, in part, enforced through licence conditions which may specify dates of fishing, areas of fishing, and any other requirements that must be followed while fishing. These may also include, but are not limited to, monitoring requirements, definitions of areas open or closed for fishing and direction in handling bycatch.
Meat counts
In order to mitigate against the harvest of small scallops, average meat counts (expressed as number of scallop meats per 500g) are set and identified within the annually approved fishing plan.
The licence holders fund a meat weight port sampling program where an independent dockside monitoring company samples the catch from each trip. This information is shared among the licence holders and is provided to DFO.
Although compliance with meat count regulations has not been an issue in the offshore scallop fishery for some time (confirmed by the meat count results from each trip provided by the port sampling program), fishery officers are available for and remain trained to conduct meat counts on offshore scallop landings.
Total Allowable Catch (TAC)
TAC quotas for each Scallop Fishing Area are established annually based on scientific advice and industry input. The Offshore Scallop Advisory Committee (OSAC) submits recommendations on the TAC based on acceptable exploitation rates that are adjusted based on biological evidence.
Individual Transferable Quotas (ITQs)
The approved TAC is distributed based on individual enterprise allocation (EA) shares and managed through Individual Transferable Quotas (ITQs) as identified in the Enterprise Allocation Program document (Appendix 2).
Monitoring requirements
- All offshore scallop licence holders must hail out to the Interactive Voice Recognition (IVR) center at the start of a fishing trip and must hail in to a Dockside Monitoring Company (DMC) before they land.
- Dockside Monitoring Program (DMP) - Commencing in 1997 and consistent with DFO’s approach in other (EA) fisheries, licence conditions require all scallops landed from offshore scallop vessels to be monitored by a DMP company with catch data from each landing being entered directly by the DMP Company to DFO where the weights are recorded against the EA of the appropriate company.
- All licence holders are required to submit monitoring documents to an approved DMC for entry into the DFO database.
- Vessel Monitoring Systems (VMS) – With the creation of Georges Bank (B) and Browns Bank (South), where meats counts higher than on Georges Bank (A) and Browns Bank (North) are permitted, concerns were raised about maintaining TAC integrity between fishing areas in such close proximity. To overcome this concern, licence conditions were developed, in consultation with the industry, which offered licence holders the option to carry observers or install VMS devices which provide vessel location information. All licence holders opted and paid for VMS and, since then, real time electronic monitoring is provided by all offshore scallop vessels regardless of the area being fished.
- At-sea monitoring – in order to identify the quantity and species composition of all catch, industry is required to take an at-sea observer on at least 2 trips/month on Georges Bank (A).
1.5.2. Gear
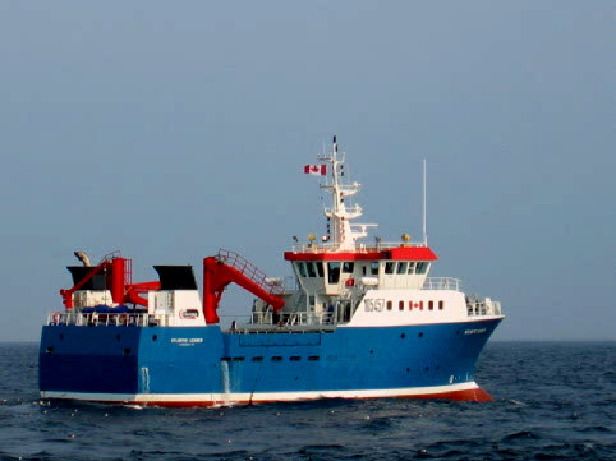
The active Canadian offshore scallop fleet (2016) consists of 5 freezer vessels and 7 vessels without freezing capabilities (wetfish vessels). Freezer vessels (Photo 1) have a typical crew complement of 25-32 while the wetfish vessels usually have 17-19 crewmembers each. The total crew complement for the offshore scallop fleet is about 300 – mostly year-round jobs. Offshore scallops vessels are all > 27.4 m (90’) Length Overall (LOA). Freezer vessels are the largest and generally exceed 39.6 m (130’) LOA.
Photo 1: Offshore scallop freezer vessel
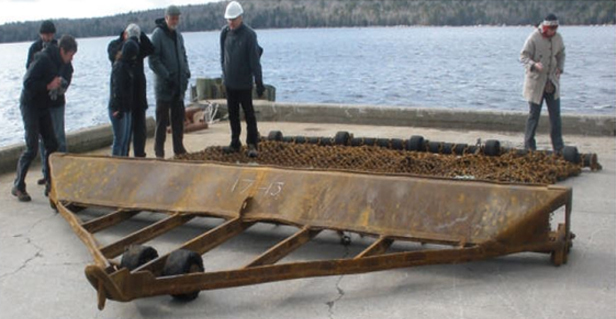
The vessels fish by towing steel scallop drags (rakes) (Photo 2) along the seabed and are capable of towing two to three: drags in use have ranged from approximately 12' to 17' wide each. The duration of fishing trips varies from 10-12 days on a wetfish vessel up to about 22 days on a freezer vessel.
Photo 2: New Bedford rake
1.5.3. Time frame of the fishery
The operating premise for the offshore scallop fishery is that the season is open all year, subject only to TACs being caught. Seasons are reviewed annually through the Advisory Committee process. German Bank has an intensive six-month inshore lobster fishery from November to the end of May the following year. To avoid gear conflicts, the offshore scallop fleet has made a decision to not fish German Bank during the open lobster season. There are also two specific area closures on Georges Bank: one for approximately seven weeks in February and March to protect spawning cod and one for the month of June to protect yellowtail flounder. (The closures are controlled through annual Variation Orders).
1.6. Governance
1.6.1. Domestic legislation
DFO oversees Canada’s scientific, ecological, social and economic interests in oceans and fresh waters. That responsibility is guided by the Fisheries Act, which confers responsibility to the Minister for the management of fisheries, habitat and aquaculture and the Oceans Act (1996), which charges the Minister of Fisheries and Oceans Canada with leading oceans management. The Department is also one of three responsible authorities under the Species at Risk Act (2002), along with Environment and Climate Change Canada (ECCC) and Parks Canada. All three Acts contain provisions relevant to fisheries management and conservation. However, the Fisheries Act is the Act from which the principal set of regulations affecting the licensing and management of fisheries flow. In the Atlantic, these include the Fishery (General) Regulations (FGRs), the Atlantic Fishery Regulations 1985 (AFRs) and the Aboriginal Communal Fishing Licences Regulations (ACFLRs).
Offshore scallop licences are issued pursuant to the absolute discretion of the Minister of Fisheries and Oceans as per Section (7) of the Fisheries Act. The issuance of licence conditions is pursuant to section 22, Fishery (General) Regulations.
The Fishery (General) Regulations provide DFO the authority to specify certain conditions in a fishing licence. For example, it is through the use of licence conditions that DFO is able to require fishing fleets to use vessel monitoring systems (VMS), to hail out/in and to utilize approved independent third parties, i.e., the dockside monitoring Program (DMP) to verify landings.
Regulations governing the offshore scallop fishery can be found in the Atlantic Fishery Regulations, 1985 and the Fishery (General) Regulations. These regulations form the foundation of the management system and establish the fundamental rules under which the fishery is governed: i) meat counts, ii) fishing seasons, and, iii) licence conditions.
Meat counts and fishing seasons are set out in the Atlantic Fishery Regulations, 1985. Variation orders are used to increase or decrease meat counts and to adjust fishing season, as appropriate. Variation orders affecting the offshore scallop fleet are signed by the Regional Director-General, Maritimes Region of DFO and have the same effect as regulations. Variation orders can be applied to any SFA or portion of an SFA.
1.6.2. Domestic licensing and conservation policies
The management of the commercial fisheries is governed by a suite of policies related to the granting of access, economic prosperity, resource conservation and traditional Aboriginal use. Information on these can be found on the DFO website. Notable policies include the Commercial Fisheries Licensing Policy for Eastern Canada 1996, and policies under the Sustainable Fisheries Framework, such as the Precautionary Approach Framework, Sensitive Benthic Area Policy and the Bycatch Policy.
1.6.3. Ecosystem approach to management
This management plan has been developed according to a framework for an ecosystem approach to management (EAM). The framework assists DFO with implementing departmental policies related to conservation and sustainable use, as well as with meeting obligations related to integrated management under the Oceans Act. The framework requires that fisheries management decisions reflect the impact of the fishery not only on the target species but also on non-target species, habitats and the ecosystems of which these species are a part. It also requires that decisions account for the cumulative effect of various ocean uses on the ecosystem. Additional information on the framework is included as Appendix 1 to this plan.
1.6.4. Advisory committees and working groups
The Offshore Scallop Advisory Committee (OSAC) is currently the formal advisory body to DFO for all offshore scallop consultations. Smaller working groups may also be utilized to provide a forum for discussion on issues that are difficult to deal with at the larger committee. See Appendix 4 for the terms of reference and Appendix 5 for the membership list.
1.6.5. Regional advisory process
The Canadian Science Advisory Secretariat (CSAS) provides science advice on the status of the George’s Bank (A) and Browns Bank (North) Offshore scallop stocks through a multiyear science advice process. Annual CSAS updates are provided in the form of Science Response Reports. Approximately every four years a Regional Peer Review provides science advice in the form of a Framework Process and/or a formal Stock Assessment. Frameworks provide a review of the stock assessment methods. Assessments typically follow Frameworks and provide advice using the Framework methodology. Products of a Regional Peer Review include Research Documents, Science Advisory Reports, and Proceedings. Industry participates in the Regional Peer Review. The stock status advice is a primary input for the consultations on management of the fishery at the advisory committee.
1.6.6. Approval process
Recommendations and advice to DFO on the management of the offshore scallop fishery are provided through the OSAC. This information is reviewed and assessed by Senior Management Officials within DFO prior to decisions and/or approvals being granted by the Regional Director and/or Regional Director-General, Maritimes Region.
In general, long-term Integrated Fisheries Management Plans are developed by DFO in consultation with the fishing industry, provincial and territorial governments, First Nations communities, advisory bodies and other interested stakeholders and partners. As well, industry submits annual fishing plans in support of the IFMP management measures. Procedures for establishing and amending these annual fishing plans have been finalized with industry (Appendix 6).
Approval of the IFMP and annual fishing plan (TACs, seasons, and meat counts) is at the level of Regional Director, Maritimes Region.
In 2006, the Nova Scotia based offshore scallop fleet and the Newfoundland and Labrador inshore scallop fleet were geographically separated in terms of their access to sea scallop beds on St. Pierre Bank. While each DFO Region has the authority to approve the fishing plans for their respective fleets, there is a written agreement between the Regional Directors-Generals to keep each other informed on all management recommendations that could impact the sea scallop fishery on St. Pierre Bank.
2. Stock assessment, science, and traditional knowledge
The Canadian Science Advisory Secretary coordinates the peer review of scientific issues for DFO.
2.1. Biological synopsis
The sea scallop, Placopecten magellanicus, is found only in the Northwest Atlantic from Cape Hatteras to Labrador and inhabits a variable depth range of about 10–100 m. Scallops are aggregated in patches and harvestable concentrations called beds. The natural extent of these beds is believed to be determined by favourable local conditions, such as water temperature, food availability, and substrate type, as well as spawning and settlement success. Dense aggregations of juveniles can be found in areas where the density of adults had been low; thus the distribution of juveniles does not necessarily match the distribution of adults at any one time.
The sea scallop has separate sexes, unlike many other commercial scallop species. In the summer months the male scallops develop a white gonad, while female gonads are bright red. Eggs and sperm are released into the water and fertilization takes place in the sea. Spawning typically begins in late August to early September and larvae drift in the water for almost a month before settling to the bottom in October.
Newly-settled sea scallops attach themselves to gravel, shells and other objects via byssus threads to avoid being swept away by currents. At this stage, the juveniles prefer cryptic habitat to avoid predation. While adult sea scallops are found on a variety of substrate types, scallop densities tend to be higher on gravel and gravel-lag sediment types. Scallops can move to avoid predators by taking water into the body cavity area and then squeezing the two valves of shell together to force the water out from the corners of its hinge propelling the scallop forward. Laboratory studies have demonstrated that swimming bouts rarely last more than 15-20 s or that scallops exceed 1 m above the bottom. When undisturbed, scallops rarely swim. This suggests that swimming bouts are mainly used for predator avoidance.
Sea scallops are active suspension-feeders relying on suspended detrital material and phytoplankton for their food.
Scallop growth is characterized by measuring shell height (distance between hinge and the opposite ventral margin). Shell heights can range up to 20 cm but are rarely larger than 15 cm in fished areas. Ages are determined from annual rings on the shell that result from the slowing or cessation of growth which usually occurs in the late winter. Scallop growth can vary between beds and even within beds if there are depth gradients or differences in bottom current strength. The relationship with depth is probably a proxy for relationships with other environmental variables (e.g., temperature, food availability, oxygen, predation, etc.) that are depth related. Growth can also vary annually possibly due to inter-annual differences in food availability. The weight of the adductor muscle is partly related to the size of the shell but may also depend upon food availability. The adductor muscle stores food energy in the form of glycogen and the weight will vary seasonally reflecting periods of feeding, fasting and transferring energy to the gonads for reproduction.
Natural mortality of sea scallop is high during its planktonic larval stage. During this stage unfavourable environmental conditions can retard development, currents can sweep larvae away from suitable habitats, and larvae are subject to predation by larger organisms. Once in their adult form, scallops contend with predation from sea stars, predatory snails, crustaceans, and some fish species.
2.2. Ecosystem interactions
Data on fish and invertebrate species caught as bycatch in the scallop fishery have been obtained via at-sea observers from the Georges Bank fishery, sporadically in the 1990’s and continuously since August 2004. Discards of cod, haddock and yellowtail flounder are estimated on a monthly basis and have been reported in assessment documents since 2008.
2.3. Aboriginal traditional knowledge/ Traditional ecological knowledge
The offshore scallop fishery is conducted in relatively deep water; 60m (200') and greater and often more than 80 kilometres from shore. No Aboriginal traditional knowledge (ATK) is available for the areas where the offshore scallop fishery occurs.
Traditional ecological knowledge (TEK) from fish harvesters would exist for Georges Bank going back 65 years to the inception of that fishery. TEK on other offshore banks is of shorter duration as most were discovered after the commercial exploitation of Georges Bank began in 1945. TEK on the banks currently exploited consists mainly of where the scallops are found, the species incidentally captured in the drags and the general bottom type. An extensive survey by the offshore sector in 1997 did not reveal any new commercially viable beds of scallops in SFAs 25, 26 and 27.
2.4. Stock assessment
2.4.1. Maritimes Region
Science advice is provided annually for all offshore scallop fishing areas within the Maritimes region. Joint industry - DFO Science annual surveys are conducted on the offshore scallop banks from May to August.
The Regional Advisory Process (RAP) provides the forum to review and update the scientific assessment. A biomass-based population model is used to evaluate the impact of the past fishery and evaluate future catch levels for Browns Bank (North) (DFO, 2015a) and Georges Bank (A) (DFO, 2015b). Survey trends and commercial catch rates are used to evaluate the impact of the past fishery for Banquereau Bank, Browns Bank (South), Georges Bank (B), German Bank, and Sable/Western Bank.
2.4.2. Newfoundland and Labrador Region
In the Newfoundland and Labrador region the stock assessment for Iceland scallop on the St. Pierre Bank is scheduled for every 3 years and Sea Scallop every 4 years. As in the Maritimes region, the Regional Advisory Process (RAP) provides the forum to review and update the scientific assessment.
In 2015, a post season DFO research vessel survey followed a stratified random sampling scheme based on beds. Sets were optimally allocated in proportion to stratum-specific area and variance of the catch rates from the 2003 survey. Biomass (MDB - minimum dredgeable biomass) was derived by STRAP (Stratified Analysis Programs; a computer analysis system for groundfish research trawl survey data) from swept area estimates within survey strata. The 2016 sea scallop assessment for the St. Pierre Bank offshore.
In the area south of Newfoundland and St. Pierre and Miquelon, France and Canada receive 70% and 30% respectively of the Iceland scallop TAC. The most recent Iceland Scallop stock assessment for St. Pierre Bank was conducted in 2009 by a Canadian research survey. This survey also followed the stratified random sampling scheme based on area and depth used since 1990.
Prior to 2006 the offshore and inshore fleets fished sea scallops in the same area. In 2006, following the Hooley report and a Ministerial decision, the offshore fleet was restricted to the southern part of St. Pierre Bank and given sole access to the Southern and Middle Beds in that area.2.5. Precautionary approach
A precautionary approach (PA) framework has been implemented in the offshore scallop fishery for the most important fishing area, Georges Bank (A), which represents > 70% of the fishery. Candidate reference points have been proposed for Browns Bank (North) but this framework has not yet been accepted. An analytical model has been developed for both of these areas and as models are developed for other areas we will consider the application of PA framework to those areas.
This PA framework reflects the best available knowledge with respect to biomass based proxy reference points at this point in time and may be updated as new information becomes available. For the areas for which a PA framework has yet to be developed, the offshore scallop fishery has been managed responsibly in the absence of explicit reference points and harvest control rules based on monitoring a number of indicators such as size distribution, incoming recruitment, growth, catch rates and meat quality. These other indicators will remain considerations in the context of the PA framework for scallops as they can provide a more robust understanding of the status of the scallop stock than biomass alone.
Georges (A) – Reference points
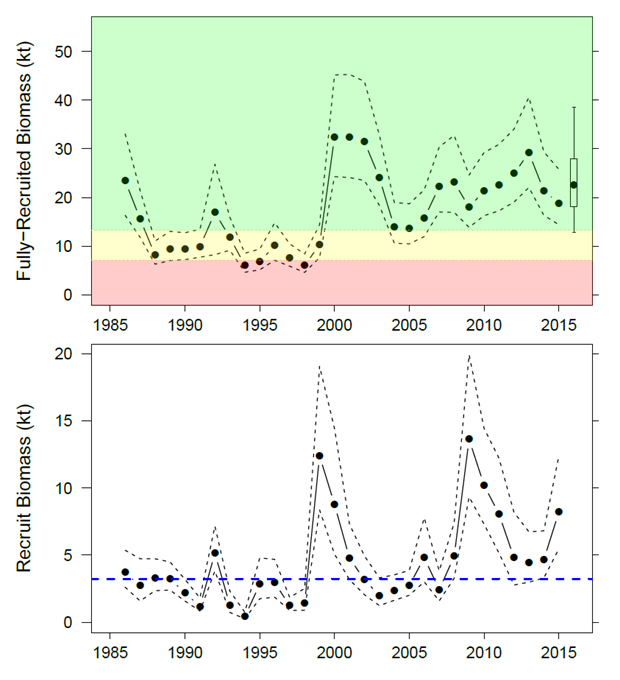
Fully recruited biomass (>95mm shell height) estimates are generated from the model for Georges (A) scallops from a delay-difference model fit to the survey and commercial data for Georges (A). The PA framework for offshore scallops will use fully-recruited biomass estimates from the available time series (1986-2009) as produced by the delay-difference model to generate reference points. Exploitation rate is defined as catch/modelled biomass. Catch here is defined as the catch from September 1-August 31st to align with survey timing.
Figure 3 below provides biomass estimates for fully-recruited (top panel) and recruit (85 to 95 mm shell height; lower panel) scallops from the stock assessment model fit to the Georges Bank (A) survey and commercial data. Dashed lines are the upper and lower 95% credible limits on the estimates. Coloured zones (from top to bottom) represent the healthy (green), cautious (yellow) and critical (red) zones (reference points described below). The blue horizontal dashed line in the lower panel represents the long-term median recruit biomass. The forecasted fully-recruited biomass for 2016, assuming a catch of 3,000 t, is displayed as a box plot with median (●), 50% credible limits (box) and 80% credible limits (whiskers).
Figure 3: Georges (A) biomass estimates 1986 - 2015
Description
Figure 3: Georges (A) biomass estimates 1986 - 2015
| Year | Fully-Recruited Biomass (kt) | Recruit Biomass (kt) |
|---|---|---|
| 1986 | 23867 | 3789 |
| 1987 | 16040 | 2758 |
| 1988 | 8344 | 3356 |
| 1989 | 9614 | 3277 |
| 1990 | 9555 | 2251 |
| 1991 | 10130 | 1197 |
| 1992 | 17051 | 5268 |
| 1993 | 12073 | 1280 |
| 1994 | 6228 | 419 |
| 1995 | 6946 | 2902 |
| 1996 | 10240 | 3019 |
| 1997 | 7854 | 1282 |
| 1998 | 6079 | 1417 |
| 1999 | 10530 | 12672 |
| 2000 | 33053 | 8908 |
| 2001 | 33000 | 4850 |
| 2002 | 32125 | 3222 |
| 2003 | 24514 | 2035 |
| 2004 | 14223 | 2424 |
| 2005 | 14084 | 2792 |
| 2006 | 16051 | 4946 |
| 2007 | 22746 | 2442 |
| 2008 | 24524 | 5071 |
| 2009 | 18496 | 14002 |
| 2010 | 21770 | 10431 |
| 2011 | 23172 | 8142 |
| 2012 | 25512 | 4840 |
| 2013 | 29839 | 4550 |
| 2014 | 21915 | 4788 |
| 2015 | 19209 | 8407 |
Upper (Target) stock reference point – 13,284 t
For Georges Bank (A) the Upper (Target) Stock Reference Point is set at 80% of the mean fully-recruited biomass from 1986-2009, a period of time that reflects a broad range of fluctuations in the productivity of the stock.
Lower reference point – 7,137 t
For Georges Bank (A) the Lower (Limit) Reference Point is set at 30% of the mean fully-recruited biomass from 1986-2009, a period of time that reflects a broad range of fluctuations in the productivity of the stock. While scallops have not been shown to demonstrate a stock recruitment relationship, this reference point is felt to be a precautionary measure.
Georges (A) - Harvest control rules
When biomass is above the Upper Stock Reference point (USR):
- measures should promote the fully-recruited biomass remaining above the USR;
- the target exploitation rate will be 25% of fully recruited biomass. Above the Upper Stock Reference point there is flexibility in increasing the exploitation rate; and
- the TAC can be increased despite projected decline in the biomass, provided it is not expected to reduce the fully recruited biomass significantly below the USR.
When biomass is between the Lower Reference Point (LRP) and the Upper Stock Reference point (USR):
- measures should generally promote the rebuilding of biomass towards the Upper Stock Reference Point, subject to natural fluctuations that may be expected to occur in biomass and survey results; and
- the TAC should not be increased if this can reasonably be expected to result in decline trend in the fully recruited biomass.
When biomass is below the Lower Reference Point (LRP):
- measures must explicitly promote an increase in the biomass;
- the exploitation rate must be in the context of a rebuilding plan; and
- if the stock falls below the proxy LRP, research may be undertaken to better determine the true Limit Reference Point for this stock, the level below which reproductive success would be seriously impaired.
2.6. Research
Research in the scallop program is concentrating on refining the population models for those areas where they are used and understanding the spatial and temporal patterns of scallop growth and survival.
3. Social, cultural and economic importance of the fishery
3.1. Overview
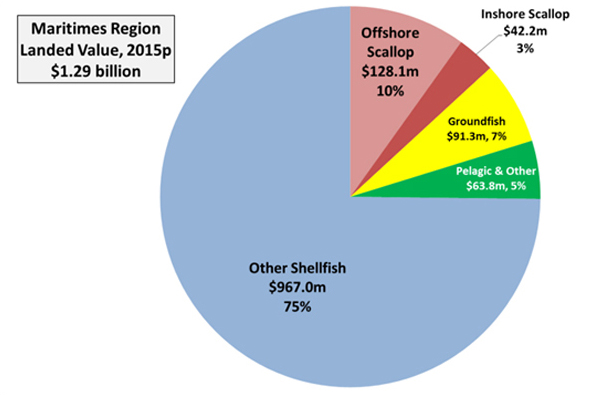
The offshore scallop fishery is one of the key commercial fisheries in the Maritimes Region, representing approximately 75 percent of all scallop landed value, and about 10 percent of the total landed value from all commercial fisheries in the region (see Figure 4; preliminary data).
The offshore scallop fleet consists of six company enterprise allocation holders that fish year-round; it operated 12 large offshore fishing vessels in 2017. These vessels provided employment for approximately 300 people in recent years with the fleet’s landings providing further economic benefits onshore in processing, marketing, and administration.
The estimated landed value for offshore scallop is calculated based on the annual average price for scallop landings by inshore fleets in the Maritimes Region, multiplied by the actual landings by the offshore scallop fleet. The average price for the offshore scallop fleet is unavailable due the nature of the processing prior to sale.
Figure 4: Maritimes region landed value by scallop fleets and major species groups, 2015p (preliminary)
Data source: DFO Maritimes Region
Description
Figure 4: Maritimes region landed value by scallop fleets and major species groups, 2015p (preliminary)
| Species | Amount |
|---|---|
| Offshore Scallop | $128,070 |
| Inshore Scallop | $42,192 |
| Groundfish | $91,338 |
| Pelagic & Other | $63,753 |
| Other Shellfish | $966,990 |
| Total | $1,292,343 |
| - | - |
| Scallop | $170,262 |
3.2. Landings and landed value
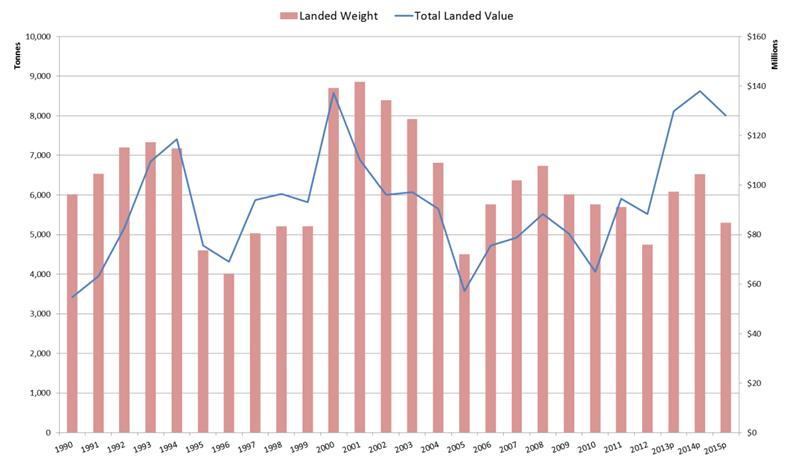
Landings of offshore scallop appear to follow the cyclical nature of the resource, as the fishery total allowable catch (TAC) increases and decreases to reflect resource abundance. Landed value in the offshore scallop fishery follows the resource changes as well as other market factors, including currency exchange rates. Again, landed value is estimated based on the average annual landed price for inshore scallop. Figure 5 provides a time series showing landings and landed value for the offshore scallop fishery; landings are shown in terms of tonnes of meats (t).
Offshore scallop landings reached an early peak of 7,331 t (meat weight) in 1993 before declining to just over 4,000 t in 1996. Landings rose again to reach 8,859 t in 2001, and declined again to around 4,500 t in 2005. Another landings cycle saw landings reach 6,730 t in 2008, and decline again to 4,747 t in 2012. Landings in 2014 showed an increase to 6,519 t before declining to 5,303 t in 2015 (2014 and 2015 data is preliminary).
Landed values followed the landings cycles to a large degree, reaching highs of $118.6 million in 1994, and $137.3 million in 2000. Strong landings, improved markets and favourable exchange rates caused 2014 landed value to reach an estimated $138.0 million before declining to $128.1 million in 2015 (2014 and 2015 data is preliminary).
Figure 5: Offshore scallop landings and landed value, 1990-2015p (2014 and 2015 are preliminary)
Data source: DFO Maritimes Region
Description
Figure 5: Offshore scallop landings and landed value, 1990-2015p (2014 and 2015 are preliminary
| tonnes (meats) | '06-15 Ave | 1990 | 1991 | 1992 | 1993 | 1994 | 1995 | 1996 | 1997 | 1998 | 1999 | 2000 | 2001 | 2002 | 2003 | 2004 | 2005 | 2006 | 2007 | 2008 | 2009 | 2010 | 2011 | 2012 | 2013p | 2014p | 2015p |
|---|---|---|---|---|---|---|---|---|---|---|---|---|---|---|---|---|---|---|---|---|---|---|---|---|---|---|---|
| Banquereau Bank | 3.5 | - | - | - | - | - | - | - | - | 51.0 | 148.0 | 146.7 | 89.4 | 5.0 | 0.0 | 0.0 | 10.4 | 0.0 | 24.8 | 0.0 | 0.0 | 0.0 | 0.0 | 10.0 | 0.0 | 0.0 | 0.0 |
| Browns Bank North | 645.0 | 207.0 | 215.0 | 454.0 | 575.0 | 1,403.0 | 2,002.0 | 743.0 | 500.0 | 500.0 | 200.0 | 748.0 | 999.0 | 648.9 | 1,002.6 | 2,007.3 | 1,067.7 | 912.0 | 1,197.6 | 393.0 | 0.0 | 201.1 | 1,027.1 | 475.7 | 749.0 | 745.8 | 748.8 |
| Browns Bank South | 1.5 | - | - | - | - | - | - | - | - | 99.0 | 293.0 | 199.6 | 98.9 | 97.8 | 97.4 | 184.6 | 38.4 | 14.2 | 0.6 | 0.0 | 0.0 | 0.0 | 0.0 | 0.0 | 0.2 | 0.0 | 0.0 |
| Eastern Scotian Shelf | 71.3 | 434.0 | 389.0 | 524.0 | 250.0 | 116.0 | 150.0 | 175.0 | 174.0 | 265.0 | 277.0 | 194.8 | 198.5 | 178.1 | 228.5 | 245.6 | 235.0 | 139.7 | 149.5 | 86.6 | 33.0 | 31.2 | 27.3 | 61.0 | 87.6 | 40.3 | 56.4 |
| Georges Bank A | 4,718.5 | 5,219.0 | 5,800.0 | 6,151.0 | 6,191.0 | 5,003.0 | 1,984.0 | 2,995.0 | 4,259.0 | 3,191.0 | 2,503.0 | 6,211.8 | 6,479.7 | 6,469.3 | 5,984.7 | 3,517.9 | 2,483.7 | 3,931.5 | 4,000.2 | 5,498.5 | 5,523.7 | 5,291.2 | 4,517.0 | 4,001.2 | 4,998.9 | 5,406.3 | 4016.6 |
| Georges Bank B | 199.1 | - | - | - | - | - | - | - | - | 800.0 | 1,196.0 | 600.9 | 394.7 | 192.3 | 199.4 | 199.7 | 200.8 | 162.2 | 400.1 | 357.7 | 260.1 | 66.5 | 0.0 | 46.8 | 108.2 | 190.6 | 398.4 |
| German Bank | 260.4 | - | - | - | 200.0 | 600.0 | 399.0 | 91.0 | 100.0 | 301.0 | 597.0 | 599.2 | 599.0 | 796.9 | 399.2 | 401.2 | 199.3 | 601.3 | 598.7 | 394.0 | 199.6 | 169.5 | 126.0 | 152.0 | 144.1 | 136.4 | 82.5 |
| St. Pierre Bank | 0.5 | 152.0 | 134.0 | 67.0 | 115.0 | 49.0 | 68.0 | 18.0 | 3.0 | 0.0 | 0.0 | 4.1 | 0.0 | 0.0 | 0.0 | 251.0 | 267.0 | 5.2 | 0.0 | 0.0 | 0.0 | 0.0 | 0.0 | 0.0 | 0.0 | 0.0 | 0.0 |
| - | - | - | - | - | - | - | - | - | - | - | - | - | - | - | - | - | - | - | - | - | - | - | - | - | - | - | - |
| - | 5,899.8 | 6,012 | 6,538 | 7,196 | 7,331 | 7,171 | 4,603 | 4,022 | 5,036 | 5,207 | 5,214 | 8,705 | 8,859 | 8,388 | 7,912 | 6,807 | 4,502 | 5,766 | 6,372 | 6,730 | 6,017 | 5,759 | 5,697 | 4,747 | 6,088 | 6,519 | 5,303 |
| - | - | - | - | - | - | - | - | - | - | - | - | - | - | - | - | - | - | - | - | - | - | - | - | - | - | - | - |
| Inshore average price (round) | - | - | - | - | - | - | $1.98 | $2.07 | $2.25 | $2.23 | $2.15 | $1.90 | $1.50 | $1.38 | $1.48 | $1.60 | $1.53 | $1.58 | $1.49 | $1.58 | $1.61 | $1.36 | $2.00 | $2.24 | $2.57 | $2.55 | $2.91 |
3.3. Average price
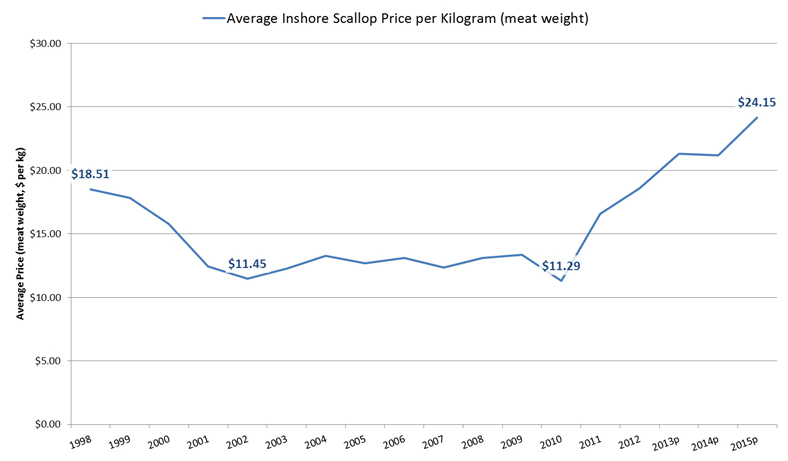
For the purposes of this analysis, the average price for scallop is based on the average annual inshore price for scallop in Maritimes Region. The nominal price declined from $18.51 per kilogram in 1998 and averaged $12.54 per kilogram (between a range of $11.29 and $13.36 per kilogram) during the 2001 to 2010 period. The price then increased, rising to $24.15 per kilogram in 2015p. Figure 6 shows the average annual price for inshore scallop in the Maritimes Region from 1998 to 2015p (preliminary).
Figure 6: Scallop average price, Maritimes Region, 1998-2015p (2015 is preliminary)
Data source: DFO Maritimes Region
Description
Figure 6: Scallop average price, Maritimes Region, 1998-2015p (2015 is preliminary)
| - | '06-15 Ave | 1990 | 1991 | 1992 | 1993 | 1994 | 1995 | 1996 | 1997 | 1998 | 1999 | 2000 | 2001 | 2002 | 2003 | 2004 | 2005 | 2006 | 2007 | 2008 | 2009 | 2010 | 2011 | 2012 | 2013 | 2014p | 2015p |
|---|---|---|---|---|---|---|---|---|---|---|---|---|---|---|---|---|---|---|---|---|---|---|---|---|---|---|---|
| Banquereau Bank | $49 | - | - | - | - | - | $0 | $0 | $0 | $944 | $2,641 | $2,314 | $1,113 | $57 | $0 | $0 | $131 | $0 | $307 | $0 | $0 | $0 | $0 | $187 | $0 | $0 | $0 |
| Browns Bank North | $10,994 | - | - | - | - | - | $32,901 | $12,765 | $9,338 | $9,255 | $3,569 | $11,796 | $12,437 | $7,432 | $12,316 | $26,657 | $13,559 | $11,960 | $14,811 | $5,153 | $0 | $2,270 | $17,051 | $8,845 | $15,976 | $15,784 | $18,086 |
| Browns Bank South | $20 | - | - | - | - | - | $0 | $0 | $0 | $1,832 | $5,229 | $3,148 | $1,232 | $1,120 | $1,197 | $2,452 | $487 | $186 | $8 | $0 | $0 | $0 | $0 | $0 | $5 | $0 | $0 |
| Eastern Scotian Shelf | $1,128 | - | - | - | - | - | $2,465 | $3,007 | $3,249 | $4,905 | $4,943 | $3,072 | $2,472 | $2,040 | $2,807 | $3,262 | $2,984 | $1,832 | $1,849 | $1,136 | $441 | $352 | $454 | $1,134 | $1,869 | $852 | $1,363 |
| Georges Bank A | $77,412 | - | - | - | - | - | $32,605 | $51,457 | $79,537 | $59,062 | $44,666 | $97,960 | $80,672 | $74,099 | $73,516 | $46,717 | $31,540 | $51,558 | $49,471 | $72,107 | $73,814 | $59,727 | $74,982 | $74,391 | $106,631 | $114,423 | $97,013 |
| Georges Bank B | $3,283 | - | - | - | - | - | $0 | $0 | $0 | $14,807 | $21,343 | $9,475 | $4,913 | $2,203 | $2,449 | $2,652 | $2,550 | $2,127 | $4,949 | $4,691 | $3,476 | $750 | $0 | $870 | $2,307 | $4,034 | $9,623 |
| German Bank | $3,791 | - | - | - | - | - | $6,557 | $1,563 | $1,868 | $5,571 | $10,653 | $9,449 | $7,457 | $9,128 | $4,903 | $5,328 | $2,531 | $7,886 | $7,404 | $5,167 | $2,668 | $1,913 | $2,091 | $2,827 | $3,074 | $2,886 | $1,992 |
| St. Pierre Bank | $7 | - | - | - | - | - | $1,118 | $309 | $56 | $0 | $0 | $65 | $0 | $0 | $0 | $3,333 | $3,391 | $69 | $0 | $0 | $0 | $0 | $0 | $0 | $0 | $0 | $0 |
| - | - | - | - | - | - | - | - | - | - | - | - | - | - | - | - | - | - | - | - | - | - | - | - | - | - | - | - |
| - | $96,683 | $54,691 | $63,220 | $82,738 | $109,481 | $118,622 | $75,646 | $69,102 | $94,047 | $96,376 | $93,044 | $137,280 | $110,297 | $96,079 | $97,188 | $90,401 | $57,174 | $75,617 | $78,798 | $88,254 | $80,399 | $65,012 | $94,577 | $88,253 | $129,862 | $137,980 | $128,077 |
| - | - | - | - | - | - | - | - | - | - | - | - | - | - | - | - | - | - | - | - | - | - | - | - | - | - | - | - |
| - | - | - | - | - | - | - | - | - | - | - | - | - | - | - | - | - | - | - | - | - | - | - | - | - | - | - | - |
| - | - | 1990 | 1991 | 1992 | 1993 | 1994 | 1995 | 1996 | 1997 | 1998 | 1999 | 2000 | 2001 | 2002 | 2003 | 2004 | 2005 | 2006 | 2007 | 2008 | 2009 | 2010 | 2011 | 2012 | 2013p | 2014p | 2015p |
| - | Landed Weight | 6,012 | 6,538 | 7,196 | 7,331 | 7,171 | 4,603 | 4,022 | 5,036 | 5,207 | 5,214 | 8,705 | 8,859 | 8,388 | 7,912 | 6,807 | 4,502 | 5,766 | 6,372 | 6,730 | 6,017 | 5,759 | 5,697 | 4,747 | 6,088 | 6,519 | 5,303 |
| - | Total landed value | $54,691 | $63,220 | $82,738 | $109,481 | $118,622 | $75,646 | $69,102 | $94,047 | $96,376 | $93,044 | $137,280 | $110,297 | $96,079 | $97,188 | $90,401 | $57,174 | $75,617 | $78,798 | $88,254 | $80,399 | $65,012 | $94,577 | $88,253 | $129,862 | $137,980 | $128,077 |
| - | - | - | - | - | - | - | - | - | - | - | - | - | - | - | - | - | - | - | - | - | - | - | - | - | - | - | - |
| - | 1998 | 1999 | 2000 | 2001 | 2002 | 2003 | 2004 | 2005 | 2006 | 2007 | 2008 | 2009 | 2010 | 2011 | 2012 | 2013p | 2014p | 2015p | - | - | - | - | - | - | - | - | - |
| Average Inshore Scallop price per Kilogram (meat weight) | $18.51 | $17.85 | $15.77 | $12.45 | $11.45 | $12.28 | $13.28 | $12.70 | $13.11 | $12.37 | $13.11 | $13.36 | $11.29 | $16.60 | $18.59 | $21.33 | $21.17 | $24.15 | - | - | - | - | - | - | - | - | - |
3.4. Landings and landed value by bank
The current fishery access structure began in 1998, with Georges Bank being divided into Georges Bank (A) and Georges Bank (B) for quota allocation purposes. Likewise, Browns Bank (North) and (South) were separated for quota purposes, as was Banquereau Bank and the Eastern Scotian Shelf.
In terms of both the aggregate and on average, Georges Bank (A) provided the majority of landings of offshore scallop and accounted for the majority of the fleet’s landed value. Appendix 7 provides detailed historical TAC, landings and landed value information for the offshore scallop fishery.
3.5. Canadian scallop exports
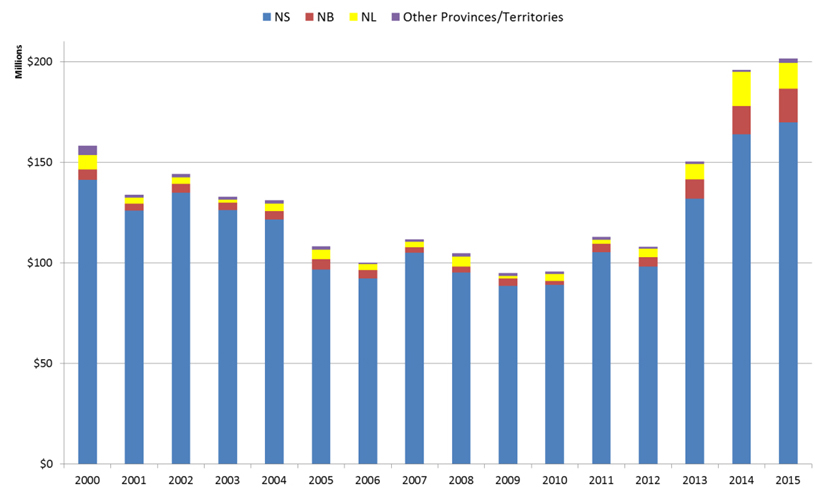
Canadian export value for scallop reached $201.7 million in 2015, the highest level for the 2000 to 2015 time series. Nova Scotia has consistently been the main provincial exporter of scallop, accounting for 84.2 percent of Canadian scallop exports by value in 2015 and 90.2 percent on average over the last decade. The export value of scallop from Nova Scotia in 2015 was $169.8 million, up substantially from $88.9 million in 2010. Note that scallop export data includes landings by the both inshore and offshore fleets, as well as other sources of supply.
Scallop exports from New Brunswick were worth $16.9 million in 2015, a substantial increase from the decadal low of $2.1 million in 2010. On average, New Brunswick scallop exports accounted for 4.6 percent of the Canadian scallop export value over the last decade, with this figure rising to 8.4 percent in 2015.
Scallop exports from Newfoundland and Labrador increased substantially in recent years, rising from a decadal low of $1.4 million in 2009 up to $17.0 million in 2014 and $12.8 million in 2015.
Figure 7 shows Canadian scallop export value by province from 2000 to 2015.
Figure 7: Canadian scallop export value by province, 2000-2015
Data source: DFO economic analysis and statistics
Description
Figure 7: Canadian scallop export value by province, 2000-2015
| - | 2000 | 2001 | 2002 | 2003 | 2004 | 2005 | 2006 | 2007 | 2008 | 2009 | 2010 | 2011 | 2012 | 2013 | 2014 | 2015 |
|---|---|---|---|---|---|---|---|---|---|---|---|---|---|---|---|---|
| NS | $141,353,462 | $125,874,494 | $134,755,530 | $126,297,833 | $121,510,883 | $96,571,106 | $92,198,070 | $105,094,035 | $95,141,820 | $88,433,770 | $88,923,662 | $105,259,658 | $98,194,658 | $132,018,972 | $163,987,709 | $169,771,841 |
| NB | $4,978,814 | $3,638,676 | $4,597,290 | $3,569,423 | $4,251,361 | $5,259,322 | $4,192,782 | $2,585,453 | $2,902,890 | $3,695,347 | $2,113,814 | $4,251,691 | $4,672,099 | $9,515,735 | $14,023,834 | $16,893,857 |
| NL | $7,338,398 | $2,894,604 | $3,237,335 | $1,642,699 | $3,668,008 | $4,730,877 | $2,940,729 | $2,799,639 | $4,976,489 | $1,405,011 | $3,417,062 | $1,845,348 | $4,209,755 | $7,606,757 | $17,000,879 | $12,847,460 |
| Other Provinces/Territories | $4,599,013 | $1,549,656 | $1,594,577 | $1,342,429 | $1,736,898 | $1,614,597 | $681,465 | $1,130,975 | $1,870,817 | $1,535,737 | $1,269,271 | $1,601,374 | $965,207 | $1,126,858 | $963,891 | $2,171,859 |
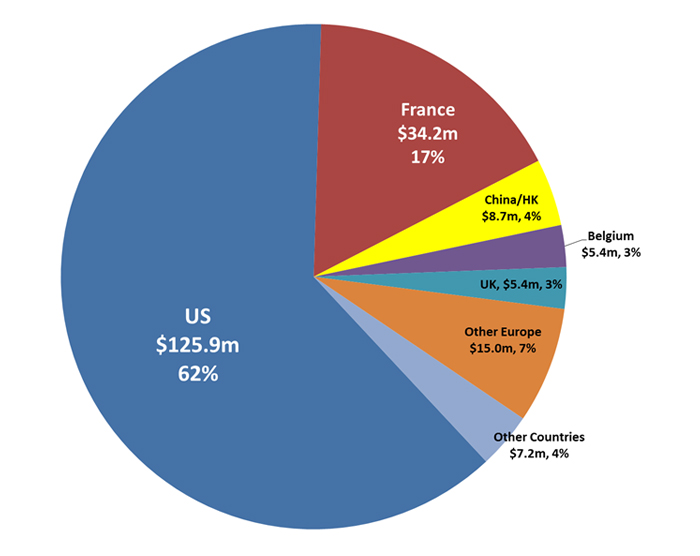
In 2015, the US represented approximately two-thirds of the export market for Canadian scallop by value at $125.9 million. The next most important scallop market for Canadian exporters was France, with $34.2 million or 17 percent of the total value. Other European countries accounted for 7 percent of Canadian scallop export value in 2015, with Belgium and the United Kingdom being the most important European markets. With respect to Canadian exports of scallop to Asia, China and Hong Kong were the most important Asian markets in 2015 with $8.7 million or 4 percent of export value.
Figure 8 shows Canadian scallop export value by major market destination for 2015.
Figure 8: Canadian scallop exports by major market, 2015
Data source: DFO economic analysis and statistics
Description
Figure 8: Canadian scallop exports by major market, 2015
| - | 2000 | 2001 | 2002 | 2003 | 2004 | 2005 | 2006 | 2007 | 2008 | 2009 | 2010 | 2011 | 2012 | 2013 | 2014 | 2015 |
|---|---|---|---|---|---|---|---|---|---|---|---|---|---|---|---|---|
| US | $142,077,394 | $96,078,002 | $107,552,682 | $89,142,242 | $88,724,598 | $72,546,866 | $67,545,913 | $71,101,792 | $64,021,774 | $49,369,286 | $53,726,165 | $66,699,169 | $63,461,647 | $99,463,598 | $127,497,618 | $125,878,456 |
| France | $9,196,833 | $26,503,954 | $27,237,351 | $36,161,541 | $30,666,678 | $25,199,057 | $24,713,571 | $25,398,520 | $29,003,352 | $24,740,108 | $21,050,732 | $21,718,061 | $21,605,139 | $24,122,665 | $35,959,620 | $34,172,117 |
| China/HK | $2,050,290 | $815,845 | $1,623,523 | $1,569,089 | $3,267,775 | $1,788,128 | $1,516,165 | $2,199,817 | $1,775,899 | $1,841,962 | $2,334,292 | $5,830,366 | $3,660,585 | $5,075,918 | $5,871,663 | $8,674,593 |
| Belgium | $0 | $46,840 | $968,764 | $719,157 | $596,547 | $2,142,120 | $730,315 | $1,216,897 | $1,497,434 | $996,305 | $3,598,641 | $4,377,769 | $5,580,934 | $4,761,091 | $1,168,786 | $5,403,164 |
| UK | $1,537,988 | $4,403,209 | $1,466,476 | $1,438,595 | $1,917,633 | $956,389 | $1,251,489 | $4,826,919 | $2,882,283 | $12,608,636 | $7,950,911 | $3,134,920 | $1,619,365 | $3,309,632 | $6,559,566 | $5,353,928 |
| Other Europe | $1,613,730 | $3,759,656 | $1,647,702 | $2,681,406 | $3,524,106 | $3,441,664 | $2,694,445 | $4,343,596 | $2,851,101 | $3,011,937 | $4,570,780 | $7,822,848 | $8,332,578 | $9,911,918 | $13,059,470 | $14,999,165 |
| Other countries | $1,793,452 | $2,349,924 | $3,688,234 | $1,140,354 | $2,469,813 | $2,101,678 | $1,561,148 | $2,522,561 | $2,860,173 | $2,501,631 | $2,492,288 | $3,374,938 | $3,781,471 | $3,623,500 | $5,859,590 | $7,203,594 |
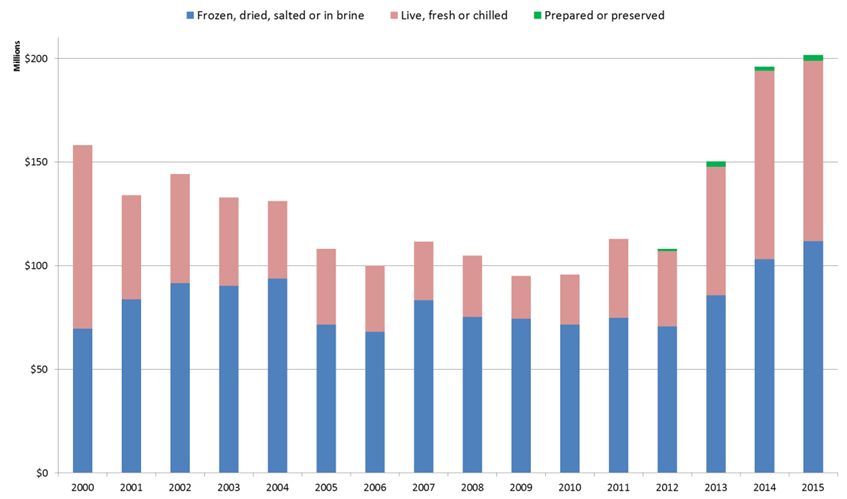
Over much of the last decade, the Canadian export of scallop by product form has averaged roughly a 70-30 split between ‘frozen’ (that is, ‘frozen, dried, salted or in brine’) and ‘fresh’ (that is, ‘live, fresh, or chilled’). In 2015, the percentage of scallop value exported as ‘fresh’ was 43.1 percent of the Canadian total, with ‘frozen’ product declining to 55.5 percent. Since 2012, ‘prepared or preserved’ scallop product forms averaged 1.2 percent of Canadian scallop export value.
Figure 9 shows Canadian scallop export value by product form from 2000 to 2015.
Figure 9: Canadian scallop export value by product form, 2000-2015
Data source: DFO economic analysis and statistics
Description
Figure 9: Canadian scallop export value by product form, 2000-2015
| - | 2000 | 2001 | 2002 | 2003 | 2004 | 2005 | 2006 | 2007 | 2008 | 2009 | 2010 | 2011 | 2012 | 2013 | 2014 | 2015 |
|---|---|---|---|---|---|---|---|---|---|---|---|---|---|---|---|---|
| Frozen, dried, salted or in brine | $69,521,975 | $83,824,119 | $91,578,081 | $90,197,628 | $93,762,656 | $71,637,206 | $68,108,875 | $83,236,319 | $75,292,164 | $74,412,844 | $71,658,103 | $74,898,467 | $70,611,063 | $85,743,340 | $103,206,099 | $111,842,022 |
| Prepared or preserved | - | - | - | - | - | - | - | - | - | - | - | - | $966,524 | $2,594,266 | $1,848,287 | $2,863,624 |
| Live, fresh or chilled | $88,747,712 | $50,133,311 | $52,606,651 | $42,654,756 | $37,404,494 | $36,538,696 | $31,904,171 | $28,373,783 | $29,599,852 | $20,657,021 | $24,065,706 | $38,059,604 | $36,464,132 | $61,930,716 | $90,921,927 | $86,979,371 |
| Grand Total | $158,269,687 | $133,957,430 | $144,184,732 | $132,852,384 | $131,167,150 | $108,175,902 | $100,013,046 | $111,610,102 | $104,892,016 | $95,069,865 | $95,723,809 | $112,958,071 | $108,041,719 | $150,268,322 | $195,976,313 | $201,685,017 |
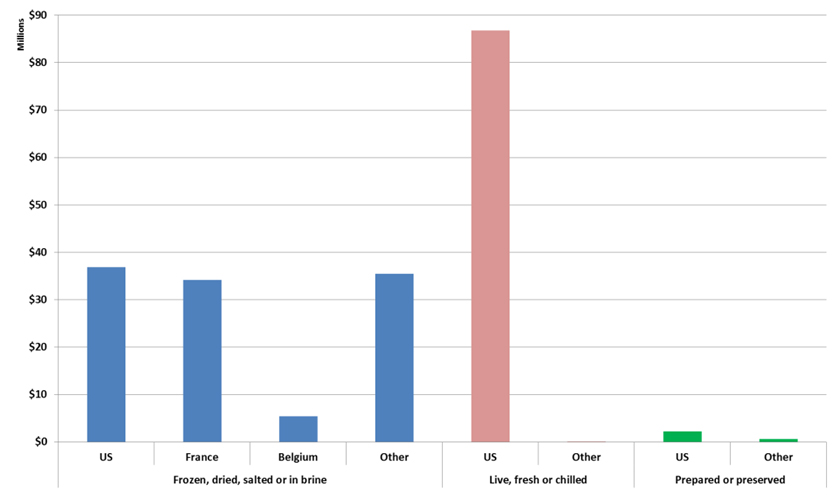
In 2015, the US is the main market for both the ‘fresh’ and ‘prepared or preserved’ scallop product forms, accounting for almost all of the export value for these categories. For the ‘frozen’ category, the US is the main market, accounting for $36.8 million in export value (or 32.9 percent) while France accounted for $34.2 million (or 30.1 percent).
Figure 10 shows further detail on Canadian scallop export value by product form and market destination.
Figure 10: Canadian scallop export value by product form and major market, 2015
Data source: DFO economic analysis and statistics
Description
Figure 10: Canadian scallop export value by product form and major market, 2015
| - | - | 2000 | 2001 | 2002 | 2003 | 2004 | 2005 | 2006 | 2007 | 2008 | 2009 | 2010 | 2011 | 2012 | 2013 | 2014 | 2015 |
|---|---|---|---|---|---|---|---|---|---|---|---|---|---|---|---|---|---|
| Frozen, dried, salted or in brine | US | $53,453,798 | $46,695,414 | $55,452,128 | $46,828,329 | $51,559,672 | $36,659,806 | $35,790,783 | $43,004,688 | $34,881,467 | $28,751,713 | $30,234,181 | $30,235,714 | $26,123,821 | $34,954,599 | $35,151,721 | $36,827,170 |
| - | France | $9,107,852 | $26,293,340 | $26,991,688 | $36,061,862 | $30,507,342 | $24,925,358 | $24,615,509 | $25,188,120 | $28,925,352 | $24,740,108 | $21,050,732 | $21,430,655 | $21,604,689 | $24,122,092 | $35,958,932 | $34,171,402 |
| - | Belgium | $0 | $46,840 | $968,764 | $719,157 | $596,547 | $2,142,120 | $730,315 | $1,216,897 | $1,497,434 | $996,305 | $3,598,641 | $4,377,769 | $5,580,934 | $4,761,091 | $1,168,786 | $5,403,164 |
| - | Other | $6,960,325 | $10,788,525 | $8,165,501 | $6,588,280 | $11,099,095 | $7,909,922 | $6,972,268 | $13,826,614 | $9,987,911 | $19,924,718 | $16,774,549 | $18,854,329 | $17,301,619 | $21,905,558 | $30,926,660 | $35,440,286 |
| Live, fresh or chilled | US | $88,623,596 | $49,382,588 | $52,100,554 | $42,313,913 | $37,164,926 | $35,887,060 | $31,755,130 | $28,097,104 | $29,140,307 | $20,617,573 | $23,491,984 | $36,463,455 | $36,377,067 | $61,922,575 | $90,655,254 | $86,808,672 |
| - | Other | $124,116 | $750,723 | $506,097 | $340,843 | $239,568 | $651,636 | $149,041 | $276,679 | $459,545 | $39,448 | $573,722 | $1,596,149 | $87,065 | $8,141 | $266,673 | $170,699 |
| Prepared or preserved | US | $0 | $0 | $0 | $0 | $0 | $0 | $0 | $0 | $0 | $0 | $0 | $0 | $960,759 | $2,586,424 | $1,690,643 | $2,242,614 |
| - | Other | $0 | $0 | $0 | $0 | $0 | $0 | $0 | $0 | $0 | $0 | $0 | $0 | $5,765 | $7,842 | $157,644 | $621,010 |
4. Management issues
The cornerstone for management of the offshore scallop fishery is the Enterprise Allocation Program in the Canadian Offshore Scallop Fishery (EA program) developed by the industry and approved by DFO in 1989. Changes to the EA program require the consensus of OSAC or, in the absence of a consensus, a review can be triggered with the provision of five (5) years notice. Three main objectives were set out in the EA program:
- ensure conservation and restoration of the resource;
- to the degree possible, stabilize annual landings over time; and
- provide increased economic benefits for fish harvesters, vessel owners, shore workers and the people of Canada.
In 1997 a DFO internal review of the EA program concluded that all of these objectives had been met or exceeded.
4.1. Fisheries issues
Conflicts
- In 1993 when the first TAC was set for German Bank potential gear conflict between the offshore scallop fleet and the inshore lobster fleet was averted by a decision of the scallop licence holders not to fish there during the open lobster season.
- Whelk and sea cucumbers have similar habitat preferences to scallops. These fisheries occur in both the Maritimes and Newfoundland and Labrador regions and previous effort has disrupted the offshore scallop fleet. If fishing effort expands into traditional scallop areas there is a potential for gear conflict. The offshore scallop fleet will attempt to collaborate to mitigate any conflict.
At-sea observer monitoring
- Rules for at-sea observer coverage have been developed to include:
- 2 trips per month on Georges Bank (A);
- 1 trip per year on all other banks where fishing occurs; and
- full coverage when fishing 2 banks during the same fishing trip.
At-sea observer coverage provides important information on catch and bycatch therefore monitoring of fishing trips to ensure coverage levels are maintained must be a priority. However, observer coverage on a fishing trip which includes two banks cannot be used to replace other coverage requirements. In addition, with a limited number of fishing trips to the smaller banks, in conjunction with random sampling coverage, it is possible that these banks will not have coverage every year.
Bycatch
At-sea observer coverage provides information on directed and bycatch species including SARA and COSEWIC listed species. Due to the variability across fishing trips (number of observed hauls/trip, different length of hauls, time of year, area, etc.) observer data should be considered carefully. Levels of at-sea observer coverage must be considered when extrapolating bycatch data to geographical or temporal values for the full fleet.
Observer coverage in the offshore scallop fishery was exclusive to Georges Bank until 2011, after which the other banks have had limited coverage. However, Georges Bank is still the primary fishing bank. The fleet had an average of 14.4% coverage on Georges Bank between 2011 and 2016 based on the observed effort (hour meter towed) and the total bank effort.
In a final report prepared for MSC, Caddy et. al. (2010) provided a summary of a preliminary analysis of scallop dredge bycatch by the Offshore Scallop fishery which indicated that 94% (by weight) of the total weight of organisms captured was scallops, 5.4% was fish bycatch and 0.6% was all other invertebrate taxa. This report also provided the 14 most common finfish bycatch species and listed the 9 most common invertebrates, both in decreasing order.
Reviews of observer data for MSC were presented by Ginette Robert for skate, monkfish, wolffish and invertebrates. The review of skate (all species combined) and monkfish bycatch data indicated that little information is available for banks other than Georges Bank (a total of 7 observed trips on Sable/Western, Browns Bank (North), and German Banks from 2011 to 2013). The review of data from 2004 to 2013 on Georges Bank (A and B combined) indicated a range of cumulative annual discards of skate from 529t in 2013 to 2073t in 2010. The cumulative annual discards of monkfish ranges from 0t (2004 to 2010) to 222t in 2012. The review of wolffish bycatch (4 species) was provided for Georges Bank (A) for 2011 to 2013 as a percentage of the scallop landed per observed trip (round weights). These percentages were very low (all less than 0.023%). The review of invertebrate bycatch for Georges Bank (A) and (B) (2013 only) provided the cumulative annual discards for the most abundant groups along with the percentage of the discards when compared to the scallop catch. The invertebrate bycatch was dominated by starfish, followed by crab and sea urchin, respectively. The percentages of invertebrate bycatch when compared to the scallop catch were well below the critical 5% level for all groups with the highest being starfish at 0.3%.
These reviews support the conclusions that:
- the new Bedford scallop rake/dredge is highly selective for scallops; and
- the overall bycatch in the offshore scallop fishery remains under 5%; and
- industry changes in effort have helped reduce the impact on the ecosystem.
Except for monkfish, no retention of bycatch is permitted in the offshore scallop fishery.
4.2. Depleted species concerns
A number of Canada’s marine wildlife species are considered to be at risk. Ensuring protection and promoting recovery of at-risk species is a national priority. To this end, Canada developed the Species at Risk Act (SARA) and a number of complementary programs to promote recovery and protection of species considered to be extirpated, endangered, threatened or of special concern under SARA or identified as such by the Committee on the Status of Endangered Wildlife in Canada (COSEWIC).
The recovery of species at risk SARA includes prohibitions that protect endangered, threatened, and extirpated species (Section 32), their residences (Section 33), and their critical habitat (Section 58). Provided specific criteria can be met, SARA allows activities that would otherwise be prohibited to proceed through the issuance of permits or agreements under Section 73 and 74, or through exemptions under Section 83(4). The recovery of species at risk involves the development and implementation of recovery strategies, action plans or management plans, and the protection of any critical habitat that has been identified as necessary for the survival or recovery of the species. For species listed as special concern, critical habitat is not identified and the section 32 prohibitions do not apply.
Once assessed by COSEWIC if a decision is made not to list a species under SARA, DFO is required to develop an “alternative approach” to species conservation using other legislative or non-legislative tools. If the “alternative approach” includes incremental actions, a 5-year workplan must be developed as per the Species at Risk Act Listing Policy and Directive for Do Not List Advice.
Further information on SARA.
Should additional species be listed under SARA this IFMP recognizes there will be a need to address potential impacts to these new species. Industry will be consulted as required to develop any necessary strategies to mitigate these impacts.
Bycatch observed in the offshore scallop fishery of depleted species is limited to three (3) SARA listed species (Table 3) and ten (10) COSEWIC assessed species (Table 4).| Species | SFA | SARA Status |
|---|---|---|
| Atlantic wolffish (Anarhichas lupus) |
10, 11, 12, 25, 26 and 27 | Special Concern |
| Spotted wolffish (Anarhichas minor) |
10, 11, 12, 25, 26 and 27 | Threatened |
| Northern wolffish (Anarhichas denticulatus) |
10, 11, 12, 25, 26 and 27 | Threatened |
The offshore scallop fishery is a licensed activity under the Fisheries Act. It is managed under a formal management plan with no retention of wolffish (any species). The Allowable Harm Assessment report for wolffish (DFO, 2004) concluded that the levels of mortality associated with the offshore scallop fishery do not impair the ability of the species to recover. A recent review of wolffish populations concluded that the decline in wolffish abundance has not continued, and has reversed in many areas, which suggests that the current harm is sustainable assuming that future stock productivity is similar to that observed in recent time periods (DFO, 2015c).
| Species | 2011-2016 % of observed bycatch | SFA/Designated Unit | COSEWIC Status |
|---|---|---|---|
| Atlantic cod (Gadus morhua) |
1.40% | 10, 11, 12, 25, 26 and 27 / Southern | Endangered |
| American eel (Anguilla anguilla) |
0.00% | 10, 11, 12, 25, 26 and 27 / Atlantic | Threatened |
| American plaice (Hippoglossoides platessoides) |
0.46% | 10, 11, 12, 25, 26 and 27 / Maritime | Threatened |
| Cusk (Brosme brosme) |
0.01% | 10, 11, 12, 25, 26 and 27 / Atlantic | Endangered |
| Redfish (Sebastes mentella) |
0.00% | 10, 11, 12, 25, 26 and 27 / Atlantic | Endangered |
| Smooth skate (Malacoraja senta) |
0.27% | 10, 11, 12, 25, 26 and 27 / Scotian | Special Concern |
| Spiny dogfish (Squalus acanthias) |
0.37% | 10, 11, 12, 25, 26 and 27 / Atlantic | Special Concern |
| Thorny skate (Amblyraja radiate) |
2.29% | 10, 11, 12, 25, 26 and 27 / Atlantic | Special Concern |
| White hake (Urophycis tenuis) |
0.28% | 10, 11, 12, 25, 26 and 27 / Atlantic | Threatened |
| Winter skate (Leucoraja ocellata) |
0.73% | 25 / Eastern Scotian Shelf | Endangered |
Based on the 2011-2016 review of observed bycatch by weight, the ten COSEWIC assessed species within their designated unit only made up a combined 5.81% of the total observed bycatch in the offshore scallop fishery with Atlantic cod (1.4%) and Thorny Skate (2.29%) accounting for over half of the bycatch. Based on the observed data the catch rate for Atlantic cod was 0.115 kg/hour meter (hm) dredged while thorny skate was 0.431 kg/hm dredged. As a transboundary species the Atlantic cod catches on Georges Bank are accounted for from the TAC.
4.3. Oceans and habitat considerations
Oceans and habitat concerns include protecting depleted, rare or unique species and their habitats, conserving areas of natural biological diversity, high productivity and critical/essential habitat, avoiding ecosystem alteration, degradation and habitat fragmentation, and avoiding interruption of migration routes. Addressing the objective to conserve habitat integrity is important to avoid serious or irreversible harm to habitat from human use. The introduction and spread of invasive species and environmental changes related to climate change are also important considerations.
Scientific information and Aboriginal and community traditional knowledge can be used to identify areas or habitats of importance for a stock’s life-history or that are vulnerable to impacts from fishing activities. Once areas or habitats are identified, potential threats need to be assessed and those that are likely to cause serious or irreversible harm need to be managed or mitigated to the extent possible.
Management measures could include adopting technologies that reduce the frequency or magnitude of the disturbances, (e.g., industry acquisition of multi-beam mapping and backscatter data for seabed habitat characterizations, mapping scallop fishery footprints in relation to sensitive species and habitat distribution modelling; or promotion of industry codes of best practice).
The Government of Canada achieved the protection of 5% of Canada’s marine and coastal areas in 2017 and is committed to protecting 10% by 2020. The 2020 target is both a domestic target (Canada’s biodiversity target 1) and an international target as reflected in the Convention on Biological Diversity’s Aichi Target 11 and the United Nations General Assembly’s 2030 Agenda for Sustainable Development under Goal 14. The 2017 and 2020 targets are collectively referred to as Canada’s marine conservation targets. More information on the background and drivers for Canada’s marine conservation targets.
To meet these targets, Canada is establishing Marine Protected Areas (MPAs) and “other effective area-based conservation measures” (“Other Measures”), in consultation with industry, non-governmental organizations, and other interested parties. An overview of these tools, including a description of the role of fisheries management measures that qualify as Other Measures.
Specific management measures established for the offshore scallop fishery have been identified to contribute to Canada’s marine conservation targets. The following closures contribute to these targets:
- The Gully marine protected area
- St. Anns Bank marine protected area
- Northeast Channel coral conservation area
- Jordan basin conservation area
- Corsair and Georges canyons conservation area
- Western/Emerald Banks conservation area
- Eastern Canyons Conservation Area
- Emerald Basin and Sambro Bank sponge conservation area
More information on these management measures and their conservation objectives is provided below and in Section 6.3 of this IFMP.
The 1997 Oceans Act is the enabling legislation for ocean management and the establishment of MPAs is a specific regulatory tool that may be used to protect important sensitive or representative marine communities and assemblages. MPAs are marine zones that are given enhanced protection under Oceans Act regulations. The regulations impose restrictions or special requirements on activities conducted in specific area, and certain activities may be prohibited in all or part of an MPA.
Gully Marine protected area
In addition to the protected Sensitive Benthic Areas in the Region, the Gully Marine Protected Area (MPA) is located near Sable Island, Nova Scotia (within SFA 25) and protects the largest underwater canyon in eastern North America. The Gully is home to a diversity of marine habitat and species, including corals and Northern bottlenose whales, which are listed as an endangered species under the Species at Risk Act. The Gully MPA is closed to scallop drags and other bottom-contact fishing gear.
St. Anns Bank marine protected area
A new MPA was announced in 2017. The St. Anns Bank MPA is be located east of Cape Breton (within SFA 25) and is approximately 4,363 square kilometres encompassing most of St. Anns Bank, Scatarie Bank, and a portion of the Laurentian Slope and Channel. This area has a variety of habitat types and a high diversity of fish species. It is an important habitat for species at risk (e.g., Atlantic wolffish), depleted species (e.g., Atlantic cod), and several commercial species that are at low biomass levels (American plaice, white hake, redfish, witch flounder) and contains sensitive ocean bottom habitats and species, such as corals and sponges. In addition, it is a summer foraging area for the endangered leatherback turtle and a migration corridor for many fishes and marine mammals. Selected commercial fishing may be permitted, but will be limited to specific zones of the MPA. Fishing for scallops with dredge gear is restricted from the MPA boundary.
4.4. Benthic impacts
The offshore scallop fishery is conducted using scallop drags. Reviews of the general impacts of bottom‑contact fishing gears have established that scallop drags disturb benthic habitats, populations and communities (DFO, 2006). The extent and severity of the disturbance depend on a number of factors, including the specific features of the seafloor habitats where the fishing occurs, the species that are present there, the nature, frequency and extent of the fishing activity, and the extent to which the benthic area is disturbed naturally by currents and waves.
Scallop dredging occurs mainly on gravel beds and is known to cause considerable disturbance to this substrate. This disturbance can be readily seen in sidescan sonograms, but no directed studies of the level of immediate impact and recovery have been conducted in Atlantic Canada. Therefore, at this point in time only general assumptions can be made about potential impacts based on studies elsewhere. Gravel sea beds support a relatively high volume of structure‑forming epifauna, which tend to be vulnerable to disturbance by scallop drags. At the same time, these sea beds are high‑energy, naturally disturbed sites, which would reduce the significance of any disturbance by the gear.
In addition, the Canadian offshore scallop fishery has been using drags since its inception over 65 years ago. Therefore the habitat in areas where the fishery has occurred might be different, and less sensitive to dredge disturbance, to that existing before the fishery began. While the current healthy state of scallop populations might suggest that disturbance by dredges is not having unacceptable impacts on habitat, this might not be true for other species sharing the same habitat. Any damage to larger structures that may have existed on the grounds is likely already to have occurred, suggesting that current levels of disturbance are relatively minor for areas where rotational fishery activity has not been practiced.
It is worth noting that there is currently no alternative to the scallop drag for fishing at sea and at the depths where the offshore scallop fleet operates.
Steps are being taken to minimize the annual footprint of the dredging disturbance. Industry is also identifying sensitive seed areas which are not fished until scallops have matured.
The offshore scallop fleet has taken steps to significantly reduce its footprint on the ocean floor:
- The size of the offshore scallop fleet has decreased from over 60 active vessels in 1986 to just 17 active vessels in 2009 and 12 vessels by 2016.
- Bottom mapping started in the mid-1990s and has been completed on three major offshore scallop fishing areas, including Georges Bank (which accounts, on average, for about 75-80% of the offshore scallop landings). As a result, the fleet now harvests the resource far more efficiently than it did in the past. To put this in perspective, in 1986 there were 100,000 hours of towing on Georges Bank alone and recent effort approximates 20,000 hours.
This combination of fishing patterns and effort reduction likely contributes to reducing the fleet’s impact on the benthic ecosystem.
4.5. Lost gear
Lost fishing gear is not considered to be an issue in the offshore scallop fishery. Occasionally an offshore scallop drag is lost, but this has become less frequent with the advent of bottom mapping. In addition, there is a financial incentive for scallop harvesters to be careful with their gear. Offshore scallop drags are expensive to replace. And there is a cost to returning to shore to get another one or a cost to fishing for the remainder of a trip with only half the catching capacity. All offshore scallop vessels carry a device commonly known as a “Christmas tree,” which is used to grapple for lost rakes. Given the accuracy of GPS and the effectiveness of the Christmas tree, it would be a rare occasion when the gear was not retrieved. In any case, lost scallop drags do not contribute to “ghost” fishing, since they would not be expected to attract or retain species effectively.
4.6. International issues
The following summarizes important initiatives of an international nature which have application to the offshore scallop fishery.
4.6.1. Transboundary bycatch
The United States-Canada Transboundary Resource Sharing Understanding (2003) applies to certain important transboundary stocks on Georges Bank, namely, yellowtail flounder, cod and haddock. TACs for these three species are established annually and divided between the two countries using predetermined formulas. Further details are available at the Transboundary Management Guidance Committee (TMGC) website.
All mortalities of these three species (directed fishing and discards) must be accounted for against each country’s share of the established TACs. Canada has set aside certain reserves from its share of the TACs to cover bycatch on Georges Bank. The reserves are 30% for yellowtail flounder, 12% for cod and 1.03% for haddock from Canada’s portion. These amounts are utilized by both the offshore scallop and groundfish fleets on Georges Bank. All offshore scallop fishery bycatch estimates are counted against the reserves. For cod and haddock, estimated surplus of the offshore scallop fishery reserves may be allocated to the directed groundfish fleet mid-season. Mortality of discards of these by-batch species in the offshore scallop fishery is expected to be 100% and is calculated for the entire fleet based on observed coverage (2 trips per month).
Bycatch of yellowtail, cod and haddock in the scallop fishery on Georges Bank are extrapolated for the entire offshore scallop fleet from at-sea observed trips. Since 2005 there has been a reduction in estimated bycatch amounts (mt) (Table 5). This may indicate the industry’s ability to reduce bycatch using avoidance protocols and gear modifications (i.e., ring sizes and rope backs). However, total bycatch may also be affected by decreased effort, changes in the scallop TAC or by the abundance of the bycatch species.
| Discards | Yellowtail | Cod | Haddock |
|---|---|---|---|
| 2005 | 246 | 84 | 48 |
| 2006 | 504 | 112 | 62 |
| 2007 | 96 | 114 | 56 |
| 2008 | 117 | 36 | 33 |
| 2009 | 84 | 69 | 54 |
| 2010 | 210 | 46 | 15 |
| 2011 | 43 | 30 | 16 |
| 2012 | 48 | 44 | 30 |
| 2013 | 39 | 18 | 10 |
| 2014 | 14 | 15 | 17 |
| 2015 | 11 | 13 | 25 |
4.6.2. Marketing
Effective January 2010, the European Union (EU) has introduced regulations that require fish and seafood products to have a government validated catch certificate confirming the product is not from an illegal, unreported and unregulated fishery. A Catch Certification Office (CCO) has been created by DFO to provide client services to the fishing industry affected by the new EU regulation. The services are offered through a web-based system (Fisheries Certificate System) that accepts applications from industry for validation from CCO and audit and verification by Conservation & Protection.
Further information can be found on the following DFO website.
4.6.3. International boundaries
After the international boundary in the Gulf of Maine was established by the ICJ in 1984, there were regular incursions across the boundary by scallop fishing vessels, predominantly US vessels crossing into Canadian waters. During the next decade there were a number of vessel seizures, forfeitures and high-seas chases. Ultimately, agencies from both countries implemented an enforcement agreement which led to legislation amendments in both countries. Those amendments now permit each country to charge their own licence holders for illegally fishing in the other country’s waters.
A “Procès-verbal” was developed between Canada and the Republic of France in 1994, which applies to certain waters of NAFO subdivision 3Ps that lie between Newfoundland and Labrador (NL) and the French islands of St. Pierre and Miquelon and designated as the “core area”. The core area consists of waters belonging to each country where there was mutual interest in managing certain common fisheries resources. Under this arrangement the Iceland scallop resource was to be shared between the inshore scallop fleet of NL and the French fleet. As result, the offshore scallop fleet is precluded from fishing in French waters in the core area and, when operating in Canadian waters in the core area, must release all Iceland scallops.
4.6.4. Certification – ecolabelling
The Marine Stewardship Council (MSC) is an international non-profit organization established to promote sustainable fisheries. The MSC runs the most widely recognized environmental certification and eco-labeling program for wild capture fisheries. MSC certified fish products come from fisheries that meet environmental standards for sustainable fishing and are marked with an Eco label to show they come from a certified sustainable source. More information on the MSC is available on-line.
On March 22, 2010, the Eastern Canada offshore scallop fishery received eco-certification under the MSC Principles and Criteria for Sustainable Fishing. The fishery was recertified on June 30, 2015. This was the first scallop fishery in North America to receive MSC eco-certification. The conditions, their related performance indicators and scoring indicators are provided in the original assessment report.
5. Objectives
There are five overarching objectives that guide fisheries management planning in the Maritimes Region. They are guided by the principle that the fishery is a common property resource to be managed for the benefit of all Canadians, consistent with conservation objectives, the constitutional protection afforded Aboriginal and treaty rights, and the relative contributions that various uses of the resource make to Canadian society, including socio-economic benefits to communities.
Conservation objectives
- Productivity: Do not cause unacceptable reduction in productivity so that components can play their role in the functioning of the ecosystem.
- Biodiversity: Do not cause unacceptable reduction in biodiversity in order to preserve the structure and natural resilience of the ecosystem.
- Habitat: Do not cause unacceptable modification to habitat in order to safeguard both physical and chemical properties of the ecosystem.
Social, cultural and economic objectives
- Culture and sustenance: Respect Aboriginal and treaty rights to fish.
- Prosperity: Help create the circumstances for economically prosperous fisheries.
The conservation objectives are those from the Maritimes Region’s framework for an ecosystem approach to management (EAM Framework). They require consideration of the impact of the fishery not only on the target species but also on non-target species and habitat. (See Appendix 1 for a summary of the regional EAM Framework.)
The social, cultural and economic objectives recognize the economic contribution that the fishing industry makes to Canadian businesses and many coastal communities. Ultimately, the economic viability of fisheries depends on the industry itself. However, the Department is committed to managing the fisheries in a manner that helps its members be economically successful while using the ocean’s resources in an environmentally sustainable manner.
The overarching social, cultural and economic objective is thus to help create the circumstances for economically prosperous fisheries wherein fishing enterprises are more self-reliant, self-adjusting and internationally competitive.
For the purposes of sustainability certification, these five objectives are considered by DFO to be the long term objectives for the fishery.
6. Strategies and tactics
This section of the IFMP presents the strategies and tactics being used in this fishery to achieve the objectives listed in Section 5. For a general description of strategies and tactics in the context of the regional EAM Framework, see Appendix 1.
Reference points
Reference points are to be used in conjunction with the precautionary approach as identified in Section 2.5. The offshore scallop industry developed a Lower (Limit) Reference Point (LRP), Upper Stock Reference (USR), and a target removal exploitation rate for the scallop fishery on Georges Bank (A) to meet requirements for Marine Stewardship Council certification. These reference points are based on 30% and 80% of the mean biomass the stock assessment population model from 1986-2009 as a proxy for BMSY. The Lower Reference Point (LRP) is 7,137 t and the Upper Stock Reference (USR) is 13,284 t.
The following reference points have been proposed for the Browns Bank fishery but have not yet been adopted:
Approach - mean commercial size biomass (1991 to 2010) from the delay-difference model as BMSY proxy
LRP - 30% of BMSY proxy
USR -80% of BMSY proxy
Removal Reference (RR) –the maximum acceptable removal rate for the stock.
| Strategies | Tactics |
|---|---|
| Productivity | |
Keep fishing mortality of scallops moderate. Apply the Harvest Control Rules (HCR) (Section 2.5) to Georges Bank (A). These rules will promote the maintenance of the biomass in the healthy zone and promote rebuilding when outside the healthy zone.
------------------------------------------------
Keep fishing mortality of scallops moderate for all areas without stock limit points by: |
------------------------------------------------
|
| Biodiversity | |
| Keep fishing mortality of monkfish moderate and within historic levels for the fleets |
|
| Control unintended incidental mortality for all bycatch species |
|
| Control unintended incidental mortality for spotted wolffish, Northern Wolffish and skate species. |
|
| Habitat | |
| Do not cause unacceptable modification to habitat |
|
| Limit introduction of pollutants |
|
| Minimize introduction of debris |
|
| Prosperity | |
| Limit inflexibility in policy & licensing among individual enterprises/licence holders |
|
| Minimize instability in access to resources and allocations |
|
| Limit inability for self-adjustment to overcapacity relative to resource availability |
|
| Support certification for sustainability |
|
For the purposes of sustainability certification the strategies outlined in the table are considered by DFO to be the short term objectives for the fishery.
The potential impact of climate change on these strategies cannot be categorized at this time and will not be covered here. However, this IFMP will be applied in a manner that is adaptive and responsive to change (planned and unforeseen) so that the objectives and strategies are respected.
6.1. Productivity
Starting in 2010, formal science advice has been provided annually for all offshore SFAs (excluding St. Pierre Bank where science responsibility rests with the Newfoundland and Labrador Region and is conducted on a multi-year cycle). The provision of formal science advice for each SFA will help ensure that the scallop resources remain sustainable.
The scallop fishery uses TACs and quotas to help keep fishing mortality moderate. The target exploitation rate of 0.25 for Georges Bank (A) when the stock is in the Health Zone is expected to maintain a stable population biomass.
It is now common place for industry to manage closures designed to protect known concentrations of juvenile scallops until they reach commercial size.
There should be sufficient escapement of small scallops from the gear and undersized and juvenile scallops caught in the drags are returned to the water as soon as possible. This escapement from exploitation provides an opportunity for growth and increased yield as well as providing an opportunity to spawn when mature.
Measures such as seasons, closed areas and average meat count limits are also used to target fishing on the larger scallops which have higher yield.
Since there is no demonstrable relationship between stock and recruitment for sea scallops, the utility of biomass based stock limit reference points for the offshore scallop fishery on smaller banks is challenging. Therefore, the fishery will continue to be managed using techniques that have a proven track record, namely:
- choosing harvest levels based on peer reviewed DFO Science advice that includes associated risks;
- maintaining meat counts;
- targeting scallops that have already reproduced (believed to be age 4 and older), and
- monitoring the abundance of pre-recruits, recruits and commercial size scallops through surveys and gathering of commercial catch data.
6.2. Biodiversity
Controlling incidental mortality is the main objective under biodiversity. Currently all incidental bycatch species (other than monkfish) are returned back to the water from which they came and in a manner that causes the least harm. With respect to SARA species, the offshore scallop fishery supports actions within their recovery strategies for increased protection of the species.
Once assessed by COSEWIC, if a decision is made not to list a species under SARA, DFO is required to develop an “alternative approach” to species conservation using other legislative or non-legislative tools. If the “alternative approach” includes incremental actions, a 5-year workplan must be developed as per the Species at Risk Act Listing Policy and Directive for Do Not List Advice.
Existing regulations, licence conditions and protocols will be maintained as a means to control unintended incidental mortality. However, as other fish stocks rebuild in response to measures designed to increase their numbers, an increase in the bycatch of those species in scallop drags could be expected.
6.3. Habitat
Incidental Bycatch of Non-target Species
Fishing is now concentrated on the preferred habitat of scallops, i.e., gravel which is less sensitive to disturbance than softer bottom types. Consideration must be given to the conservation of the diversity of benthic and demersal species and communities susceptible to disturbance.
Industry managed closures in areas of high juvenile concentrations and DFO implemented closures in some groundfish spawning locations may have indirect benefits in terms of overall habitat disturbance but, to date, the benefits are not measurable.
In terms of managing the area of habitat disturbed, bottom mapping has been the most significant modern advance. More generally, a tactic for managing habitat disturbance is to limit the percentage of area disturbed and the frequency of disturbance. With seabed mapping the fishing is concentrated on the preferred scallop habitat, therefore limiting area disturbed.
The amount of lost gear for the offshore scallop fishery is very low, and when gear is lost every attempt is made to recover the gear. There is no ghost fishing of scallop drags.
Within the scallop management areas accessed by the offshore scallop fleet, Maritimes Region currently has:
- two Marine Protected Areas (The Gully and St. Anns Bank), which protect sensitive habitats from bottom-contact fishing
- Sensitive Benthic Areas
- the Western/Emerald Bank Conservation Area (WEBCA, a portion of the area formerly known as the “Haddock Box”)
Historically, the offshore scallop fleet has not operated in any of the coral conservation areas or in the Gully Marine Protected Area. The offshore scallop fleet will continue to consider its impact on other sensitive areas as they are identified in recovery strategies for species at risk, the Department’s Policy for Managing the Impacts of Fishing on Sensitive Benthic Areas, the Bycatch Policy and other initiatives.
Trap design as it relates to juveniles and unwanted bycatch
Offshore lobster and Jonah crab traps are required by licence condition to have an escape mechanism for undersized lobster.
Approach:
In addition, should escape gap modifications be recommended by DFO-Science for other species, including juvenile Jonah crab, these will be considered and the decision discussed within the OLJCMB, prior to providing recommendations to DFO.
6.3.1. Sensitive benthic areas
Seafloor or “benthic” ecosystems are essential components of Canada’s ocean environments. They are significant areas of marine biodiversity; providing habitat to diverse species and plants and supporting complex food chains. Many marine species within benthic ecosystems play an important social, cultural, and economic role in the lives of Canadians. To ensure healthy and productive marine benthic ecosystems, it is imperative that these areas be considered in fisheries management decision making.
In April 2009, DFO published the Policy for Managing the Impacts of Fishing on Sensitive Benthic Areas. The purpose of the Policy is to help DFO manage fisheries to mitigate impacts of fishing on sensitive benthic areas (SBAs) or avoid impacts of fishing that are likely to cause serious or irreversible harm to sensitive marine habitat, communities and species. The Policy applies to all commercial, recreational and Aboriginal fishing activities licensed and/or managed pursuant to the Fisheries Act and the Coastal Fisheries Protection Act.
There are multiple SBAs in Maritimes Region that have been closed to fisheries that utilize bottom-contact gear that is considered likely to cause serious or irreversible harm. Coordinates of regional SBA closures are included in licence conditions for relevant fisheries.
There are now six conservation areas within the offshore scallop fishing areas that have been identified as sensitive benthic areas. These areas have been closed to scallop drags and other bottom-contact gear in order to protect benthic communities, including deep-sea corals and sponges.
Northeast channel coral conservation area
Within the boundaries of SFAs 26-27, a closure under the Fisheries Act was established in June 2002 to protect an area known as the Northeast Channel Coral Conservation Area. The Conservation Area is located off the coast of southwestern Nova Scotia, between Georges Bank and Browns Bank and covers an area of 424 square kilometres. No bottom dredging is permitted in the area due to the high densities of octocorals, primarily bubblegum coral (Paragorgia arborea) and seacorn coral (Primnoa resedaeformis).
Lophelia coral conservation area
The Lophelia Coral Conservation Area, located at the mouth of the Laurentian Channel (within SFA 25), was established in 2004 (Figure 5) following the discovery of the Lophelia pertusa reef structure during benthic surveying. The colony of Lophelia pertusa is a rare cold-water coral species and the only known Lophelia pertusa reef structure in Atlantic Canada falls within this conservation area. This reef building coral complex shows signs of damage from fishing gear, and recovery is expected to take decades. The closure area covers only 15 square kilometres and is closed to all bottom contacting fishing activities, including all scallop fishing. The boundaries were designed to include a buffer to account for navigational accuracy and gear movement as a result of high currents in the area.
Sponge conservation creas: Sambro Bank and Emerald Basin
Two areas of high-densities of Vazella pourtalesi, commonly known as “Russian hat” have been identified as Sensitive Benthic Areas at high risk from fishing impacts. These areas include a 62 square kilometres area on the eastern edge of Sambro Bank and a 197 km² area between the southwest and northeast portions of Emerald Basin (both within SFA 25).
Jordan Basin conservation area
In September 2016, a 49 square kilometres conservation area was established in the eastern portion of Jordan Basin (within SFA 27). The closure captures two prominent bedrock ridges, including an outcrop called the “Rock Garden”. These features contain high densities of seacorn corals (Primnoa resedaeformis) and other sensitive filter feeding invertebrate communities.
Corsair and Georges Canyons conservation area
In September 2016, a 9,106 square kilometres conservation area was established south of Georges Bank (within SFA 27). This area is known to contain high densities of gorgonian corals, such as Paragorgia arborea, or bubblegum corals, as well as a wide variety of other coral species. The objective of this closure is the protection of these corals, as well as other deep-sea species and habitats that are known to be vulnerable to fishing impacts.
More information on these areas.
6.3.2. Other conservation closures – Western/Emerald Banks conservation area
The Western Bank Haddock Juvenile/Nursery Area in NAFO 4W (“the haddock box”) was created in 1987 and has been closed to all groundfish fishing activity (fixed and mobile) since 1993. The intent of the closure under the Fisheries Act was to protect incoming haddock recruits and allow the stock to rebuild (Frank and Simon, 1998). While the “haddock box” closure was originally established to increase Haddock productivity, there is scientific evidence that the area is important for multiple species of groundfish and contains other significant ecological features (DFO 2014a).
This area presents a unique opportunity to contribute to a variety of stock objectives and to meet multiple marine conservation goals. As such, DFO has expanded the original conservation objectives of the “haddock box”, to address broader resource and ecosystem management components, reforming the area into the Western/Emerald Banks Conservation Area (the Conservation Area). This closure is intended to remain in place for the foreseeable future and its management will be directed by the relevant IFMP. Given the long-term nature of the closure to date and the diversity of groundfish species found within the area, it would be consistent with the precautionary approach to maintain the area as a fisheries closure as a measure for the conservation and protection of groundfish and their habitat. More information on this area.
The offshore scallop fishery has had access to fish within the area since the creation of the closure and DFO considers that the continuation of this fishery within a selected portion of the Conservation Area will not jeopardize the achievement of the conservation objectives for this area.
The shaded polygon (shown in Figure 11, with coordinates) is defined as the offshore scallop fishing area of access within the Conservation Area which has been determined through a consultative process with offshore scallop fleet. This area was informed by considering the available offshore scallop survey data and the fishery footprint, which has changed over time. For example, the area identified with a star in the eastern portion of the “haddock box” has been an area where scallops have settled in the past (1980s) but have not recently settled in abundance to support a fishery. While it is not anticipated that scallop habitat and/or areas of settlement will change significantly in the foreseeable future in this part of Scallop Fishing Area 25, it is accepted that changes can occur. The Department recognizes it may be necessary to adjust the offshore scallop fishing area of access boundaries within this Conservation Area in the future to address this or other circumstances. Such changes would be evidence-based and adjusted based on a consultative process.
Figure 11: The Western/Emerald Bank conservation area
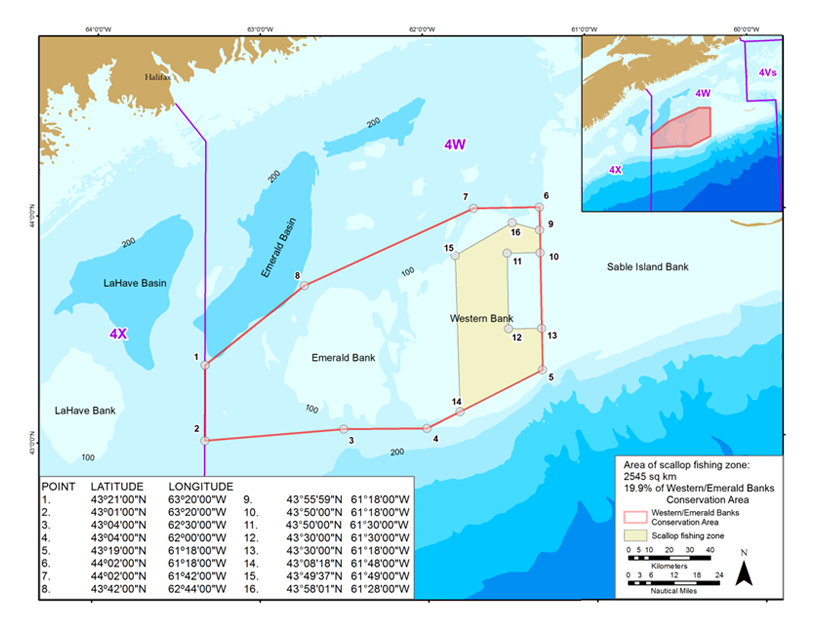
Description
Figure 11: The Western/Emerald Bank Conservation Area
| Point | Latitude | Longitude |
|---|---|---|
| 1 | 43°21’00” | 63°20’00” |
| 2 | 43°01’00” | 63°20’00” |
| 3 | 43°04’00” | 62°30’00” |
| 4 | 43°04’00” | 62°00’00” |
| 5 | 43°19’00” | 61°18’00” |
| 6 | 44°02’00” | 61°18’00” |
| 7 | 44°02’00” | 61°42’00” |
| 8 | 43°42’00” | 62°44’00” |
| 9 | 43°55’59” | 61°18’00” |
| 10 | 43°50’00” | 61°18’00” |
| 11 | 43°50’00” | 61°30’00” |
| 12 | 43°30’00” | 61°30’00” |
| 13 | 43°30’00” | 61°18’00” |
| 14 | 43°08’18” | 61°48’00” |
| 15 | 43°49’37” | 61°49’00” |
| 16 | 43°58’01” | 61°28’00” |
6.3.3. Pollutants and debris
The amounts of contaminants and toxins such as fuel, oil or other chemicals introduced in the environment should be limited to preserve the physical and chemical characteristics of the ocean bottom and water column. Dumping of such items in the ocean is not permitted. The monitoring of contaminants is carried out by other federal and provincial departments and agencies according to specific guidelines.
In terms of reducing debris introduced into the environment, the captain is responsible to ensure debris is not disposed of at sea and instead is held to be disposed of when landing at port.
6.4. Culture and sustenance
First Nations organizations do not hold licences for the offshore scallop fishery. However, their input is received through participation in the commercial fishery advisory committees and working groups.
6.5. Prosperity
The strategies for achieving this objective reflect some of the recommendations from the Atlantic Fisheries Policy Review (AFPR), which has been subsumed within the broader Fisheries Renewal initiative. Among other things, AFPR emphasized the need for flexibility in policy and licensing, and stability in access to resources and allocations. Fisheries Renewal recognizes that strategies such as these will improve the ability of fishing enterprises to adapt to changing resource and market conditions and to respond to market opportunities.
The EA program has been developed based on these policies and is the primary method to help create the circumstances for an economically prosperous offshore scallop fishery.
The plan provides flexibility for the fleet through limited entry, the transfer of licences, and the transfer of vessels authorized to fish under each licence. Individual Transferrable quotas (in-season and permanent transfers) and quota carry forward allow adjustment of capacity to resource availability.
Instability in access to the resource is minimized through the provision of fleet quotas through established sharing arrangements. While the TAC may fluctuate in response to changes in scallop abundance, fleets can be sure that their sector will retain a certain portion of the TAC to harvest.
6.6. Insignificant pressures
Offshore scallop fishing activities are not thought to contribute appreciably to several of the conservation‑related pressures that form part of the Ecosystem Approach to Management (EAM) Framework. The strategies associated with these pressures will not be considered further in this IFMP.
7. Access and allocation
Access to the Canadian offshore scallop fishery is limited to those enterprises
- eligible for licences for the fishery on October 31, 1988; and
- to which EAs were provided in 1988; or to their replacements. Specifically, access is limited to the six licence holders set out in Table 1.
Offshore scallop licences are valid for SFAs 3-9, 10, 11, 12, 25, 26, and 27 and valid for both sea scallops and Iceland scallops.
Prior to 2013 fishing within a trip was restricted to a single bank. This policy was modified to allow access to two banks during a trip as long as a request was submitted and approved prior to the start of the trip and an at-sea observer was on board the vessel during the entire fishing trip. A copy of the full policy is attached as Appendix 8.
7.1. Sharing arrangements
Although offshore scallop licences are valid for SFAs 3-9 the offshore fleet has not been given an allocation there. The fishery is predominantly for Iceland scallops and the resource is allocated entirely to the NL inshore scallop fleet.
SFAs 10, 11 and 12 encompass the waters on and around St. Pierre Bank. In 2006 the NL inshore scallop fleet and the offshore scallop fleet were geographically separated in terms of their access to sea scallops. The offshore fleet can fish anywhere in SFA 10 and 12 but must fish south of 46°12’ 01” North Latitude in SFA 11. This provides exclusive access to the North Bed by the NL inshore fleet. The NL inshore fleet, on the other hand, is not permitted to fish in either the Middle Bed or South Bed where the offshore fleet has exclusive access. (See map Figure 2)
Only offshore scallop licence holders are permitted to fish scallops in SFAs 25, 26 and 27.
7.2 Quotas and allocations
The offshore scallop resource is fully allocated to the existing licence holders under TACs for each SFA, or portion of a SFA. The licence fee for access to the offshore scallop fishery is $547.50 per tonne of allocation as prescribed in the Atlantic Fishery Regulations, 1985.
A quota carry-forward policy, of a maximum of 5% of the previous year’s quota during years when the stock is in the Healthy Zone, has been approved for the offshore scallop fleet for Georges Bank (A). The policy will provide participants with increased flexibility to manage quota from one fishing year to the next, in order to better adjust to resource and market fluctuations.
This approach is based on a consistent and transparent process and is subject to factors such as the status and trajectory of the stock to ensure that sustainability of the resource is not compromised. See Appendix 9 for a full description of the quota carry-forward guidelines.
Notwithstanding the above, the Minister can, for reasons of conservation or for any other valid reasons, modify access, allocations and sharing arrangements as outlined in this IFMP in accordance with the powers granted pursuant to the Fisheries Act.
8. Shared stewardship arrangements
Implementing a clear, consistent and stable approach to access and allocation and developing transparent decision-making processes will create appropriate conditions for the shared stewardship of fisheries resources. Also the new policy framework for the management of fisheries on Canada's Atlantic coast, under the AFPR, enables resource users and others to play a greater role in decision making, and thus to take greater responsibility for resource management decisions and their outcomes. As part of this shared stewardship, the offshore scallop fleet bears the incremental costs of the following projects by:
- funding an independent third party dockside monitoring program;
- funding all port sampling of commercial catches, i.e., size distribution of meats in the catch;
- following the protocol for marketing of roe-on scallops including responsibility for PSP and Domoic Acid analysis;
- providing a commercial scallop fishing vessel and crew to carry out research surveys in SFAs 25, 26 and 27 under the direction of a DFO biologist;
- continuing with the voluntary program to monitor meat counts for the purpose of protecting juvenile scallops;
- providing funding to DFO, under a collaborative agreement, to collect scientific data and provide analytical support for offshore scallop data bases used for development and assessment of the fisheries on Georges Bank and the Scotian Shelf;
- summarizing results of past gear experiments aimed at minimizing incidental catches; and
Based on above projects the 2017-2018 offshore scallop research work plan outlines three five-year research objectives:
- Current assessments and forecast for most of the scallop fishing areas provide reliable short-term (1 year) predictions of biomass. However there’s a need to better incorporate spatial patterns and processes to improve assessment advice within an ecosystem context.
- Need to provide more holistic ecosystem advice to better address emerging-species specific and ecosystem issues by develop sampling protocols to monitor scallop condition (e.g. animal health, GSI, etc.) and evaluate hypotheses about how habitat, and other environmental factors influence stock and community dynamics.
- Integrate imagery and MBES data to product habitat and species distribution maps that will provide the framework against which fishery data can be assessed to test finer scale habitat associations, increase understanding of scallop dynamics, and provide information on patterns and processes on other benthic species.
9. Compliance plan
9.1. Conservation and protection program description
The management of Canadian fisheries requires an integrated approach to monitoring, control and surveillance that involves the deployment of fishery officers to air, sea and land patrols, observer coverage on fishing vessels, dockside monitoring, and remote electronic monitoring.
Conservation and Protection (C&P) activities are designed to ensure compliance with the legislation, policies and fishing plans relating to the conservation and sustainable use of the resource. The C&P National Compliance Framework describes a three pillar approach to the sustainability of this and other fisheries. The pillars are:
- Education/shared stewardship
- Monitoring, control and surveillance; and
- Major case management.
The full Compliance Framework is available upon request.
9.2. Regional compliance program delivery
Compliance in the Offshore Scallop fishery is achieved through the application of the Fisheries Act, the Fishery (General) Regulations, the Atlantic Fishery Regulations, 1985, the Coastal Fisheries Protection Act and the Coastal Fisheries Protection Regulations by fishery officers.
The following offers a general description of compliance activities carried out by C&P in relation to the offshore scallop fishery:
- at sea, fishery officers conduct inspections of offshore scallop vessels to check licences, gear, catches, assess observer performance and ensure compliance along the international boundary
- on shore, fishery officers conduct licence and landing checks, monitor weigh-outs and routinely assess the integrity of the DMP
- air patrols to ensure compliance with licence conditions, seasonal and area closures and as a cross reference to VMS
- C&P authorizes VMS service providers, monitors the accuracy of their reporting systems and uses the data as part of its surveillance activities (the offshore scallop fleet pioneered the use of VMS technology as a compliance tool in Atlantic Canada)
- C&P establishes standards for privately delivered at-sea observer services and assures the delivery of accurate data and reports
- C&P designates both at-sea and dockside observers (third parties; these designations are subject to individuals meeting background checks and eligibility criteria, and requires the successful completion of exams)
- generally, across a broad range of fisheries, C&P carries out investigations into reports of large scale fraud and collusion.
9.3. Consultation
Education and shared stewardship are achieved in the offshore scallop fishery through a renewed emphasis on C&P communication with other DFO sectors, the industry, and community at large including:
- engagement in internal DFO consultation with Resource Management and other DFO branches through post season analysis and other committees to assess the effectiveness of enforcement activities and to develop recommendations for the upcoming season;
- participation in enforcement meetings with industry to determine expectations in relation to monitoring, control and surveillance activities; and
- informal interaction with all parties involved in the fishery on the wharf, during patrols or in the community to promote conservation.
9.4. Compliance performance
Data from VMS, observer reports, fishery officer information and DFOs violation system were reviewed between 2010 and 2016. All of these sources point to a very good compliance track record.
The only incidents of note during the period involved a written warning issued to a captain for fishing a short distance on the US side of the international boundary and two other written warnings for non-compliance with dockside monitoring procedures in accordance to licence conditions. There were also two instances where crewmembers were unable to produce the required fisher’s registration cards.
A summary of officer time, incidents and observer coverage for the period 2010-2016 appears in Appendix 10.
9.5. Current compliance issues
Fishery officer compliance checks usually focus on specific issues depending on the fishery. As indicated in section 9.4, there is a high degree of compliance in the offshore scallop fishery and demonstrated self-regulation. Nevertheless, there is regular monitoring for compliance with a number of standard requirements/ issues;
| Compliance issue | Objectives |
|---|---|
| Meat counts (can differ by SFA or by portion of a SFA) | Optimize yield per recruit based on knowledge of productivity within SFAs. |
| Dockside monitoring/ catch reporting | Ensure TAC integrity for the fleet, for each SFA or portion thereof and for each allocation holder. Ensure no retention of unauthorized species. |
| Observer coverage | Verify fleet bycatch levels to meet Canada’s commitment to account for all bycatch of yellowtail flounder, cod and haddock under the United States-Canada Transboundary Resource Sharing Understanding. |
| International boundary | Ensure that the offshore fleet fishes only within Canadian fisheries waters. (Note: Both Canada and the USA are responsible for ensuring compliance with the international boundary by their respective fleets) |
| Closed areas | Maintain fleet separation between offshore and inshore scallop fleets. Reduce potential bycatch of other species (i.e., cod and yellowtail flounder) |
| Single area trips | Each SFA or portion thereof, has an assigned TAC and meat count. To ensure integrity with that TAC and meat count only one SFA, or portion thereof, may be fished during any single fishing trip, except as otherwise approved by DFO where an at-sea observer is present for the entire fishing trip. |
9.6. Compliance strategy
Annual work plans were already mentioned in the section on compliance program delivery. The following table summarizes the generic compliance objectives across all scallop fisheries in the region (inshore, offshore and recreational) and strategies to address them.
| Compliance risks | Mitigating strategies |
|---|---|
Dockside monitoring/ catch reporting
|
|
Unauthorized activity
|
|
Illegal fishing area
|
|
Meat counts/ Others
|
|
10. Evaluation, monitoring and plan enhancement
It is crucial to effective management that there be evaluations of the performance of sector plans, or specific elements of them, to determine whether the rules and regulations that were employed are being effective and thus that the strategies in the overall plan are being adequately implemented in that sector. The general plan evaluation will determine whether:
- the plan identifies and addresses all the important impacts on the ecosystem
- that the strategies are effective in meeting the plan objectives
- that the strategies are being implemented satisfactorily overall
Long-term objectives for the IFMP center on maintaining viability of the stock and existing fleet, promoting shared stewardship and optimizing benefits for participants and local communities. Evaluation criteria include
- collection of catch and effort information through monitoring documents
- at sea, air and dockside checks by DFO staff
- essential data to assess the health of the stock collected and supplied to DFO Science
- communications to industry
- feedback from industry
- overall adherence to the plan
The development of a precautionary approach with identification of effective measures will be a major performance indicator.
Since most of the tactics identified in this IFMP have been introduced over a period of time and this is the first year of the plan no formal monitoring has previously been completed. In the future a performance review will be conducted annually and the plan will be updated and enhanced as necessary. The review will include an assessment internal to DFO, as well as an industry working group drawn from advisory committee members to assist in the review of the plan. Any plan enhancements will be discussed through the advisory process and may be integrated as a separate appendix for the IFMP.
Table 9 outlines the timetable for evaluation and monitoring so as to ensure the fishery is meeting the objectives outlined in Section 5. The Plan Enhancement column specifies areas of research, data limitations and policy development that will be improved upon to make further advances and improvements to the IFMP.
| Issue | Strategy | Evaluation | Monitoring | Plan enhancement |
|---|---|---|---|---|
| What is the management issue you’re addressing? | What is the strategy for managing the pressure (including specific reference points)? | What is the schedule for evaluating strategies & tactics? | What data will you be collecting to monitor performance of the plan? | What monitoring & data weaknesses are there? |
Objective: Productivity Do not cause unacceptable reduction in productivity so that components can play their role in the functioning of the ecosystem. |
||||
| Opportunity for commercial fishing over short and long terms. | Keep scallop fishing mortality moderate by using reference points and harvest control rules where available and/or maintaining moderate fishing effort. | Annual review at pre-assessment science and RAP meetings, and also at advisory meetings and various pre-season fleet meetings depending on management and science requirements. | a) Abundance estimates of fishable biomass through annual science surveys. b) Survey estimates of recruitment abundance. c) Abundance indices of pre-recruits. d) Landings data from log books. e) Maps of survey abundances. |
a) Reference points and harvest control rules have been incorporated for Georges Bank (A) and may be revised if new information is available. b) Reference points proposed for Browns Bank need to be accepted. c) Reference point development for all other banks. d) Require better pre-recruit abundance estimates. |
Objective: Biodiversity Do not cause unacceptable reduction in biodiversity in order to preserve the structure and natural resilience of the ecosystem. |
||||
a) Potential for catching monkfish and other bycatch. b) Potential for wolffish, listed as threatened or special concern under SARA, to be caught in drags. |
a) Keep fishing mortality of monkfish moderate and within historic levels. b) Control unintended incidental mortality. c) Mandatory release of wolffish and any other future SARA species that interacts with this fishery. |
Annual assessments review available bycatch information at RAP, Science, Advisory meetings. | Catch monitoring through at sea observers. |
a) Review logbooks for full and accurate completion. b) Ensure adherence to existing at-sea monitoring program for bycatch monitoring. c) Review at-sea monitoring objectives and requirements to ensure useable data are available for MSC. d) Discuss potential changes with OSAC. e) Determine whether there are opportunities to improve dredge design to reduce bycatch. |
a) SARA logs for wolffish. b) Catch monitoring through at-sea observers. |
a) Review SARA logbooks for full and accurate completion. b) Support actions within recovery strategies for SARA species. c) Ensure adherence to existing at-sea monitoring program for bycatch monitoring. d) Review at-sea monitoring objectives and requirements to ensure useable data are available for MSC and SARA e) Determine whether there are opportunities to improve dredge design to reduce benthic disturbance. |
|||
Objective: Habitat Do not cause unacceptable modification to habitat in order to safeguard both physical and chemical properties of the ecosystem. |
||||
a) Disturbance of bottom due to benthic scouring by bottom contact scallop drag gear. b) Region has a strategy to protect sensitive benthic areas under the SBA policy. |
Limit amount of disturbance for benthic areas. | Annual review at science and RAP meetings, advisory meetings and various pre-season fleet meetings depending on management and science requirements. | Ongoing monitoring of fishing areas in preferred scallop habitat through VMS. | a) Continue investigation into general impacts of scallop drags. b) Develop measures and reference points to determine significance of impacts. c) Identification of sensitive benthic areas is ongoing, and industry will respond as new information becomes available. |
Objective: Culture & sustenance Respect Aboriginal and treaty rights to fish. |
||||
| Historically fished scallop only nearshore. | Respect Aboriginal and treaty rights. | First Nation representation at advisory committee meetings. | DFO Resource Management. | - |
Objective: Prosperity Help create the circumstances for economically prosperous fisheries. |
||||
| Provide ability to take advantage of situations to maximize profitability. | a) Limit inflexibility in policy and licensing to individual enterprises and licence holders. b) Minimize instability in access to resources and allocations. c) Provide internal mechanisms that allow self-adjustment of capacity to resource availability. |
Annual review at advisory meetings and various pre-season fleet meetings depending on management requirement. |
a) Qualitative feedback from industry. b) Review licence transfers. c) Review quota transfers (permanent and temporary), Fleet quotas, sharing arrangements, and quota carry forward. |
Enhancements to policy and licensing (i.e. flexibility) are ongoing and will be updated as implemented. |
| Support certification for sustainability | Certifying body evaluates annually | Provide information for annual reviews | ||
11. Safety at sea
Vessel owners and masters have a duty to ensure the safety of their crew and vessel. Adherence to safety regulations and good practices by owners, masters and crew of fishing vessels will help save lives, protect the vessel from damage and protect the environment. All fishing vessels must be in a seaworthy condition and maintained as required by Transport Canada (TC), and other applicable agencies. Vessels subject to inspection should ensure that the certificate of inspection is valid for the area of intended operation.
In the federal government, responsibility for shipping, navigation, and vessel safety regulations and inspections lies with Transport Canada (TC); emergency response with the Canadian Coast Guard (CCG) and DFO has responsibility for management of the fisheries resources while ensuring that safety at Sea is considered. DFO (Fisheries and Aquaculture Management (FAM) and CCG) and TC have a Memorandum of Understanding to formalize cooperation and to establish, maintain and promote a safe culture within the fishing industry.
Before leaving on a voyage the owner, master or operator must ensure that the fishing vessel is capable of safely making the passage. Critical factors for a safe voyage include the seaworthiness of the vessel, vessel stability, having the required safety equipment in good working order, crew training, and knowledge of current and forecasted weather conditions.
Useful publications include Transport Canada Publication TP 10038 ‘Small Fishing Vessel Safety Manual’ which can be obtained from TC or printed from their website.
12. Glossary
Aboriginal Traditional Knowledge (ATK): Knowledge that is held by, and unique to Aboriginal peoples. It is a living body of knowledge that is cumulative and dynamic and adapted over time to reflect changes in the social, economic, environmental, spiritual and political spheres of the Aboriginal knowledge holders. It often includes knowledge about the land and its resources, spiritual beliefs, language, mythology, culture, laws, customs and medicines.
Abundance: Number of individuals in a stock or a population.
Biomass: total weight of all individuals in a stock or a population.
Bycatch: The unintentional catch of one species when the target is another.
Committee On the Status of Endangered Wildlife In Canada (COSEWIC): Committee of experts that assess and designate which wild species are in some danger of disappearing from Canada.
Discards: Portion of a catch thrown back into the water after they are caught in fishing gear.
Dockside Monitoring Program (DMP): A monitoring program that is conducted by a company that has been designated by the Department, which verifies the species composition and landed weight of all fish landed from a commercial fishing vessel.
EBSA (Ecologically and Biologically Significant Area): an EBSA is an area that has particularly high Ecological or Biological Significance, and should receive a greater-than-usual degree of risk aversion in management of activities in order to protect overall ecosystem structure and function within the LOMA.
Ecosystem-based management: Taking into account of species interactions and the interdependencies between species and their habitats when making resource management decisions.
Fishing effort: Quantity of effort using a given fishing gear over a given period of time.
Fishing mortality: Death caused by fishing, often symbolized by the Mathematical symbol F.
Groundfish: Species of fish living near the bottom such as cod, haddock, halibut and flatfish.
Landings: Quantity of a species caught and landed.
Maximum Sustainable Yield (MSY): Largest average catch that can continuously be taken from a stock.
Mobile gear: A type of fishing gear that is drawn through the water by a vessel to catch fish. Scallop drags, otter trawls and purse seines are considered mobile gear.
Natural mortality: Mortality due to natural causes, symbolized by the mathematical symbol M.
Observer coverage: When a licence holder is required to carry an officially recognized observer onboard their vessel for a specific period of time to verify the amount of fish caught, the area in which it was caught and the method by which it was caught.
Population: Group of individuals of the same species, forming a breeding unit, and sharing a habitat.
Precautionary approach: Set of agreed cost-effective measures and actions, including future courses of action, which ensures prudent foresight, reduces or avoids risk to the resource, the environment, and the people, to the extent possible, taking explicitly into account existing uncertainties and the potential consequences of being wrong.
Quota: Portion of the total allowable catch that a unit such as vessel class, country, etc. is permitted to take from a stock in a given period of time.
Recruitment: Amount of individuals becoming part of the exploitable stock e.g. that can be caught in a fishery.
Research survey: Survey at sea, on a research vessel, allowing scientists to obtain information on the abundance and distribution of various species and/or collect oceanographic data. Ex: bottom trawl survey, plankton survey, hydroacoustic survey, etc.
Species At Risk Act (SARA): The Act is a federal government commitment to prevent wildlife species from becoming extinct and secure the necessary actions for their recovery. It provides for the legal protection of wildlife species and the conservation of biological diversity.
Stock: Describes a population of individuals of one species found in a particular area, and is used as a unit for fisheries management.
Stock assessment: Scientific evaluation of the status of a species belonging to a same stock within a particular area in a given time period.
13. References
- Caddy, J., Gordon, D., Angel, J. & P. Knapman. 2010. Public certification report for the Eastern Canada offshore scallop fishery. Moody Marine Ltd., Nova Scotia, Canada, 164 pp.
- DFO. 2004. Allowable Harm Assessment for Spotted and Northern Wolffish. DFO Can. Sci. Advis. Sec. Stock Status Report 2004/031.
- DFO. 2006. Impacts of Trawl Gears and Scallop Dredges on Benthic Habitats, Populations and Communities. DFO Can. Sci. Advis. Sec. Sci. Advis. Rep. 2006/025.
- DFO. 2014a. Offshore Ecologically and Biologically Significant Areas in the Scotian Shelf Bioregion. DFO Can. Sci. Advis. Sec. Sci. Advis. Rep. 2014/041.
- DFO. 2015a. Assessment Update of Browns Bank North Scallops (Placopecten magellanicus). DFO Can. Sci. Advis. Sec. Sci. Resp. 2015/024.
- DFO. 2015b. Assessment Update of Georges Bank Scallops (Placopecten magellanicus). DFO Can. Sci. Advis. Sec. Sci. Resp. 2015/025.
- DFO. 2015c. Wolffish in the Atlantic and Arctic regions. DFO Can. Sci. Advis. Sec. Sci. Advis. Rep. 2014/022.
- Frank, K.T. and J. E . Simon.1998. An evaluation of the Emerald/Western Bank juvenile haddock closed area. Can. Stock Assessment Sec. Res. Doc. 98/53.
Appendix 1: Summary of Maritimes Region EAM framework
This appendix summarizes the framework adopted by DFO Maritimes Region for implementing an ecosystem approach to management (EAM) in all activities for which the department has management responsibility. It also discusses application of the framework more specifically to fisheries management.
Introduction to EAM
An ecosystem approach to managing human activity requires consideration of an activity’s impact on all components of the ecosystem – including its structure, function and overall quality – and not just on the resource being used. It also means accounting for the cumulative effects of multiple uses, and accounting for how environmental forces, such as climate change, might be affecting how we should manage.
Fully implementing EAM will be a large undertaking. Progress will happen in a step-by-step, evolutionary way. In the short-term, the Department will work on implementing EAM in the context of discrete activities, such as fishing. In the long-term, a diversity of ocean users and regulators will need to come together to draw up plans for the integrated management of all ocean activities. First attention will be given to impacts of the highest importance and offering the greatest scope for improvement.
EAM in the context of fisheries management
Consensus is growing within Canada and internationally that the sustainability of fish stocks and fisheries requires an ecosystem approach to management. Traditionally, fisheries management has focused on regulating the impact of fishing on the targeted species. Under an ecosystem approach, managers consider impacts not only on the target species but also on non-target species and habitat. Some of these impacts will be direct, such as impacts on the populations of non‑target species that suffer mortality incidentally because of interactions with fishing gear. Other impacts may be indirect, such as the effects of mortality on predator-prey relationships. IFMPs will document the main impacts on the ecosystem from fishing activities and outline how these pressures will be managed.
Main elements of the framework
EAM is a management planning framework. Management planning requires the specification of objectives (what you want to achieve), of strategies (what you will do to manage human‑induced pressures so that you can achieve your objectives), and tactics (how you will implement your strategies). These elements are presented in the table overleaf. They are the foundation of the Region’s EAM framework and have been developed to cover the full range of potential impacts on the ecosystem resulting from the various activities managed by the Department. (Not all strategies will be relevant to all activities.)
| Attributes | Objectives: Strategies with associated pressures | Managed activities | Tactics |
|---|---|---|---|
Expansion of attributes considered
|
Productivity: Do not cause unacceptable reduction in productivity so that components can play their role in the functioning of the ecosystem
Biodiversity: Do not cause unacceptable reduction in biodiversity in order to preserve the structure and natural resilience of the ecosystem
Habitat: Do not cause unacceptable modification to habitat in order to safeguard both physical and chemical properties of the ecosystem
Culture and sustenance: Respect Aboriginal and treaty rights to fish
Prosperity: Create the circumstances for economically prosperous fisheries
|
For example, groundfish fishery, herring fishery, salmon/aquaculture, etc. Expansion of pressures considered Cumulative effects of pressures on other managed activities considered |
|
Note: Elements associated with culture, sustenance and prosperity are provisional and at present are being applied only in fisheries management.
Objectives
Under EAM, management planning within the Region will be guided by three ecosystem objectives:
- Productivity: Do not cause unacceptable reduction in productivity so that components can play their role in the functioning of the ecosystem.
- Biodiversity: Do not cause unacceptable reduction in biodiversity in order to preserve the structure and natural resilience of the ecosystem.
- Habitat: Do not cause unacceptable modification to habitat in order to safeguard both physical and chemical properties of the ecosystem.
It is impractical to pursue conservation in isolation from the economic, social and cultural aspirations of users, and these must be recognized in any plan if it is to be successful. The Region intends to develop a set of economic, social and cultural objectives in the near future that will be common to all activities managed by the Department. In the meantime, Resource Management has developed the following, provisional objectives for application in fisheries management:
- Culture and Sustenance: Respect Aboriginal and treaty rights to fish.
- Prosperity: Create the circumstances for economically prosperous fisheries.
Attributes
Attributes are traits of the ecosystem that we value. They are the means by which the broadly stated objectives are given specificity. We might be interested in the condition of many ecosystem attributes. Those listed in the first column of Table 1A are ones that respond to human induced pressures. Examples of attributes of fish populations are yield, breeding behaviour, biomass and genetic structure. Examples of ecosystem attributes are population richness, spatial occupancy and trophic structure. There are initiatives also by DFO to identify ecologically or biologically sensitive areas (EBSAs), ecologically or biologically sensitive species (EBSSs), Depleted Species and Degraded Areas. These too can be viewed as attributes of an ecosystem.
Strategies and references
As stated, objectives are very general statements that are translated into practical terms through the definition of strategies. Strategies state “what” will be done to manage pressures from human activities. Common pressures from fishing activities are fishing mortality, incidental mortality, and disturbance of bottom habitat. The strategies aim to control the impact of these pressures on the valued ecosystem attributes.
Strategies define how the pressures imposed by human activities will be managed. For example, what level of fishing mortality is viewed as acceptable? How much bottom habitat disturbance is too much? This is done by using references that define pressure levels that cause unacceptable or undesirable impacts on the attributes. The basis for determining references will vary depending on the state of knowledge. Some may be chosen fairly arbitrarily when knowledge is weak, perhaps based on historical trends. When more is known, their determination may involve evaluation of alternative population/ecosystem dynamics models, ranging from 'single species' to 'full ecosystem' models. There are many gaps in scientific knowledge of ecosystem structure and function, and, no matter how references are determined, they will need revision as the human and environmental factors affecting ecosystems become better understood.
Tactics
Tactics are sometimes referred to as tactical management measures. They are “how” the strategies will be implemented to manage the pressures imposed by fishery activities. Examples of common tactics in fisheries management are total allowable catches, individual or community quotas, seasonal closures, gear restrictions, minimum fish sizes and dockside monitoring.
Monitoring and evaluation
Monitoring and evaluation are necessary for ensuring management plans are working as intended. Monitoring involves collecting data that will provide information on how well or badly the various features of the plan are performing. Evaluation involves determining whether strategies are being implemented adequately and whether they are doing their job in meeting the plan objectives. Evaluation also involves assessing whether the plan identifies and addresses all the important impacts on the ecosystem.
In fisheries management plans, strategies and references for pressures are likely to remain unchanged for the duration of the plan. However, as new understanding is gained, or when prevailing conditions alter the productivity of the resource, review and evaluation of strategies and references may be warranted. Tactics may be specified for the duration of the plan, or they may require regular intervention to set appropriate levels.
Plan enhancement
Developing a robust plan that addresses the full range of ecosystem impacts of a given activity will take time and resources, and it is unlikely that data to support all elements will be available at the outset. In recognition of this, management plans should identify the main weaknesses of the plan, including weaknesses in the data needed for setting references for strategies, evaluating pressures relative to the references, and checking compliance with tactics.
Management plans should also outline any data collection that is underway and the research required to make advances, noting the risks if not done.
Appendix 2: The enterprise allocation program
The Enterprise allocation program in the Canadian offshore scallop fishery
| February 15, 1989 | - |
| * Revised November 1996 | - |
| ** Revised December 2004 | - |
| *** Revised July 2008 | - |
| **** Revised September 2017 | - |
| * November 1996 | Revisions made for housekeeping purposes only. |
| ** December 2004 | Revisions made to update EA percentage shares approved in 2003 and 2004. |
| *** July 2008 | Revisions made to update EA percentage shares approved in 2007 and amend those sections pertaining to additional monitoring, enforcement and compliance. |
| **** September 2017 | Revisions made to update EA removing the maximum LOA vessel restriction. |
Enterprise allocations in the Canadian offshore scallop fishery
Context
Enterprise Allocations (EAs) were introduced in the Offshore Scallop Fishery in June of 1986 following extensive government/industry consultations with the Offshore Scallop Advisory Committee (OSAC). As these company quotas resulted in a significant change in the harvesting strategy for this common property resource, the concept was introduced on a three year trial basis. The nature of the longer term harvesting strategy beyond the trial period (1986-1988) would depend on the relative successes of the program during the implementation phase. On October 30, 1986, the Minister announced the permanent separation of the inshore and offshore fleets at the 43° 40’ North Latitude line near Yarmouth, Nova Scotia.
Through a series of meetings in late 1988 and early 1989, OSAC met to discuss and provide advice on the future of the EA program under a format agreed upon earlier by the Committee. The review included, firstly, an assessment of whether the program had been successful in supporting the objectives of the Offshore Scallop Management Plan (supported by a DFO economic assessment) and secondly, detailed discussions of revisions to the harvesting strategy should the program be continued.
The strong general consensus of OSAC was that the trial program had contributed to the objectives of the Plan. Biological advice indicated that a wider range of year classes was appearing in the stock which would continue to assist in the stabilization of the fishery over time. On the economic side, all members concluded that the program had contributed to the provision of increased economic benefits to the fishermen, vessel owners, shore-workers and the people of Canada, and that, generally, all those engaged in the fishery were better off in social and economic terms than would have been the case should the fishery have remained competitive. Crew member representatives expressed concern over the level to which fleet downsizing would occur in the future and requested that season catch limits and the trip limit and duration remain in the plan.
As a result of this assessment, in a strong consensus, OSAC recommended that EAs be continued in the future. This document sets the principles and guidelines for the implementation of EAs as the long term harvesting strategy for the fishery.
Establishing the Total Allowable Catches
- The objectives of establishing TACs and of the Management Plan generally for the offshore scallop fishery are three-fold:
- to ensure the conservation and restoration of the resource;
- to the degree possible, to stabilize annual landings over time and;
- to provide increased economic benefits for fishermen, vessel owners, shore-workers, and the people of Canada.
- A TAC will be established annually for scallop stocks in Scallop Fishing Areas (SFAs) 10, 11, 12, 25, 26 and 27. Given the high variability in the numbers recruiting into fishable size, and the rapid pre-recruit growth rate in the stocks, the TAC will be based on the best biological advice available at the time, taking into account the above stated objectives. (Concerns about growth and recruitment over-fishing will be considered when establishing the TAC). The annual TAC advice will be discussed in the OSAC forum prior to the commencement of the fishing year.
- The development of TAC management strategies for other offshore scallop stocks will be pursued in consultation with OSAC subject to the perceived need of the strategy to allow for rational harvesting and taking into consideration biological advice.
- TACs for the offshore scallop fishery will be established annually for a fishing year beginning on January 1 and ending on December 31.
- The Department will continue to refine the techniques used to establish TACs in order to provide more timely advice and to determine more definitive TAC levels in the future.
Access to the resource
- Access to the Canadian Atlantic Offshore Scallop Fishery in SFAs 10 (west of 55° 10' W.) 11, 12, 25, 26, and 27 is limited to those enterprises eligible for licences for the fishery on October 31, 1988, and to which EAs were provided in 1988 or their replacements. (See section "Individual Enterprise Allocations", pg. 4).
- Access to the developmental Iceland Scallop fishery in SFAs 3-9, and that portion of SFA 10 east of 55° 10' W., will be limited to two vessels of any size in the first three years (1989-1991). (See section of this document "Developmental Fishery for Iceland Scallops")
- No foreign flagged vessels will be authorized for any fishing activity in the Canadian Offshore Scallop Fishery.
Individual enterprise allocations
The percentage shares negotiated per enterprise in 1986 will continue in the future and will apply to new stock areas which may be managed by TACs and EAs in the future unless otherwise negotiated through OSAC.
The following Table summarizes the individual company shares of the offshore scallop TACs.
| Company name | Percent share of TAC |
|---|---|
| LaHave Seafoods Limited | 5.92 |
| Mersey Seafoods Limited | 7.00 |
| Adams and Knickle Limited | 9.77 |
| Comeau’s Sea Foods Limited | 16.68 |
| Ocean Choice International L.P. | 16.77 |
| Clearwater Seafoods Limited Partnership | 43.86 |
No one fishing enterprise may hold more than 50% of any specific scallop stock. For the purposes of this section, enterprise includes any subsidiaries under one corporate structure.
Term of the plan
A primary objective of the EA program is to provide stability for fishermen and vessel owners in order that a sound investment and working environment is maintained and enhanced. As such, it is the intent of this plan, through this section, to foster a commitment of government and industry for a stable and secure program into the future.
The EA plan for the offshore scallop fishery shall remain in place indefinitely. It is recognized, however that a certain amount of fine-tuning may be necessary as experience is gained. Amendments to the plan will be considered when strong consensus exists that change(s) is (are) warranted.
Any member of OSAC may request discussion on any point of the plan at any time. Should the committee not achieve consensus on the issue, a member may trigger a review of the EA program on the provision of five (5) years notice.
Administrative guidelines for enterprise allocations in the offshore scallop fishery
Permanent transfers of enterprise allocations
- The permanent transfer of a portion of a company's enterprise allocation to another company will not be permitted. Should the transfer of an EA be necessary in the event of the sale of a company, that company will be required to request that its entire EA and all related licence be reissued to the new owner. For the purposes of the section, company means any one of the enterprises listed in the section "Individual Enterprise Allocations"
- All requests for permanent transfers of EAs must be approved by the Minister of Fisheries and Oceans.
Temporary transfers of EAs within the fishing year
- Once an EA is established, it is the responsibility of the Enterprise to decide how this allocation is to be harvested. The concept of the EA program in the offshore scallop fishery is that each individual EA will be harvested by the holder. Each Enterprise undertakes, as a matter of principle, that all or part of its allocation that cannot be harvested shall be offered to the remaining active enterprises.
- Inter-enterprise transfers of EA's maybe necessary during the fishing year as companies fine-tune their harvesting plans. Such transfers of allocations are temporary in that they will be applicable to that fishing year only.
(a) Transfers of EAs are not automatic. To assure that such transactions are accurately recorded and properly understood by all participants, the parties involved must submit their request for a "temporary" transfer in writing to the Chairman of OSAC or his designate. The Department will respond as quickly as possible.
(b) Transfers of EAs from individual enterprises within the offshore scallop fleet will only be offered to those enterprises within the offshore scallop fleet having eligible Canadian registered vessels.
(c) Barring catastrophic events, an enterprise will not be authorized to transfer in excess of 25% of its EA for more than two consecutive years.
(d) A transaction report will be forwarded to all offshore scallop enterprises upon request.
Permanent vessel replacement
- One of the major longer term benefits of the EA approach is that each enterprise will naturally invest in the appropriate number, size and type of vessel necessary to harvest its allocation in the most economically effective manner. In contrast to competitive fishing, there should be no tendency toward over-investment in the fleet.
- While acknowledging the principle spoken to in item 1, it is recognized that some caution is to be exercised in developing fisheries and in the heavily capitalized existing fishery.
- In SFAs 10 (west of 55° 10' W.) 11, 12, 25, 26, and 27 the minimum size of vessels will be 19.8 m (65').
- For the developing fishery in SFAs 3 to 9, and that portion of SFA 10, (east of 55 °10’ W), see the section of this document "Developmental Fishery for Iceland Scallops."
- In the event of the collapse of the EA program, the fishery could revert to a competitive fishery. In this event, enterprises (or their replacements) would be held to the number of licences held in 1986 prior to the introduction of EAs.
Licensing mechanisms
- In order to ensure effective implementation, operation and monitoring of the EA program, each company owning vessels in the offshore scallop fleet, will be required to provide the department with the following information:
- the name of the authorized officer of the company responsible for the administration of that company's EAs and the operation of that company's fishing vessels; and
- a list of the offshore scallop vessels which will be fishing that company's allocation.
- In accordance with the Offshore Scallop Licensing Policy, limited entry will remain a feature of the program. A maximum of 76 licences will be authorized for the fishery.
- Should an enterprise withdraw vessel(s) from the fishery, such action shall not be cause for the removal of that vessel's fishing privilege. Should the fishery revert to a competitive fishery at any time in the future, enterprises would have two years from the date of the cessation of the program to enter a replacement vessel or to enter into a binding contractual agreement to acquire a replacement vessel.
- Should the offshore scallop fishery revert to a competitive fishery in the future, each enterprise (or its replacement, in the event of sale of that enterprise) would be permitted to utilize those licences held on January 1, 1986.
- In order to assure effective monitoring and control of the fishery, limited fishery licences for each vessel will be required in addition to the EA licence issued to the enterprise.
- In the event of repossession of vessels or the bankruptcy of an enterprise, the portion of the company's EA equivalent to the average historical catch of the vessel repossessed will revert to the Licensing Authority for possible reallocation.
Regulatory and enforcement measures
New regulatory requirements
To assure the successful implementation of the EA program, the following new regulations are required:
- A regulation to prevent the carrying of scallop fishing gear on board of a vessel in SFA 27 by vessels without offshore scallop licences.
- Regulations may become necessary to effectively control harvesting aspects of the roe-attached fishery in order to complement health and market protection sections of the Fish Inspection Act. Such regulations will be developed in consultation with OSAC.
- If and as new technology is introduced to the fishery, new regulations may be required in order to assure the integrity of size limits and annual allocation. Of particular note, is the enforcement of size and annual limits in the case of scallops that are frozen and sorted at sea. While maintaining integrity is not seen as insurmountable, the need for caution has been identified as such changes appear in the fishery. Any appropriate regulations will be developed in consultation with OSAC.
- The benefits of more variation of meat counts have been identified in order to be able to respond to changes in biological advice or objectives in the management of the fishery.
Additional monitoring, enforcement, and compliance provisions
- Each company shall keep a separate journal recording scallop landings, area fished, and value of each trip landed which shall be made available upon request to a Fishery Officer.
- The recommended penalty schedule to be presented to the court when speaking to sentence is attached in Appendix C.
- Administrative provisions for allocation adjustments where such provisions are not specified in regulation:
Where a licence holder exceeds an allocation amount for any SFA in one quota period, an equivalent amount of allocation will be deducted from that licence holder in that SFA in the next quota period.
New technology
Whereas the introduction of new technology may have significant impacts on the management and regulation of the fishery and on those engaged in the fishery, there shall be consultation through the OSAC forum (prior to introduction) on the following or other similar topics: freezing at sea in the traditional fishery (not currently seen as a problem other than from the regulatory perspective), automated shucking or changes in harvesting technology.
Appendix 3: History of EA percentage shares
History of EA percentage shares in the offshore scallop fishery
The following summarizes, for all companies within the traditional Canadian offshore scallop fishery, the individual company shares of the TACs.
| EA percent share of TAC | ||||||||
|---|---|---|---|---|---|---|---|---|
| Company Name | Original | Revised | ||||||
| 1986 | February 1989 | June 1994 | January 1996 | June 2004 | December 2004 | April 2005 | January 2008 | |
| Adams and Knickle Limited | 9.77 | 9.77 | 9.77 | 9.77 | 9.77 | 9.77 | 9.77 | 9.77 |
| Comeau Seafoods Limited | 15.42* | 15.42 | 15.42 | 15.42 | 15.42 | 15.42 | 16.68 | 16.68 |
| Fishery Products International Limited | 16.77 | 16.77 | 16.77 | 16.77 | 16.77 | 16.77 | 16.77 | - |
| Mersey Seafoods Limited | 7.00 | 7.00 | 7.00 | 7.00 | 7.00 | 7.00 | 7.00 | 7.00 |
| Scotia Trawler Equipment Limited | 16.32 | 16.32 | 16.32 | 16.32 | - | - | - | - |
| Laurence Sweeney Fisheries Limited | 13.49 | 13.49 | - | - | - | - | - | - |
| Clearwater Fine Foods Limited | - | 21.23 | 17.57 | 31.06 | 46.38 | 45.12 | 43.86 | 43.86 |
| LeHave Seafoods Limited | - | - | 3.66 | 3.66 | 4.66 | 5.92 | 5.92 | 5.92 |
| Ocean Choice International Limited | - | - | - | - | - | - | - | 16.77 |
| Island Pride Fisheries Limited | 0.66 | - | - | - | - | - | - | - |
| C.W. McLeod Fisheries Limited | 7.14 | - | - | - | - | - | - | - |
| Pierce Fisheries Limited | 13.43** | - | - | - | - | - | - | - |
| Pick O'Shea Fisheries | - | - | 13.49 | - | - | - | - | - |
| * includes the combined allocations of Comeau's Sea Foods Limited, Lady Denise Fisheries Limited, Lady Francine Fisheries Limited, and Lady Louisa Fisheries Limited. | ||||||||
| ** includes 3% allocation previously held by J. Lawrence Enterprises Limited. | ||||||||
Appendix 4: Advisory committee terms of reference
Offshore scallop advisory committee terms of reference
Purpose
The Offshore Scallop Advisory Committee will provide input and advice to Fisheries and Oceans Canada (DFO) on the conservation, protection and management of the offshore scallop resource. The Committee will serve as the pre-eminent consultative forum for the development of the annual Offshore Scallop Fishing Plan.
Scope
The Committee will provide recommendations and advice on the management of the offshore scallop resource for Scallop Fishing Areas 3-9 (Grand Banks), 10-12 (St. Pierre Bank), 25 (Eastern Scotia Shelf – Middle, Sable/Western, and Banquereau Banks), 26 (German and Browns Banks) and 27 (Georges Bank).
The Committee will provide advice on annual fishing plans, regulatory measures, fishing seasons, licensing policies, size limitations and gear restrictions. It will make recommendations on annual total allowable catches, quotas, the administration of enterprise allocation programs and on the introduction of new fishing technologies into the fishery that may affect existing management measures.
The Committee will give consideration to biological, marketing and other information as it affects the management of the resource.
Administration
Structure
Any changes to the structure and administration of the Committee are decided by the Committee membership.
Subcommittees
Ad hoc subcommittees/working groups can be established to review and assess specific policy options and management measures.
Meetings
Meetings can be held throughout the Scotia-Fundy sector. When feasible, meetings will be held at times and places convenient to the membership.
Expenses
Members are responsible for their own expenses incurred while attending meetings.
Voting procedures
No formal voting procedures will be established. The Committee will seek to operate on a consensus basis.
Minutes of meetings
Minutes of the Committee’s meetings will be prepared and distributed by DFO.
Public access
Unless a majority of Committee members say otherwise before a meeting starts, the proceedings of the Advisory Committee will be open to the public and to media representatives.
DFO working groups
The Committee will be supported by a working group of DFO officials who will consolidate scientific, economic and management advice into draft fishing plans for the Committee’s consideration.
Number of meetings
The Committee will meet at least twice a year. Additional meetings can be held if required.
Attendance
If a member cannot attend, an alternate may be nominated and the Chairman notified as far in advance of the meeting date as possible.
Membership
Chairmanship - The committee chairmanship will be held by a DFO official. An industry co-chairman may be appointed at the discretion of committee members.
Membership on the committee shall be made up of those industry sectors having a major involvement in the harvesting and processing/marketing of the resource, as well as representatives of government of provinces with significant shore-based infrastructure and DFO. The current Offshore Scallop Advisory Committee members are listed in Appendix 5.
Appendix 5: Advisory committee membership list
| Name | Organization |
|---|---|
| Federal government | |
| DFO | Fisheries and Aquaculture Management |
| DFO | Resource Management (Maritimes Region) |
| DFO | Resource Management (NL Region) |
| DFO | Conservation and Protection |
| DFO | Science |
| DFO | Policy & Economics |
| CFIA | - |
| Associations | |
| Seafood Producers Assoc. of NS | |
| Grand Manan Fishermen’s Assoc. | |
| Full Bay Scallop Association. | |
| CAW-TCA Local 1944 | |
| UFCW | |
| Fish, Food and Allied Workers Union (FFAW) | |
| Licence holders/ processors | |
| Clearwater Seafoods Limited Partnership | |
| Adams and Knickle Limited | |
| LaHave Seafoods Limited | |
| Mersey Seafoods Limited | |
| Comeau’s Sea Foods Limited | |
| Ocean Choice International L.P. | |
| Aboriginal organizations | |
| Band Chiefs | |
| Assembly of NS Mi’kmaq Chiefs | |
| Netukulimkewe’l Commission (NCNS) | |
| Commercial Fisheries Liaison Co-coordinators | |
| Provincial governments | |
| NS Dept. of Fisheries and Aquaculture | |
| NL Department of Fisheries | |
Appendix 6: Annual fishing plan procedures
Procedures for establishing and amending annual fishing plans
- The authority to approve and amend annual fishing plans in the Canadian offshore scallop fishery rests with the Regional Director-General (RDG), DFO, Maritimes Region.
- The Offshore Scallop Advisory Committee (OSAC) serves as the pre-eminent consultative forum for the development of annual Offshore Scallop Fishing Plans. OSAC is open to the public, is advisory in nature and has official membership that, in addition to DFO staff, includes representation from licence holders, the Provinces of Nova Scotia (NS) and Newfoundland and Labrador (NL), unions representing crews from the offshore scallop fleet in NS and the inshore scallop fleet from NL and Aboriginal organizations.
- OSAC meets at least once each year, Minutes are produced annually, distributed electronically to members and are available to the public.
- OSAC meetings are typically held in late November to provide DFO, taking into account the advice provided, with sufficient time to:
- develop an Interim Fishing Plan for the coming season;
- obtain DFO approval of the Interim Plan;
- amend licence conditions and/or implement variation orders as may be required; and
- calculate licence fees payable, prior to December 31.
- The RDG approval of the Interim Fishing Plan is obtained through an internal process whereby the results of the OSAC consultations are provided, including where there may be conflicting advice, how the advice provided at OSAC aligns with the DFO Science information presented, a DFO analysis of that advice and a recommendation for approval.
- Interim Fishing Plans may be amended from time to time throughout the fishing season, usually at the request of licence holders. Amendments to Interim Fishing Plans follow a similar consultative process but without the need for a formal OSAC meeting. OSAC members are advised in writing of any requested amendment to the current Plan, of the anticipated Science implications if the amendment is approved and provided with a specific timeframe during which concerns can be sent to DFO. After the timeline for member input has expired, RDG approval (or not) for an amendment to an Interim Fishing Plan follows the procedure set out in item 5.
- Interim Fishing Plans may be finalized any time throughout the season but usually not before formal updated DFO Science advice is received in April/May. RDG approval is not required for a Final Fishing Plan if there are no changes from an already approved Interim Fishing Plan.
- Decisions on the Total Allowable Catch (TACs) for all banks take into consideration the following:
- DFO/industry vessel survey information;
- commercial catch/effort data;
- meat count information from port sampling; and
- a long history of managing the stocks within a modest range of TACs that affords sustainable fishing opportunities.
- modest TACs in combination with the established meat counts guard against over-harvesting.
- In addition to the measures set out in item 8, for Georges A and Browns Bank North, which account for approximately 90% of the annual offshore landing, updated Science advice is provided annually and formal peer-reviewed advice is provided on a 5-year cycle. A range of harvest scenarios is provided along with a corresponding exploitation rate, probability of biomass decline and expected change (%) in biomass. Management decisions around this advice are aimed at keeping the resource in the “healthy zone” as defined in the context of the department’s implementation of the Precautionary Approach.
Appendix 7: TAC and landings values
Offshore scallop Total Allowable Catch (TAC), landings (meat weight, tonnes) and landed values ($’000) by bank, 1990-2015p
(first of two pages; fishery totals on second page)
| - | Georges Bank | Georges Bank B | Browns Bank | Browns Bank South | ||||||||
|---|---|---|---|---|---|---|---|---|---|---|---|---|
| Year | TAC | Landings | Values | - | - | - | TAC | Landings | Values | - | - | - |
| 1990 | 5,200 | 5,219 | $47,477 | - | - | - | 200 | 207 | $1,883 | - | - | - |
| 1991 | 5,800 | 5,800 | $56,084 | - | - | - | 220 | 215 | $2,079 | - | - | - |
| 1992 | 6,200 | 6,151 | $70,723 | - | - | - | 450 | 454 | $5,220 | - | - | - |
| 1993 | 6,200 | 6,191 | $92,456 | - | - | - | 600 | 575 | $8,587 | - | - | - |
| 1994 | 5,000 | 5,003 | $82,759 | - | - | - | 1,400 | 1,403 | $23,208 | - | - | - |
| 1995 | 2,000 | 1,984 | $32,605 | - | - | - | 2,000 | 2,002 | $32,901 | - | - | - |
| 1996 | 3,000 | 2,995 | $51,457 | - | - | - | 750 | 743 | $12,765 | - | - | - |
| 1997 | 4,250 | 4,259 | $79,537 | - | - | - | 500 | 500 | $9,338 | - | - | - |
| - | Georges Bank A | Georges Bank B | Browns Bank North | Browns Bank South | ||||||||
|---|---|---|---|---|---|---|---|---|---|---|---|---|
| Year | TAC | Landings | Values | TAC | Landings | Values | TAC | Landings | Values | TAC | Landings | Values |
| 1998 | 3,200 | 3191 | $59,062 | 800 | 800 | $14,807 | 500 | 500 | $9,255 | 100 | 99 | $1,832 |
| 1999 | 2,500 | 2503 | $44,666 | 1,200 | 1,196 | $21,343 | 200 | 200 | $3,569 | 300 | 293 | $5,229 |
| 2000 | 6,200 | 6212 | $97,960 | 600 | 601 | $9,475 | 750 | 748 | $11,796 | 200 | 200 | $3,148 |
| 2001 | 6,500 | 6480 | $80,672 | 400 | 395 | $4,913 | 1,000 | 999 | $12,437 | 100 | 99 | $1,232 |
| 2002 | 6,500 | 6469 | $74,099 | 200 | 192 | $2,203 | 650 | 649 | $7,436 | 100 | 98 | $1,120 |
| 2003 | 6,000 | 5985 | $73,516 | 200 | 199 | $2,449 | 1,000 | 1,003 | $12,316 | 100 | 97 | $1,197 |
| 2004 | 3,500 | 3518 | $46,717 | 200 | 200 | $2,652 | 2,000 | 2,007 | $26,657 | 200 | 185 | $2,452 |
| 2005 | 2,500 | 2484 | $31,540 | 200 | 201 | $2,550 | 1,075 | 1,068 | $13,559 | 100 | 38 | $487 |
| 2006 | 4,000 | 3,931 | $51,558 | 200 | 162 | $2,127 | 1,050 | 912 | $11,960 | 100 | 14 | $186 |
| 2007 | 4,000 | 4,000 | $49,471 | 400 | 400 | $4,949 | 1,200 | 1,198 | $14,811 | 50 | 1 | $8 |
| 2008 | 5,500 | 5,498 | $72,107 | 400 | 358 | $4,691 | 400 | 393 | $5,153 | 0 | 0 | $0 |
| 2009 | 5,500 | 5,524 | $73,814 | 350 | 260 | $3,476 | 0 | 0 | $0 | 0 | 0 | $0 |
| 2010 | 5,500 | 5,291 | $59,727 | 200 | 66 | $750 | 200 | 201 | $2,270 | 0 | 0 | $0 |
| 2011 | 4,500 | 4,517 | $74,982 | 0 | 0 | $0 | 1,000 | 1,027 | $17,051 | 0 | 0 | $0 |
| 2012 | 4,000 | 4,001 | $74,391 | 50 | 47 | $870 | 500 | 476 | $8,845 | 0 | 0 | $0 |
| 2013 | 5,000 | 4,999 | $106,631 | 100 | 108 | $2,307 | 750 | 749 | $15,976 | 10 | 0 | $5 |
| 2014p | 5,500 | 5,406 | $114,423 | 200 | 191 | $4,034 | 750 | 746 | $15,784 | 0 | 0 | $0 |
| 2015p | 4,000 | 4,017 | $97,013 | 400 | 398 | $9,623 | 750 | 749 | $18,086 | 0 | 0 | $0 |
Data source: DFO Maritimes Region Note: Values calculated using inshore average price for Scallop in Maritimes Region.
Appendix 7 (continued): Offshore scallop Total Allowable Catch (TAC), landings (meat weight, tonnes) and landed values ($’000) by bank, 1990-2015p
(second of two pages)
| - | German Bank | East Scotian Shelf | Banquereau Bank | St. Pierre Bank | Total | ||||||||||
|---|---|---|---|---|---|---|---|---|---|---|---|---|---|---|---|
| Year | TAC | Landings | Values | TAC | Landings | Values | - | - | - | TAC | Landings | Values | TAC | Landings | Values |
| 1990 | - | - | - | - | 434 | $3,948 | - | - | - | 150 | 152 | $1,383 | 5,550 | 6,012 | $54,691 |
| 1991 | - | - | - | - | 389 | $3,761 | - | - | - | 150 | 134 | $1,296 | 6,170 | 6,538 | $63,220 |
| 1992 | - | - | - | - | 524 | $6,025 | - | - | - | 150 | 67 | $770 | 6,800 | 7,196 | $82,738 |
| 1993 | 200 | 200 | $2,987 | - | 250 | $3,733 | - | - | - | 150 | 115 | $1,717 | 7,150 | 7,331 | $109,481 |
| 1994 | 600 | 600 | $9,925 | 150 | 116 | $1,919 | - | - | - | 150 | 49 | $811 | 7,300 | 7,171 | $118,622 |
| 1995 | 400 | 399 | $6,557 | 150 | 150 | $2,465 | - | - | - | 150 | 68 | $1,118 | 4,700 | 4,603 | $75,646 |
| 1996 | 100 | 91 | $1,563 | 175 | 175 | $3,007 | - | - | - | 50 | 18 | $309 | 4,075 | 4,022 | $69,102 |
| 1997 | 100 | 100 | $1,868 | 175 | 174 | $3,249 | - | - | - | 50 | 3 | $56 | 5,075 | 5,036 | $94,047 |
| - | German Bank | East SS excl Banquereau | Banquereau Bank | St. Pierre Bank | Total | ||||||||||
|---|---|---|---|---|---|---|---|---|---|---|---|---|---|---|---|
| Year | TAC | Landings | Values | TAC | Landings | Values | TAC | Landings | Values | TAC | Landings | Values | TAC | Landings | Values |
| 1998 | 300 | 301 | $5,571 | 355 | 265 | $4,905 | 50 | 51 | $944 | 50 | 0 | $0 | 5,355 | 5,207 | $96,376 |
| 1999 | 600 | 597 | $10,653 | 350 | 277 | $4,943 | 150 | 148 | $2,641 | 50 | 0 | $0 | 5,350 | 5,214 | $93,044 |
| 2000 | 600 | 599 | $9,449 | 200 | 195 | $3,072 | 150 | 147 | $2,314 | 50 | 4 | $65 | 8,750 | 8,705 | $137,280 |
| 2001 | 600 | 599 | $7,457 | 200 | 199 | $2,472 | 100 | 89 | $1,113 | 50 | 0 | $0 | 8,950 | 8,859 | $110,297 |
| 2002 | 800 | 797 | $9,128 | 250 | 178 | $2,040 | 100 | 5 | $57 | 50 | 0 | $0 | 8,650 | 8,388 | $96,079 |
| 2003 | 400 | 399 | $4,903 | 250 | 229 | $2,807 | 50 | 0 | $0 | 50 | 0 | $0 | 8,050 | 7,912 | $97,188 |
| 2004 | 400 | 401 | $5,328 | 250 | 246 | $3,262 | 50 | 0 | $0 | 250 | 251 | $3,333 | 6,850 | 6,807 | $90,401 |
| 2005 | 200 | 199 | $2,531 | 250 | 235 | $2,984 | 100 | 10 | $131 | 250 | 267 | $3,391 | 4,675 | 4,502 | $57,174 |
| 2006 | 600 | 601 | $7,886 | 150 | 140 | $1,832 | 100 | 0 | $0 | 195 | 5 | $69 | 6,395 | 5,766 | $75,617 |
| 2007 | 600 | 599 | $7,404 | 150 | 150 | $1,849 | 50 | 25 | $307 | 0 | 0 | $0 | 6,450 | 6,372 | $78,798 |
| 2008 | 400 | 394 | $5,167 | 125 | 87 | $1,136 | 50 | 0 | $0 | 0 | 0 | $0 | 6,875 | 6,730 | $88,254 |
| 2009 | 200 | 200 | $2,668 | 75 | 33 | $441 | 0 | 0 | $0 | 0 | 0 | $0 | 6,125 | 6,017 | $80,399 |
| 2010 | 200 | 170 | $1,913 | 75 | 31 | $352 | 0 | 0 | $0 | 0 | 0 | $0 | 6,175 | 5,759 | $65,012 |
| 2011 | 150 | 126 | $2,091 | 75 | 27 | $454 | 0 | 0 | $0 | 0 | 0 | $0 | 5,725 | 5,697 | $94,577 |
| 2012 | 150 | 152 | $2,827 | 75 | 61 | $1,134 | 10 | 10 | $187 | 0 | 0 | $0 | 4,785 | 4,747 | $88,253 |
| 2013 | 150 | 144 | $3,074 | 100 | 88 | $1,869 | 0 | 0 | $0 | 0 | 0 | $0 | 6,110 | 6,088 | $129,862 |
| 2014p | 150 | 136 | $2,886 | 100 | 40 | $852 | 0 | 0 | $0 | 25 | 0 | $0 | 6,725 | 6,519 | $137,979 |
| 2015p | 100 | 82 | $1,992 | 100 | 56 | $1,363 | 50 | 0 | $0 | 50 | 0 | $0 | 5,450 | 5,302 | $128,077 |
Data source: DFO Maritimes Region Note: Values calculated using inshore average price for Scallop in Maritimes Region.
Appendix 8: Authorization to fish two banks
Approval procedure/requirements
Offshore scallop licence holders requesting authorization to fish more than one scallop quota area during a single fishing trip
How to make the request
- E-mail the request to the Department of Fisheries and Oceans (DFO) Senior Advisor. The request should contain the name of the vessel and the name of the two quota fishing areas that are intended to be fished, i.e., Georges Bank A and German Bank. (Only a maximum of two quota areas will be approved for fishing during a single fishing trip). The e-mail must confirm that an observer will be present during the entire fishing trip.
Approval of the request
- Subject to meeting the requirements set out below, an e-mail approving or denying the request will be sent by the DFO Senior Advisor to the licence holder making the request. The e-mail from the DFO Senior Advisor will be copied to appropriate staff in DFO Science and Conservation and Protection divisions.
Requirements for approval
- An observer (at sea) is required to be on board the vessel during the entire fishing trip. That same observer must remain present until all Scallops from that fishing trip have been landed (offloaded) from that vessel and the weight of the Scallops from the two respective quota areas has been verified by another observer (dockside).
- During any fishing trip where approval has been provided to fish two quota areas, the licence holder/operator must (a) number in indelible ink all holding boxes and bags containing Scallop meats; or (b) tag all bags containing Scallop meats with a tag that locks or seals so that the tag cannot be removed without tampering with the lock or seal or with the bag. The licence holder/operator must record in the Offshore Scallop Monitoring Document the numbers on the boxes and bags or the tag numbers on the bags so as to accurately reflect which boxes and which bags of Scallop meats were retained from the first and second quota area fished. The Licence holder/operator must also start recording information on a new page in the Offshore Scallop Monitoring Document when fishing commences in the second quota area.
- After transiting from the first quota area fished to the second quota area to be fished, and prior to the commencement of any fishing activity in the second quota area, the licence holder/ operator must hail, through the IVR system, the weight of scallop meats retained on board the vessel from the first quota area fished.
September 26, 2013
Appendix 9: Quota carry-forward guidelines
Quota carry-forward guidelines for offshore scallop fleet for Georges A 2016
The ability to carry forward Georges Bank A scallop quota will provide participants with increased flexibility to manage quota from one fishing year to the next, in order to better adjust to resource and market fluctuations. This approach is based on a consistent and transparent process and is subject to factors such as the status and trajectory of the stock to ensure that sustainability of the resource is not compromised.
It should be noted that the DFO Minister may, at any time, make decisions on the quantity of fish that can be authorized under a licence. The Minister cannot be bound to carry forward an authorized amount that was not caught the previous year.
Objectives
Provide for the sustainable use of fishery resources by an economically viable and diverse industry through:
- maximizing opportunities for licence holders to carry out their harvesting activities in the most efficient manner;
- aligning resource harvest with economic factors; and
- facilitating self-reliance among members of the fishing industry.
Additionally, the process that is established for quota carry-forward must require minimal administrative oversight and cost for DFO.
Application
- This policy applies to the quota-based fishery for scallops for Georges Bank A in the Maritimes Region, Enterprise Allocations (EA).
- The percentage of quota that may be carried forward from year to year will be limited to a maximum of 5% of the previous year’s quota, as requested by the industry. This percentage for the Offshore Scallop Fleet will be based on the initial and redistributions of quota allocated per EA licence and also includes any temporary quota transfers between EA licence holders in that year. Lower limits may be considered if conservation concerns warrant it; the application of new limits would be discussed with the Offshore Scallop Advisory Committee.
- The carry-forward option will be available at the company EA level. Following the 60-day quota reconciliation period for the Offshore Fleet, any remaining quota from the previous fishing year (up to the maximum) for individual licences will be automatically carried forward and added to the initial quota for the following year.
- Quota carry-forward will be available when the stock is in the Healthy Zone. When the stock is in the Cautious Zone, quota carry-forward will be considered only if the stock is/has been on a positive trend and the TAC is increasing.
- In cases where an audit of DFO records reveals reporting or other errors that resulted in a carry-forward of quota that had already been fished, any quota carried forward in error will be clawed back.
- EA licence fees will be based on the initial quota allocated each year, not including amounts carried forward.
- Any EA quota that is carried forward on a licence is attached to the licence and will remain even if that licence is transferred (re-issued).
- Permanent EA concentration limits will not be affected by any amount carried forward.
- Implementation of this policy will be formalized through the addition of these guidelines to the Integrated Fisheries Management Plan.
Appendix 10: C & P compliance summary
| Total fishery officer hours in the offshore scallop fishery | ||
|---|---|---|
| Year | Enforcement | Shared stewardship and other program activities related to offshore scallops |
| 2010 | 208 | 11 |
| 2011 | 98 | 14 |
| 2012 | 84.75 | 42.5 |
| 2013 | 90.75 | 57.5 |
| 2014 | 171.25 | 19 |
| 2015 | 102.25 | 15.5 |
| 2016 | 66 | 1 |
*Offshore scallops is a relatively small activity in comparison to groundfish and lobster. The drop in enforcement hours may simply be a reflection of other issues in other fisheries that required attention. An absence of meetings in 2016 may explain why there was only a single hour of dedicated shared stewardship activity.
| Number of incidents by compliance issue and year 2010-2016 | ||||||||
|---|---|---|---|---|---|---|---|---|
| Compliance issue | 2010 | 2011 | 2012 | 2013 | 2014 | 2015 | 2016 | Total |
| Dockside monitoring problem* | - | - | - | - | 1 | 1 | - | 2 |
| Fishing in US waters** | 1 | - | - | - | - | - | - | 1 |
| Personal registration | 1 | - | - | 1 | - | - | - | 2 |
| Total | 2 | - | - | 1 | 1 | 1 | - | 5 |
*In one instance, an offloading commenced before the arrival of a dockside observer. In the other, the offloading was conducted in a manner that did not allow observers to maintain visual continuity.
**Canadian vessels fishing in US waters without the appropriate licences are in violation of both Canadian and US law. Similar provisions apply to US vessels fishing in Canadian waters under reciprocal legislation.
| At-Sea observer coverage | |||||
|---|---|---|---|---|---|
| 2011 | 2012 | 2013 | 2014 | 2015 | 2016 |
| 23 trips | 23 trips | 19 trips | 26 trips | 22 trips | 25 trips |
- Date modified: