
Lobster Fishing Areas 27 – 38: Integrated Fisheries Management Plan
Maritimes region
Updated March 2022
Foreword
The purpose of this Integrated Fisheries Management Plan (IFMP) is to identify the main objectives and requirements for the inshore lobster fishery in Maritimes Region, namely Lobster Fishing Areas 27-38, as well as the tactics that will be used to achieve these objectives. This document also serves to communicate the basic information on the fishery and its management to employees of Fisheries and Oceans Canada (DFO), legislated co-management boards and other stakeholders. This IFMP provides a common understanding of the basic rules for the sustainable management of the fisheries resource.
Through IFMPs, DFO Maritimes Region intends to implement an ecosystem approach to management across all marine fisheries. The approach considers impacts extending beyond those affecting the target species and, in this respect, is consistent with the Food and Agriculture Organization’s Code of Conduct for Responsible Fisheries. Implementation will take place in a step by step, evolutionary way, building on existing management processes. Advances will be made incrementally, beginning with the highest priorities and issues that offer the greatest scope for progress.
This IFMP is not a legally binding instrument that can form the basis of a legal challenge. The IFMP can be modified at any time and does not fetter the Minister's discretionary powers set out in the Fisheries Act. The Minister can, for reasons of conservation or for any other valid reasons, modify any provision of the IFMP in accordance with the powers granted pursuant to the Fisheries Act.
Where DFO is responsible for implementing obligations under land claims agreements, the IFMP will be implemented in a manner consistent with these obligations. In the event that an IFMP is inconsistent with obligations under land claims agreements, the provisions of the land claims agreements will prevail to the extent of the inconsistency.
Signed: Regional Director, Fisheries Management, Maritimes Region
Table of contents
- 8. Access and allocation
- 9. Shared stewardship arrangements
- 11. Performance review
- 12. Monitoring
- 13. Plan enhancement
1. Overview of the fishery
1.1 History
Inshore lobster is 1 of the oldest managed fisheries in Canada. The harvesting of inshore lobster can be traced back to pre-colonial times when it was an important food source for Aboriginal peoples who harvested lobster (jakej) through the spring and fall using traps and spears.
By the mid-eighteenth century, various trapping methods had been developed to catch lobsters, culminating in the evolution to the parlour trap in the early 1900s that still forms the basis for the types of traps in use today.
In 1884, the first lobster cannery was established. This helped shift the sale of locally harvested lobster away from a strictly domestic market to a more international market, predominantly Great Britain. The sale of live lobsters has expanded significantly and this product form has been the mainstay of the industry since the Second World War.
Since the late 1800s, numerous regulations have been applied to the lobster fishery. Most regulations initially were based on market requirements and considerations and not on biological concerns. In 1873, the first regulatory measures were introduced to establish restrictions on soft shell lobsters and egg bearing females. Fishing seasons were introduced in the Bay of Fundy area as early as 1879, with additional size restrictions coming into play in 1899. However, throughout the late 1800s and up until the mid-1900s enforcement of these initial regulations was very sporadic and inconsistent. Figure 1 outlines the historical trend in landings and shows where some of the regulations were introduced.
Following almost a century of varied and inconsistent management and regulatory approaches, the present day fishery is the result of a number of initiatives first introduced in the late 1960s. In 1967, Fisheries and Oceans Canada (DFO) introduced a limited entry licensing policy for portions of Prince Edward Island and New Brunswick and expanded this application of the policy to the remainder of the Maritimes in 1968. Prior to that, no restrictions were in place for acquisition of a lobster licence. Along with limiting the number of licences, the department introduced trap limits and defined boundaries for most of the modern day lobster fishing areas (LFAs).
In 1976, the so called moonlighter policy was introduced with the aim of removing from the fishery those not dependent on it for their primary source of income. Three categories of licences were created:
- Category A licences for those fully dependent on the fishery;
- Category B for those not fully dependent but with a historical attachment to the lobster fishery since 1968; and
- Category C licences that had little or no dependency and which expired in 2 years.
Category B licences were eligible to fish 1/3 of the trap limit for a Category A licence. Under The Commercial Fisheries Licensing Policy for Eastern Canada , 1996, Category B licences have never been transferable and expire upon the death of the licence holder.
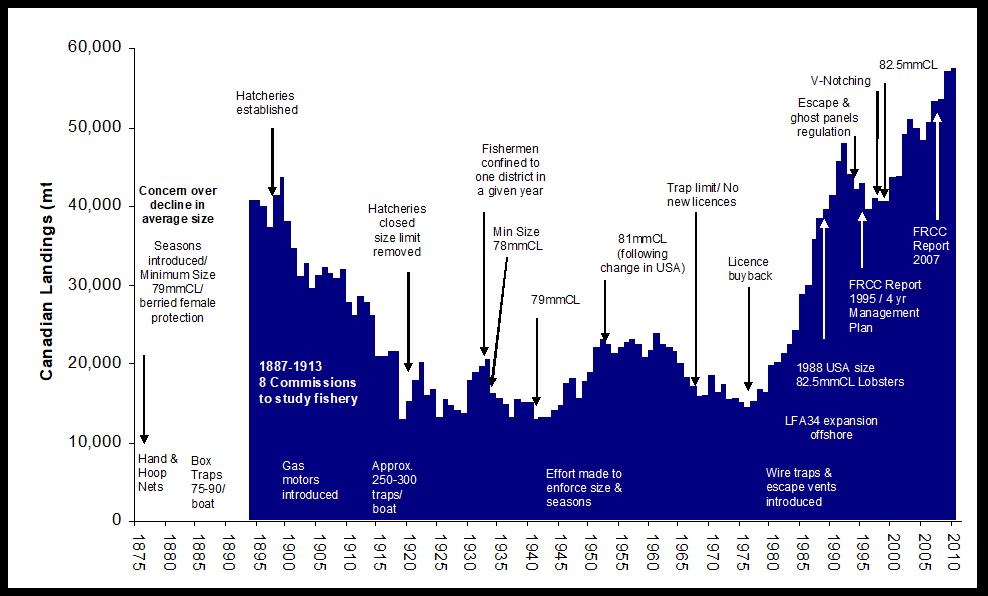
Figure 1: Historical landings and introductions of regulations - Description
This chart shows the historical landings from the lobster fisheries and introductions of regulations.
In 1978 to 1981, a lobster licence buy-back program was implemented to reduce the number of participants and in particular those who were not dependent on the fishery. Approximately 1500 licences were retired in Nova Scotia (1406) and southwest New Brunswick (170).
In the mid to late 1980s, regulations were strengthened to include requirements for escape vents and biodegradable panels to be installed in lobster traps to limit ghost fishing (capture due to lost, dumped or abandoned fishing gear). In 1995, following a decline in landings from the 1991 peak, the Minister of Fisheries and Oceans Canada requested that the Fisheries Resource Conservation Council (FRCC) review the state of the lobster fishery in Atlantic Canada. Their report, A Conservation Framework for Atlantic Lobster (FRCC95.R.1), concluded that the elements key to achieving a healthy fishery are good egg production, a reasonable mortality and a biomass composed of several year classes. In 1997, after 2 years of consultation, the Minister of Fisheries and Oceans identified as a target the doubling of eggs per recruit as a means of conserving and sustaining lobster stocks. A 4-year period, from 1998 to 2001, was the timeframe fishermen had to put in place measures that would achieve the doubling target at some future point.
At the direction of the Assistant Deputy Ministers of Science and Fisheries Management, a small DFO working group was formed to examine the results of the 4-year plans to double eggs per recruit (1998-2001). The Report of the Lobster Conservation Working Group (2001) indicated that the management changes in Maritimes Region LFAs were relatively minor and that by-and-large they failed to meet the specific target of doubling eggs per recruit. There were 2 notable exceptions to this, LFA 27, which had implemented significant minimum size increases, and LFA 30, which was already at or above the target level set by the FRCC of 5% egg production expected in an un-fished population. Changes that did occur included minor increases in minimum legal carapace size, a maximum size on females in LFA 30, a window size restriction in LFA 31A and adoption of a voluntary v-notching program by harvesters in all LFAs except LFA 31A and LFA 27.
In July 2007, the FRCC published their second report, Sustainability Framework for Atlantic Lobster , in which they identified low eggs per recruit, poor stock structure, high exploitation rates and poor compliance as the 4 key risks to the long-term sustainability of the Atlantic inshore lobster fishery. In response to the FRCC recommendations, Maritimes Region identified 3 priorities:
- improve the accuracy of information and data collected and specifically improve the reporting of landings (logs);
- implement measures in each LFA to provide more protection for mature female lobsters (broodstock) and begin to identify issues associated with expanding effort and exploitation levels; and
- improve the overall governance and stewardship of the resource through the consultation process.
As a result of these recommendations the requirement to submit lobster monitoring documents was added to the licence conditions. Progress has been slow in addressing the latter 2 concerns.
In 1990, the Supreme Court of Canada released its decision in R. v. Sparrow. In this landmark decision, the Court provided meaning and context to the Constitution Act, 1982, section 35(1) and held that, after conservation and other “valid legislative objectives”, Aboriginal rights to fish for food, social and ceremonial (FSC) purposes have priority over all other uses of the fishery. Through the Aboriginal Fisheries Strategy, DFO provides a framework for the management of fishing by Aboriginal peoples for FSC purposes. Agreements are negotiated and the Minister or delegate issues a communal licence to reflect the agreement reached, or when an agreement is not reached, the Minister issues a communal fishing licence consistent with the provisions of Sparrow and subsequent Supreme Court of Canada decisions.
1.2 Type of fishery
Currently, the inshore lobster fishery consists mainly of a large commercial fishery, which occurs throughout Maritimes Region, and an FSC fishery. There are also opportunities for educational licences. There is currently no authorized recreational harvesting of lobster. Any development of a recreational fishery would require additional policy research and would occur under provisions of the Atlantic Marine Recreational Fisheries Policy.
1.2.1 Commercial
The commercial fishery is licensed under the Fishery (General) Regulations of the Fisheries Act and, in the case of Aboriginal groups, the Aboriginal Communal Fishing Licences Regulations . Regulations specific to commercial lobster fishing are contained in the Atlantic Fishery Regulations and LFA-specific licence conditions.
1.2.2 Food, social and ceremonial
The FSC fishery is licensed under the Aboriginal Communal Fishing Licences Regulations. The fishery is a cultural and sustenance activity undertaken by First Nations and other Aboriginal groups. DFO develops agreements for Aboriginal fishing for FSC purposes. Through these agreements, licences are issued outlining the locations, methods, gear types, timeframes and other conditions for the FSC fishery. The resources fished using an FSC licence are used communally to provide food and support the traditional social and ceremonial activities of the First Nations community or Aboriginal groups.
1.2.3 Educational
Charter boat excursions promoting the lobster fishing experience have been popular with tourists. In the early 2000s, Maritimes Region approved a number of requests for an educational licence to support this. As interest increased, a regional policy was developed (Educational Licence Policy – Lobster / Rock Crab) to ensure consistency in the issuance of these licences and proper management of the activity.
The policy allows for educational licences to be issued with an allocation of up to 3 modified (non-fishable) lobster or rock crab traps that can be set within an area and for a period of time specified in the licence. A handful of grandfathered individuals remain eligible for educational licences that authorize the use of regular (fishable) traps. Regardless of which type of trap is authorized, the licence holder is required to release back to the water any lobsters or other species that may be captured.
Those issued an educational licence are expected to have at least 1 individual on board the vessel with a general knowledge of the fishery and they are expected to promote resource conservation with clients. In this way, the policy promotes tourism and public education and it supports the diversification of economic opportunities within coastal communities. Licences are available to core fish harvesters, charter boat operators and Aboriginal groups. Applications and renewals can be made online through the DFO Maritimes Region website.
1.3 Participants
1.3.1 Commercial
Almost all Maritime Region coastal communities are now involved in the inshore lobster fishery. With few exceptions, all of the approximately 3,000 licences are active during the lobster season, employing approximately 7,500 fishermen. Starting in 1999, in response to the Marshall Response Initiative, Aboriginal access to the commercial fishery has been increased.
Participants are issued a licence that provides access to a specified LFA. The inshore fishing areas consist of LFAs 27 through 38. Current numbers and types of licences by LFA are presented in Table 1. No licences are issued solely for LFA 37. LFA 37 is a small area that is shared by those with a licence for either LFA 36 or LFA 38. When fishing in LFA 37, LFA 36 and 38 licence holders are subject to the conditions of their primary fishing area.
A summer fishery is authorized within the western portion of LFA 38 outside of the regular LFA 38 season. The portion of LFA 38 fished during the summer is referred to as Area 38B (the Disputed Zone). The area is claimed as territorial waters by both Canada and the United States. All fish harvesters holding an LFA 38 licence are eligible to apply for an Area 38B licence. Applications must be made annually. The number of vessels active in the Area 38B fishery has increased in recent years from under 10 to close to 60.
| LFA | Category A | Category B | Communal commercial | Total |
|---|---|---|---|---|
| 27 | 489* | 11 | 14 | 514 |
| 28 | 7 | 0 | 7 | 14 |
| 29 | 53 | 4 | 5 | 62 |
| 30 | 20 | 0 | 0 | 20 |
| 31A | 68 | 3 | 0 | 71 |
| 31B | 70 | 0 | 0 | 70 |
| 32 | 146 | 4 | 6 | 156 |
| 33 | 635 | 25 | 20 | 680 |
| 34 | 943 | 0 | 36 | 979 |
| 35 | 73 | 2 | 19 | 94 |
| 36 | 161 | 1 | 15 | 177 |
| 38 | 119 | 1 | 16 | 136 |
| All | 2,784 | 51 | 138 | 2,973 |
*Includes 33 licences based in Gulf Region. Source: Maritimes Region Licensing Summary Report (LS4041A) and Gulf Region Licensing Office.
In April 2007, the Minister of Fisheries and Oceans announced the Policy for Preserving the Independence of the Inshore Fleet in Canada’s Atlantic Fisheries (PIIFCAF) intended to promote a commercial fishery in Atlantic Canada with a strong independent inshore sector. PIIFCAF created the independent core category as new eligibility criteria for the receipt of new or replacement inshore fishing licences. All heads of core enterprises, including those who have inshore lobster licences issued in their name, are now required to declare their status as independent core, meaning not party to controlling agreements with respect to the inshore fishing licences issued in their name.
Under PIIFCAF, if the department has reason to believe that a licence holder has been categorized as independent core but does not meet the criteria for the independent core category, the licence holder’s categorization is reviewed. If a licence holder is found to not meet the criteria for the independent core category, they will not be eligible to be issued the licence that is subject to the controlling agreement in the following or subsequent years.
Since 1968, licensing policy has allowed 2 lobster harvesters (Category A) to form a partnership. Under a regular partnership, 2 licence holders fish using 1 vessel that is licensed for 150% of the trap limit for a single licence. Both operators must be on board. In 2008, an economically difficult period, a new option became available to licence holders where 2 independent core licence holders were permitted to form a flexible partnership. In a flexible partnership, only 1 of the licence holders was required to be on board the vessel. In 2017, following departmental consideration of flexible partnerships, it was concluded it was important, in support of the independence in owner-operator fisheries, to remove this policy option. Regular partnerships continue to be an option for lobster licence holders.
Independent core licence holders have also been able to acquire, by transfer, a second licence that is stacked with the existing licence in the enterprise. The new licence can be fished with 150% of the trap limit of a single licence. The licence holder must be the operator. The 2 stacked licences can later be unstacked and reissued to other eligible persons, subject to all applicable licensing policy provisions.
In the fall of 2016, policy restrictions were introduced in response to concerns that some of the flexibilities made available to the lobster fishery were being used to circumvent the requirements set out in PIIFCAF by unintentionally supporting licence leasing. There were also concerns that those who formed partnerships mid-season could too easily acquire additional tags and that this was leading to an increase in licence holders fishing above the trap limits.
As a result, 2 restrictions were introduced to:
- eliminate the option of in-season partnering: while partnerships can be dissolved during the season, they now have to be formed before the season opens; and
- limit in-season substitute operator authorizations to instances where the substitute operator is fishing on behalf of the licence holder using the licence holder’s gear and vessel.
The PIIFCAF policy does not apply to communal commercial licences.
1.3.2 Food, social and ceremonial
The Aboriginal Fisheries Strategy of 1992 provides access and allocation of lobster resources to Aboriginal people for their FSC purposes.
1.4 Location of the fishery
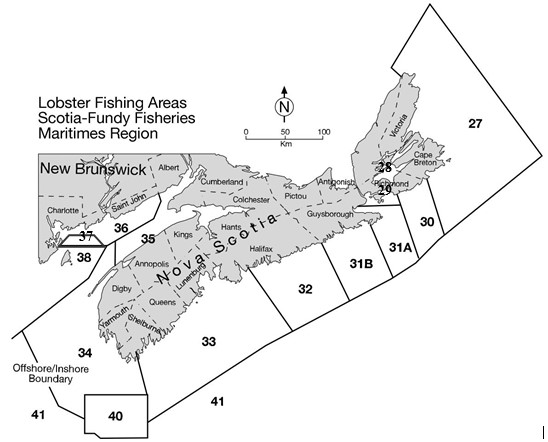
The Maritimes Region of DFO extends north from the maritimes boundary separating Canada from the United States (the Hague Line). The region consists of the entire Bay of Fundy and all Nova Scotian waters along the Atlantic coast to the tip of Cape Breton. A map of LFAs in Maritimes Region is presented in Figure 2. The coordinates for each LFA are specified in Schedule XIII of the Atlantic Fishery Regulations , 1985.
All fishing occurs inside of 50 nautical miles from shore (90 km) and in eastern Nova Scotia most activity is within 15 km of shore. The 50 nautical mile line divides the inshore lobster fishery (LFAs 27-38) from the offshore lobster fishery (LFA 41). The offshore fishery is managed under a separate IFMP.
1.5 Fishery characteristics
The fishery is prosecuted almost entirely by vessels less than 13.7m (45’) length overall (LOA). In LFAs 33 and 34 there is a maximum vessel length of 15.24m (50’). In all other Maritimes Region LFAs, vessels up to 19.8m (65’) LOA may be used.
| LFA | Season | Trap limit1 | Minimum Legal size (mm) | Other measures |
|---|---|---|---|---|
| 27 | May 15 - July 15 | 275 | 82.5 | - |
| 28 | April 30 - June 30 | 250 | 84 | Max. entrance hoop 153mm |
| 29 | April 30 - June 30 | 250 | 84 | Max. entrance hoop 153mm |
| 30 | May 19 - July 20 | 250 | 82.5 | Max. CL-135mm (female) |
| 31A | April 29 - June 30 | 250 | 82.5 | Closed window (female), 114-124 mm |
| 31B | April 19 - June 20 | 250 | 82.5 | V-notching2 |
| 32 | April 19 - June 20 | 250 | 82.5 | V-notching2 |
| 33 | Last Mon. Nov - May 31 | 250 | 82.5 | - |
| 34 | Last Mon. Nov - May 31 | 375/400 | 82.5 | - |
| 35 | Oct 14 - Dec 31 and Last day Feb - July 31 |
300 | 82.5 | - |
| 36 | 2nd Tues Nov - Jan 14 and March 31 - June 29 |
300 | 82.5 | - |
| 37 | 2nd Tues Nov - Jan 14 and March 31 - June 29 |
- | - | - |
| 38 | 2nd Tues Nov – Jun 29 | 375 | 82.5 | - |
| 38B | June 30 – Fri before 2nd Tues Nov | 375 | 82.5 | - |
1 The trap limit is for a Category A licence (full-time). A Category B licence (part-time) is allowed 30% of the limit of a Category A licence and a licence fished under a partnership or stacking arrangement, 150%.
2 V-notching means there is an active program to v-notch female lobsters. There is a possession restriction of v‑notched lobsters in all other LFAs except in LFA 27 and LFA 31A.
Season lengths generally range from 8 weeks to approximately 6 months. Seasons, trap limits and other management measures are presented in Table 2.
1.6 Governance
The IFMP for inshore lobster is governed by a number of pieces of legislation and policies including, but not limited to, those noted below.
- Fisheries Act, 1985
- Atlantic Fishery Regulations (AFR), 1985
- Coastal Fisheries Protection Act, 1985
- Department of Fisheries and Oceans Act, 1985
- Atlantic Fisheries Restructuring Act, 1985
- Fishery (General) Regulations, 1993
- Aboriginal Communal Fishing Licences Regulations, 1993
- Commercial Fisheries Licensing Policy for Eastern Canada, 1996
- Oceans Act, 1996
- Species at Risk Act, 2002
- Sustainable Fisheries Framework: Conservation and Sustainable Use Elements
General regulatory requirements for licensing and registration are found in the Atlantic Fishery Regulations, 1985 (AFR), Part II. Regulations specific to the lobster fishery are further outlined in Part VI of these regulations. The Fishery (General) Regulations provide the basis for lobster licence conditions and the authority to issue variation orders to change minimum legal carapace sizes and season dates from time to time. Changes to season dates are usually due to inclement weather or ice conditions that could potentially affect the safe opening of an LFA. The Fishery (General) Regulations provide the basis for control over incidental catches.
Since the mid-1980s, advisory committees have acted as the primary vehicles through which industry provides advice to government on management measures affecting the fishery. In most LFAs, a representative and an alternate are elected or appointed by licence holders in their port cluster or geographic area. LFA-specific advisory committee meetings are normally co-chaired by DFO representatives within Maritimes Region area offices and a representative from the industry.
In 2007, the Maritimes Region Lobster Advisory Committee was reinstated. This larger body has representation from each LFA and deals with issues that affect all LFAs or groups of LFAs (Bay of Fundy for example). The committee meets as required or at least once annually and produces formal minutes.
Currently there is no single representative body for the lobster industry in Atlantic Canada.
1.7 Approval process
Licence conditions are reviewed and updated annually. Changes are consulted on and explained to the industry at advisory committee meetings, which are held in every LFA in advance of the opening of the season.
Many decisions affecting the day to day operation of the fishery, such opening dates and times, storage of gear, tag replacement policies and enforcement priorities, are approved by DFO area offices. Resource Management within Maritimes Region Regional Headquarters leads on operational matters affecting LFA 35, as LFA 35 overlaps with multiple DFO areas. See Table 3 for more information.
| LFA | Operational lead |
|---|---|
| 27-32 | Eastern Nova Scotia Area Office, Sydney |
| 33-34 | Southwest Nova Scotia Area Office, Yarmouth |
| 35 | Regional Headquarters, Dartmouth |
| 36-38 | Southwest New Brunswick Area Office, St. George |
Operational leads are responsible for scheduling and chairing advisory committee meetings.
Operational and policy decisions affecting multiple LFAs are generally made within DFO Regional Headquarters. DFO senior management and the Minister of Fisheries and Oceans can be involved in decisions with broad implications.
2. Stock assessment and status
2.1 Biological synopsis
2.1.1 Distribution
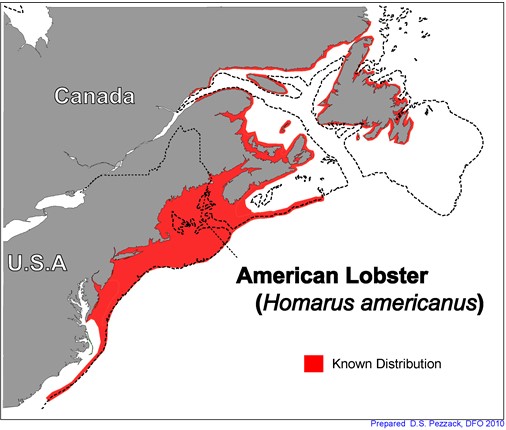
The North American lobster (Homarus americanus) is widely distributed in coastal waters from southern Labrador to Maryland, with the major fisheries concentrated in the Gulf of St. Lawrence and the Gulf of Maine (Figure 3). Lobsters are also found in deeper waters (down to 750 m) in the Gulf of Maine and along the outer edge of the continental shelf from Sable Island to off North Carolina. This deep water distribution is due to the presence of the warm slope water that keeps the slope and deep basins in the Gulf of Maine warm year-round. This warm deep water is not found on the eastern Scotian Shelf, in the Gulf of St Lawrence or off Newfoundland.
Lobsters are a temperate species that require sufficiently warm summer temperatures to grow, produce and hatch their eggs. Juvenile and adult lobsters can exist in waters from less than 0°C to approximately 25°C. Larval lobsters occur in surface waters between 6°C and 25°C, though a minimum temperature of approximately 10-12°C appears to be required for successful development to the settlement phase (stage IV). Larval development is temperature dependent and takes just 10 days at 22-24°C but over 2 months at 10°C.
At the northern limit of their range (northern Newfoundland) summer temperatures remain too cold for ovary and egg development, while at the southern limit of their range (Maryland coastal and off Cape Hatteras along the slope edge) winter temperatures remain too warm and the moulting and reproductive cycles are not synchronized.
Lobsters are found on many different bottom types from mud and sand to cobble and boulders. Young lobsters often seek shelter to avoid predators so are more restricted in their habitat than larger lobsters. Newly settled and juvenile lobsters are most common in complex habitats, such as cobble or gravel bottoms or eel grass. They are also capable of burrowing so can also be found in areas with compact clays or peat reefs. As they grow and become less susceptible to predators they are found in more varied bottoms including open mud and sand bottoms.
2.1.2 Migrations and depth preferences
Adult lobsters make seasonal migrations to shallower waters in summer and deeper waters in winter. Mature lobsters tend to move significantly greater distances than immature animals. Over most of their range, these movements vary from a few km to 20 km. However, in the Gulf of Maine and on the outer continental shelf lobsters undertake long distance migrations of tens to hundreds of km. Tagging studies have shown that at least some of these lobsters return to the same area each year (Campbell 1986; Pezzack and Duggan 1986).
Migrations may be undertaken to optimize the temperature to which lobsters and their eggs are exposed, to avoid shallow water during stormier winter periods and to migrate to areas optimal for hatching eggs and either retention or export of larvae. The triggers for these migrations are not well understood.
Quantitative estimates of exchange rates between areas cannot be given at this time. The mark-recapture approach used in historical studies does not permit discrimination between residences and return migrations after lengthy periods at large, except where intervening recaptures of the same individual lobster are involved. The origin of the animals that are tagged in any 1 location is unknown. Determining the proportion of animals in the population that make long distance movements is confounded by regional differences in the reporting rate of recaptures and the fact that where local fisheries are intense, there is a low probability that legal-sized animals survive to move long distances. The closed season in inshore fisheries also poses a problem in that summer movements would not have been detected in these earlier studies.
2.1.3 Biology
Lobsters in the Maritime Region generally take 8-10 years to reach the legal size of 82.5 mm Carapace Length (CL). At that size they weigh approximately 0.45kg (1 pound) and moult once a year. Larger lobsters moult less often, with a 1.4kg (3 pound) lobster moulting every 2 to 3 years. The largest recorded lobster was 20kg (44lb). The maximum age of lobsters is unknown but based on growth information and long term holding studies it is believed to be in the range of 50 years.
The usual reproductive pattern is for the mature female to mate in late summer while in a soft shell condition immediately after moulting (Figure 4). The male transfers a spermatophore into the seminal receptacle at the base of the female’s tail. Over the next year the eggs develop in the female’s ovaries and during the following summer the eggs are extruded and fertilized, then attach to the underside of the tail. The eggs are then carried for 10-12 months and hatch the following July or August. The larvae spend approximately 4-6 weeks chiefly in the surface waters, although they undergo a daily vertical migration. Halfway through Stage IV they leave the surface waters and actively seek preferential habitat, which is typically characterized by rough gravel or cobble bottoms, though they can also settle in eel grass and in areas with hard clay or mud sediment that is conducive to burrowing. Stage I to IV lobsters feed on a variety of plankton species and predominantly on cladocerans, copepods and crab larvae (Harding 1992).

The young lobsters are vulnerable to many predators, so for the first few years on the bottom they remain in or near their shelter, then spending more and more time outside the shelter as they grow larger (Lavalli and Lawton 1996).
Little is known about the larval distribution along the inshore regions of south and eastern shores of Nova Scotia and Cape Breton as detailed circulation models are lacking. In these areas lobsters are typically more restricted to the coastal bays and it is thought that while larval exchange occurs along the coast, much of the larvae are likely retained in the local areas.
Models of ocean currents for the Gulf of Maine have been used to infer larval lobster distribution (Drinkwater, Hannah et al. 2001). It has been recognized that these models do not include lobster larval behaviours, which may influence the patterns of connectivity. These models indicate strong retention of larvae on Georges Bank. Browns Bank shows weaker retention, with potential exchange of larvae from Browns to German Bank or to the Bay of Fundy. These models show little potential for exchange from Browns Bank to the nearshore areas of southwestern Nova Scotia or the south shore inside the 50m isobath (Drinkwater, Hannah et al. 2001). The models suggest that near shore settlement is from larvae hatched in nearshore areas. There is little exchange of larvae from Browns Bank to coastal Maine but that there is potential for larvae from Maine to settle in the Browns Bank region (Xue, Incze et al. 2008).
Lobster stock structure is not fully understood, but genetic analyses looking at the entire species range observed a north/south separation with a relatively homogeneous population to the north (centered in the Gulf of St. Lawrence) and more heterogeneous populations in the south (centered in the Gulf of Maine and the Mid-Atlantic Bight region (Kenchington et al. 2009). At smaller geographical scales, studies identified areas of low gene flow between some areas, which are likely to be shaped by ocean currents and lobster migration patterns (Benestan et al. 2015).
2.1.4 Reproductive potential
Female lobsters reach maturity at different sizes and ages over their geographic range and this is thought to be controlled principally by local water temperatures (Aiken and Waddy 1986; Waddy and Aiken 1991; Comeau and Savoie 2002), maturing at smaller sizes in regions with warm summer temperatures (Gulf of St. Lawrence, southern New England) and at larger sizes in regions with cooler summer temperatures (Bay of Fundy).
The maturity measure used by scientists is the size at 50% maturity, which is the size at which half of the animals are capable of reproducing. In females this is determined through dissection or examination of the cement glands on the pleopods (swimmerets), evaluation of ovarian maturity or other metrics. Male maturity is not usually estimated due to the fact it requires dissection and because past work indicates that it occurs at a similar or slightly smaller size than the females under the same conditions. For successful mating the male needs to be similar in size or larger than the females. If males are too much larger, then mating success is reduced. Males can mate with numerous females and it has been shown that there are consequences of having too few males as mating success and clutch size is reduced through sperm limitation (Pugh 2014).
Maturity estimates are presently being re-evaluated but the best estimates available at this time are given in Figure 5 (the vertical bars represent what science considers the likely potential range).
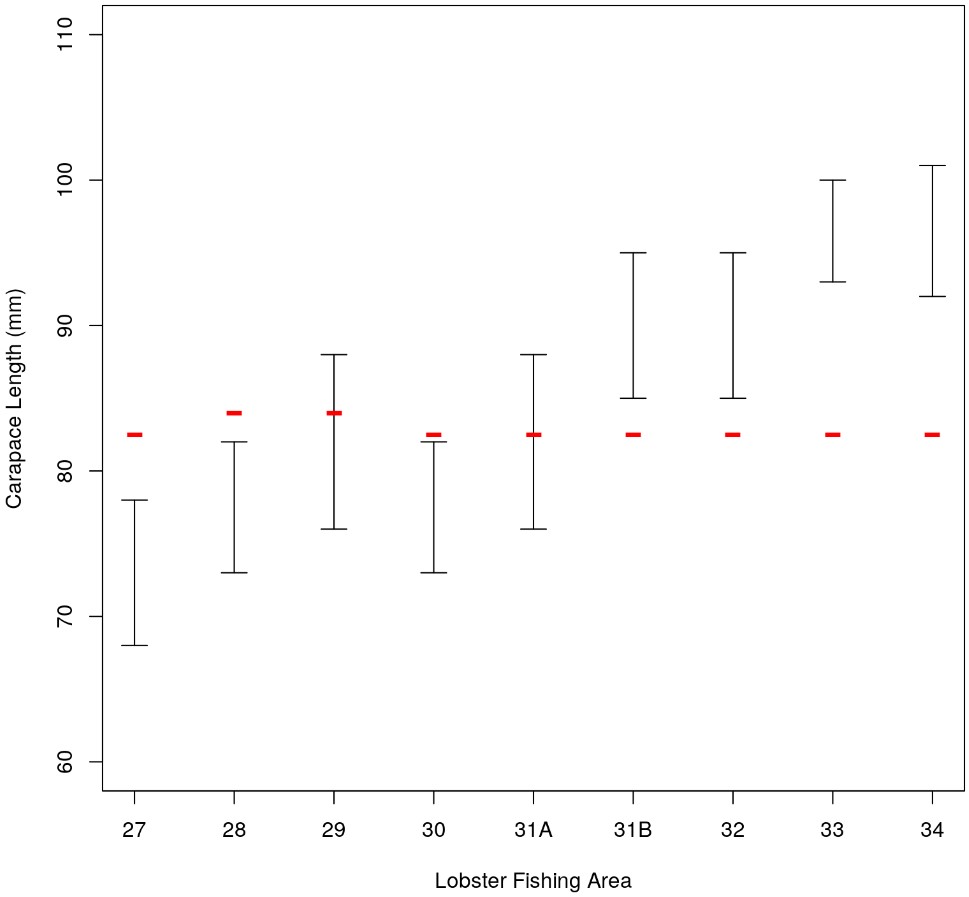
Figure 5 - Description
This chart shows the lobster size at 50% maturity by LFA, where available.
At maturity, female lobsters will usually produce eggs every second year. Based on laboratory studies using ambient inshore Bay of Fundy water temperatures, larger female lobsters appear able to spawn twice without an intervening moult (consecutive spawning) at sizes greater than 120mm CL (Waddy and Aiken 1986) though this size may vary under actual conditions (Campbell 1983; Comeau and Savoie 2001; Comeau and Savoie 2002). Consecutive spawning occurs in 2 forms: successive-year (spawning in 2 successive summers, a moult in the first and fourth years) and alternate-year (spawning in alternate summers). In both types, females often are able to fertilize the 2 successive broods with the sperm from a single insemination (multiple fertilizations). Intermoult (hard-shell) mating has also been observed in laboratory conditions (Waddy and Aiken 1990).
Consecutive spawning and multiple fertilizations enable large lobsters to spawn more frequently over the long term than their smaller counterparts. This combined with the logarithmic relationship between body size and numbers of eggs produced, means that large lobsters have a much greater relative fecundity. The advantages of a population that includes a good mix of sizes including very large sizes is well documented (DFO 2009). For lobsters the advantages include higher egg production and different hatching areas and times. This should result in less susceptibility to short term fluctuations in recruitment levels.
2.1.5 Natural mortality
Natural mortality (M) has been estimated for some nearshore lobster populations and is generally assumed to be between 10-15% for all fully recruited legal sized animals (Fogarty and Idoine 1988) and in most models it is assumed to be the same over time and for all size groups. However in reality this could vary greatly depending upon habitat, predator abundance, time of the year and lobster size.
A constant M is usually chosen using a life history criterion, such as longevity, growth rate and age at maturity. American lobsters have a relatively long life span and slow reproduction and are thus classified by biologists as k-selected with low natural mortality after the larval stage. The uncertainty of the natural mortality is in part due to the lack of an accurate ageing method.
2.2 Ecosystem interactions
2.2.1 Predation on lobsters
During the larval stage, lobsters are eaten by many plankton feeding fish and invertebrates. During the settling stages as the lobster moves from the plankton to the bottom to find shelter they are preyed upon by many small fish, such as cunners, sculpins and invertebrates like small crabs. During their first 3 to 4 years, lobsters remain in or near their chosen shelter to avoid predation from visual predators including many fish species, such as sculpin, cunners, skate, crabs and other opportunistic feeders (Lavalli and Lawton 1996). There is evidence that natural mortality varies inversely with body size with larger lobsters safer from all but the largest predators; however all lobsters are most vulnerable immediately following the moult when their shell is still soft. Animals that have been identified as predators on lobsters in some areas include sculpins, skates, cod, spiny dogfish, sea ravens, wolfish, Cancer crabs and striped bass. Mortality levels on the inshore lobster stocks have not been quantified. Anecdotal information indicates that seals are a predator on lobster; however there is no scientific data on the prevalence or level at which it may occur.
2.2.2 Food sources for lobsters
Lobsters are both active and opportunistic feeders. Lobsters are active predators of crabs, clams, mussels, scallop, various gastropods, fish, marine worms, sea urchins, starfish and small amounts of marine plants. They will also feed on an opportunistic basis on dead fish and other organisms (Carter and Steele 1982; Elner and Campbell 1987; Gendron, Fradette et al. 2001).
2.2.3 Species interactions and interactions with other fisheries
Other Crustaceans
Lobsters co-occur with other crustaceans of commercial value, most notably Jonah crab (Cancer borealis), rock crab (Cancer irroratus) and deep-sea red crab (Chaceon quinquedens). While Jonah and rock crab can co-occur in shallower waters and are caught either as a directed fishery or as a bycatch of lobster fisheries, red crab generally exist in greater water depths than commercial lobster distributions and rarely make up a significant portion of bycatch.
Rock and Jonah crab can be retained for bait (in specified LFAs) and must be recorded in the lobster log, though the level of recording appears to be low in some areas.
The commercial rock and Jonah crab fisheries use traps similar to the lobster fishery and have the potential for lobster bycatch. While the bycatch cannot be retained, there is the potential for some damage to lobsters, particularly during the moulting period.
Other fisheries
While other fisheries cannot legally land lobsters, there is potential interaction with bottom mobile gear. Observer data indicates their presence in the catch of scallop, trawl and gill nets set on the bottom. There is little quantitative information available as to the level of capture or survival of lobsters returned to the water by different gear types. Observer data from the inshore scallop fishery in Scallop Fishing Area (SFA) 29 showed that the number of lobsters caught was very small (<0.1%) compared to the number of lobsters caught by the directed trap fishery in LFA 34 (DFO. 2018/044). Of the lobsters caught, the majority were alive and uninjured. Levels of damage or mortality on the bottom are unknown.
Interaction with whales, turtles and seals
Right whales are present on the Scotian Shelf in summer and the mouth of the Bay of Fundy and Roseway Basin has been identified as summer feeding habitat. Other whale species present in coastal waters are humpback, pilot, various dolphin species, minke and fin whales. While there is potential for interaction between lobster gear and whales, the inshore lobster fishing seasons do not often overlap with times of known whale concentrations. However, little is known of whale migration routes between the summer and winter grounds.
Industry in some LFAs has adopted a set of protocols to further reduce the potential for interaction between whales and fishing gear.
There is also potential for interaction with sea turtles, though reported interactions between whales/turtles and lobster gear are rare.
Seals are known to eat lobster bait and can cause damage to traps.
2.2.4 Gear impacts
A DFO national science advisory process to examine the potential impacts of traps and other gears on marine habitats and communities was held in January 2010. A Science Advisory Report from the workshop is available (DFO 2010/003) and titled “Potential impacts of fishing gears (excluding mobile bottom-contacting gears) on marine habitats and communities.”
Report conclusions
The potential impact of traps on marine habitats is dependent on a variety of factors, including:
- Characteristics of the bottom where they are set (sediment type, relief and depth);
- Weight, size and construction material of traps;
- Retrieval methods and sea state, weather, tides, currents;
- Type of rope (floatlines are less likely to entangle bottom structures);
- Soak time;
- Use of anchors or weights; and
- String configuration (e.g. length) can affect degree of entanglement on bottom.
An assessment of the impact on marine habitats of lobster traps in particular has not been conducted, but numerous reviews of trap impacts have concluded that the potential for impact is small, though they agree that it could increase with density and frequency of the traps being hauled (Eno, Macdonald et al. 2001; Morgan and Chuenpagdee 2003; Chiarella, Stevenson et al. 2005).
The study by Eno et al. (1996) suggests that the direct contact of fishing gears with fauna may not be the primary cause of mortality and the frequency and intensity of physical contact is more likely to be important.
The trap footprint on the sea bottom is small and traps are weighted to restrict movement caused by currents. The area affected is thus limited primarily to the trap footprint area (< 0.62 m²) and the area of disturbance as the trap is hauled. Proper hauling results in minimal dragging of the trap along the bottom, though greater movement can occur especially in rough weather.
The type of bottom fished is varied (e.g., cobble, ledge, mud, sand, gravel) and includes some high energy areas with large natural sediment movements. The impact of traps on the bottom will vary depending on the bottom type where they are deployed and the spatial extent of deployment.
2.2.5 Gear loss and ghost fishing
Gear loss has not been quantified regularly but is believed to be low as gear is valuable and efforts are made to recover lost traps through grappling. Lost gear would remain intact for considerable periods of time unless disturbed by weather or mobile gear. However, all traps in every LFA are fitted with biodegradable panels, which will open after a period of time in order to mitigate ghost fishing.
2.2.6 Non retained bycatch
Pressure from the inshore lobster fishery in the Maritimes Region is not known to exert a direct impact upon ecological system structure or functioning (including specific prey or predator species) although no specific studies have been conducted. All non-approved species must be immediately returned to the water. Survival of returned bycatch has not been measured but is believed to be high for most invertebrates; however could be low for fish.
Bycatch species include: rock and Jonah crab; sea urchins; whelks; and various fish species, including cusk, cod and sculpins. A survey of bycatch in LFAs where data is available is reported during stock assessments. A broader catch monitoring initiative began in fall 2018, which will provide more robust bycatch estimates.
2.2.7 Environment interactions
Water temperature is a controlling factor in growth, reproduction, movements and distribution of lobsters. Temperature also affects lobster catchability (the likelihood that they will enter traps) (Drinkwater, et al. 2006). Wind and water currents influence larval distribution and movement and temperature controls larval duration.
The net effects of climate change on lobster populations are difficult to predict. Areas will be influenced both by local changes and changes in large scale ocean conditions, such as the near shore Nova Scotia Current and the Labrador Current along the shelf break. Cooling conditions could reduce larval survival, growth and increase the size at maturity. Warming conditions could increase larval survival, growth and decrease the size at maturity. Warming conditions could also result in changes in predator mix and the potential for increased disease.
2.3 Stock assessment
Lobster assessments are conducted periodically through the Regional Assessment Process (RAP) coordinated by the Canadian Science Advisory Secretariat (CSAS). The target frequency for full assessments for each LFA is every 5 years. The assessments are peer reviewed and information is made public through publications available online in the form of Stock Advisory Reports (SAR), Research Documents and meeting proceedings (Table 4).
Stock structure has not been fully described. The current hypothesis is that the lobster is a stock complex comprised of several sub-populations that are linked through larval drift and adult migration patterns. In 2011, a cluster analysis of historical landings from 1947 onward indicated that there were 5 groupings of LFAs in the inshore with similar patterns in landings: LFA 27, LFAs 28-32, LFA 33, LFA 34 and LFAs 35-38 (Tremblay et all 2011). For a period of time, stock assessments were completed according to these groupings, with sub-analyses completed for individual LFAs. In 2018, a framework assessment was held for LFAs 27-33. A recommendation from this later framework was that the LFAs be examined separately because each is managed separately and because several possess unique conservation measures that may affect trends in stock status indicators. Furthermore, assessing stocks independently was considered to be a more precautionary approach.
| LFA | Science advisory report (SAR) / Stock status report (SSR) | Research document |
|---|---|---|
| 27-30 | 1996/116 1998/C3-59 2004/032 2011/064 2015/017 2016/025 2017/026 2018/030 2020/026 |
1996/141 1998/124 2004/021 2012/022 2020/017 |
| 31-32 | 1996/117 1998/C3-60 2004/033 2011/064 2015/017 2016/025 2017/026 2018/030 2020/026 |
1991/21 2004/038 2012/022 2020/017 |
| 33 | 1996/117 1998/C3-60 2004/038 2011/064 2015/017 2016/025 2017/026 2018/030 2020/002 |
2004/071 2012/022 2020/017 |
| 34 | 1996/118 1998/C3-62 2001/C3-62 2006/024 2013/024 2014/036 2015/029 2016/037 2017/038 2021/015 |
1999/032 2001/156 2006/010 2013/078 Anticipated in 2022 |
| 35-38 | 1996/119 1998/C3-61 2001/C3-61 2007/037 2013/023 2014/047 2015/030 2017/022 2017/039 2018/049 2021/020 |
1999/031 2001/93 2001/94 2007/41 2013/078 Anticipated in 2022 |
2.4 Precautionary approach
2.4.1 Policy requirements
In 2009, DFO adopted A Fishery Decision-Making Framework Incorporating the Precautionary Approach (PA Policy) as a component of the Sustainable Fisheries Framework. The PA in fisheries management is, in general, about being cautious when scientific knowledge is uncertain, unreliable or inadequate and not using the absence of adequate scientific information as a reason to postpone or fail to take action to avoid serious harm to the resource. This approach is widely accepted as an essential part of sustainable fisheries management. The primary components of the PA framework are stock status indicators and reference points; a harvest strategy, including removal references (the maximum acceptable removal rates for the stock); harvest control rules; and explicit consideration of uncertainty and risk.
2.4.2 Preliminary approach and data sources
There are currently no working population models for Canadian lobster with which to set model-based reference points. An indicator-based approach to setting reference points across all of the inshore LFAs has therefore been adopted.
In 2012, landings-based reference points were adopted for each of the LFAs (DFO 2012). Due to the input-based management of this fishery and the long-term consistency of management measures, landings were assumed a reasonable proxy for biomass, at least in the short term. At the time, landings were also the only indicator of lobster biomass with a significant time series.
Given the uncertainties and caveats associated with the use of landings, other primary and contextual indicators were added to the stock assessment framework for each LFA, based on available data sources. These other indicators could both change the perception of stock status and inform the type of management response to a stock should it enter the Cautious Zone.
Framework assessments were completed for LFAs 27-33 and LFAs 34-38 in 2018 and 2019, respectively. Both frameworks and subsequent stock assessments resulted in a new set of stock status indicators and reference points for these LFAs.
2.4.3 Indicators and reference points: LFAs 27-33
Primary indicator
The primary stock status indicator for LFAs 27-33 is the commercial catch rate. The time series is made up of 2 data sources: the first is a voluntary log book, which began in the 1980s and continued until 2013 in some LFAs; and the second is the current, commercial log book, which is now mandatory and has been mandatory in some LFAs since the mid-2000s. The 2 data sources are treated as a single, continuous time series.
The combined catch rate data series from 1990 to 2016 was used to define the upper stock reference (USR) and limit reference point (LRP) for each LFA. This time period represents periods of both low and high productivity for lobster and it covers approximately 2 generations. The median of this time series is considered to be a proxy for biomass at maximum sustainable yield (BMSY). Consistent with guidance in the PA Policy, the USR and LRP are set at 80% and 40% of the BMSY proxy.
The metric used to compare the commercial catch rate to the USR and LRP is a 3-year running median. A running median was chosen over an average as the median dampens the impact of anomalous years, which may occur due to factors other than changes in abundance.
| LFA | BMSY proxy: Median of the commercial catch rate 1990-2016 | USR: 80% of the BMSY proxy | LRP: 40% of the BMSY proxy |
|---|---|---|---|
| 27 | 0.34 | 0.27 | 0.14 |
| 28 | 0.31 | 0.25 | 0.12 |
| 29 | 0.28 | 0.22 | 0.11 |
| 30 | 0.7 | 0.56 | 0.28 |
| 31A | 0.39 | 0.31 | 0.16 |
| 31B | 0.40 | 0.32 | 0.16 |
| 32 | 0.36 | 0.29 | 0.14 |
| 33 | 0.35 | 0.28 | 0.14 |
Secondary indicators
There are 3 secondary stock status indicators for LFAs 27-33: landings (kg) and effort (numbers of trap hauls) from the commercial log books and catch rates of sub-legal (70 to <82.5 mm) and legal-sized (≥82.5 mm) lobsters from the recruitment trap survey (kg per trap haul).Footnote 1 Commercial landings are related to population abundance, as fishery controls are based on inputs (effort) rather than outputs (total allowable catches). Fishing effort can be a proxy for fishing pressure and is an important indicator of fishery performance. The recruitment trap survey provides the best information on abundance of undersized lobsters and it is the only data on abundance that is collected in a standardized manner.
Secondary indicators represent important time series trends that are tracked individually. No reference points are defined for these.
Contextual indicators
Contextual indicators describe biological processes that influence production, changes in the ecosystem and changes in the performance of the fishery. They include indices of berried female lobsters, indices of new recruits, size-based indices, idealized reproductive potential, biomass recruits, proportion of new recruits, proportion of mature lobsters and bottom temperature. Specific reference levels are not applied to contextual indicators.
The contextual indicators are included in full stock assessments. They are presented in a multivariate analysis, with a matrix plot showing trends over time.
Indicator of exploitation
A Continuous Change in Ratio (CCIR) method is used to estimate exploitation. Change in ratio methods provide estimates of population parameters based on the changes in observed proportions of components within the population, in this case lobsters just below the minimum legal size (a reference, non-exploited component) and new recruits to the fishery (an exploited component). The premise of this method is that the proportion of reference individuals within the population will increase with the cumulative removals from the exploitable component.
Data for the CCIR analysis is drawn from the recruitment trap survey from the period of 2000 to 2016 (with some variation among LFAs). Since this is a period of increased productivity, it has been assumed that the estimated maximum exploitation rate from the time period is likely below the rate that would have negative impacts on the lobster stocks or, in other words, below fishing at maximum sustainable yield. The removal reference (RR) for each LFA is defined as the 75th quantile of the posterior distribution of the maximum modeled CCIR exploitation rate.
| LFA | 75th quantile of the posterior distribution of the maximum estimated CCIR exploitation rate, 2000-2016 |
|---|---|
| 27 | 0.84 |
| 28 | Not developed |
| 29 | 0.94 |
| 30 | 0.77 |
| 31A | 0.89 |
| 31B | 0.82 |
| 32 | 0.84 |
| 33 | 0.81 |
2.4.4 Indicators and reference points: LFA 34
Primary indicator
In LFA 34, the primary indicator for stock status, which describes the time-series trends relative to reference points, is commercial biomass from 4 fishery-independent surveys: the DFO Summer Research Vessel (RV) survey; the Northeast Fisheries Science Center (NEFSC) bottom trawl spring and fall surveys; and the Inshore Lobster Trawl Survey (ILTS).
Stock status will be a combined result across survey indices, relative to the respective Limit Reference Indicator (LRI) and Upper Stock Indicators (USIs). For each index, an analysis was conducted to identify the high productivity period. The median commercial biomass of this time period was applied as a proxy for carrying capacity, K, with BMSY estimated as K/2. Consistent with guidance in the PA Policy, the USR is set at 80% of the BMSY proxy. The LRI was defined as the median of the 5 lowest non-zero biomasses from which the stock has rebuilt as a proxy for Brecover.
| Survey | Upper Stock Indicator (USI): | Limit Reference Indicator (LRI) |
|---|---|---|
| DFO Summer Research Vessel | 686 | 107 |
| NEFSC Spring | 1,539 | 80.1 |
| NEFSC Fall | 3,232 | 223 |
| Inshore Lobster Trawl Survey | 4,574 | 1,975 |
Table 8: Definition of the PA Policy stock status zones in LFA 34
Healthy zone
Reference points: USR
- 2 or more survey biomasses are above their respective USIs
Cautious zone
Reference points:
- 3 or more survey biomasses are below their respective USI and above their respective LRI; OR
- 2 survey biomasses are above their respective USIs and 2 survey biomass are below their respective LRIs; OR
- 1 survey biomass above its respective USI, 1 survey biomass below its respective LRI, and 2 survey biomasses between their respective USIs and LRIs
Critical zone
Reference points: LRP
- 2 or more survey biomasses are below their respective LRIs
Secondary indicators
The secondary indicators for LFA 34 are the modelled Catch Per Unit Effort (CPUE) estimates, landings (kg) and effort (numbers of trap hauls) from the commercial log books, recruit abundance time series from various sources including the Scallop and RV surveys (DFO, NEFSC Spring and Fall), as well as standardized recruitment traps
Secondary indicators represent important time series trends that are tracked individually. No reference points are defined for these.
Contextual indicators
Contextual indicators describe biological processes that influence production, changes in the ecosystem and changes in the performance of the fishery. The contextual indicators for LFA 34 are total lobster abundance, predator abundance and biomass, bottom temperature, design-weighted area occupied, and indices of patchiness. Specific reference levels are not applied to contextual indicators.
The contextual indicators are included in full stock assessments. They are presented in a multivariate analysis, with a matrix plot showing trends over time.
Indicator of exploitation
Relative fishing mortality (relF) uses the survey commercial biomass estimates and landings to show the changes in removals relative to the 4 survey indices.
| Survey | Removal Indicator when stock status is above USI |
|---|---|
| DFO Summer Research Vessel | 0.979 |
| NEFSC Spring | 0.9285 |
| NEFSC Fall | 5.16 |
| Inshore Lobster Trawl Survey | 0.849 |
The removal reference (RR) will be a combined result of the removal indicators. Fishing pressure will have exceeded the removal reference when 3 or more of the removal indicators have been exceeded for their respective stock status zone.
2.4.5 Indicators and reference points: LFAs 35-38
Primary indicator
The primary stock status indicator for LFAs 35, 36 and 38 is the LFA specific commercial catch rate. The time series of commercial catch rates are short, from 2006-2018 for LFA 35 and 2005-2018 for LFAs 36 and 38. These time periods represent periods of both low and high productivity for lobster.
The catch rate data series was used to define the upper stock reference (USR) and limit reference point (LRP) for each LFA. Using the 13 and 14 years of commercial catch rates, an analysis was conducted to identify the high productivity period. This time period was applied as a proxy for carrying capacity, K with BMSY estimated as K/2. Consistent with guidance in the PA Policy, the USR and LRP are set at 80% and 40% of the BMSY proxy.
The metric used to compare the commercial catch rate to the USR and LRP is a 3-year running median. A running median was chosen over an average as the median dampens the impact of anomalous years, which may occur due to factors other than changes in abundance.
| LFA | USR: 80% of the BMSY proxy | LRP: 40% of the BMSY proxy |
|---|---|---|
| 35 | 1.62 | 0.81 |
| 36 | 1.36 | 0.68 |
| 38 | 1.92 | 0.96 |
Secondary indicators
There are 6 secondary stock status indicators for LFAs 35-38: landings (kg) and effort (numbers of trap hauls) from the commercial log books; recruit-abundance time series from the DFO Scallop (LFAs 35 and 36 only) and Summer Research Vessel (RV) surveys; commercial biomass estimates from the DFO Summer RV Survey; and relative fishing mortality.
Secondary indicators represent important time series trends that are tracked individually. No reference points are defined for these.
Contextual indicators
Contextual indicators describe biological processes that influence production, changes in the ecosystem and changes in the performance of the fishery. The contextual indicators for LFAs 35-38 are total lobster abundance, predator abundance and biomass, bottom temperature, design-weighted area occupied, and indices of patchiness. Specific reference levels are not applied to contextual indicators.
The contextual indicators are included in full stock assessments. They are presented in a multivariate analysis, with a matrix plot showing trends over time.
Indicator of exploitation
There are currently no analyses that have provided suitable estimates of exploitation within LFAs 35-38; as such RRs cannot be identified at this time.
2.5 Research plan
Part of DFO’s vision is to advance sustainable aquatic ecosystems while fostering economic prosperity across maritime sectors and fisheries. The ability to provide sound advice on stock status for the management of our natural resources is largely dependent on the collaborative science programs conducted by DFO, fishing associations and academia.
DFO Science collects and assimilates the pertinent biological and fisheries information to develop and implement scientific analysis for the provision of advice to directly support decision-making and policy program delivery. In order to accomplish these goals DFO-Science conducts population monitoring programs and scientific research to develop assessments of stock status, which are used to provide advice to management for supporting the sustainable development of the resource. Quality monitoring and research programs ensure that decisions are based on the best knowledge available.
Monitoring and research are important components for management of the lobster fishery, with a long history of research results being used as primary inputs into management decisions. This monitoring, assessment and research plan (Table 11) summarizes the priorities for investment in monitoring and research in the inshore lobster fisheries for the period of 2017 to 2022.
| Strategic objectives | Themes | Monitoring, assessment and research priorities (i.e.: strategic monitoring and research needs) |
|---|---|---|
| Maintain and improve the knowledge base for the regional lobster stocks. |
Perform functions and activities critical to inform stock status. Foster and maintain monitoring and research activities in collaboration with industry stakeholders and academia. |
Collect biological and stock indicators with different long-term monitoring programs:
|
| Provision of peer reviewed science advice and scientific publications |
Develop and improve techniques for assessing stock status Investigate issues or address questions raised by clients. |
|
| Ensuring ongoing sustainability of the fishery | Continue to improve the precautionary approach framework for the lobster fishery. |
|
| Research on population dynamics and impacts of climate changes | Continue to improve on scientific knowledge (biological and physical) that can be applied to better assess the stocks. |
|
3. Social, cultural and economic importance of the fishery
3.1 Overview
The lobster fisheryFootnote 2 has been the backbone of the inshore commercial fishery in the Maritimes Region over the past two decades. In recent years, the fishery generated direct fishing employment for approximately 7,500 people and provided important economic benefits in coastal communities throughout the region, including Indigenous communities. In 2016, lobster was landed at more than 300 communities in the Maritimes Region, providing for a broad distribution of associated revenues and profits for licence holders and wages for crew.
With its long history in the region, inshore lobster represents a link for current fishing activity with the traditional social and economic life in rural Nova Scotia and New Brunswick. As an owner-operator fishery, lobster is an important contributor to the independence of the inshore fleet in Canada’s Atlantic fisheries. Inshore lobster is a key component of fisheries operations for the region’s communal commercial licence holders.
The inshore lobster fishery generates significant indirect economic benefits in the region through investment in inputs, such as vessel construction and maintenance, gear manufacture and maintenance, fuel and bait. The fishery generates significant induced economic benefits in the region as employment incomes and fishing business profits are spent and invested locally. Important economic benefits are also generated through the additional business activity that takes place post-landing, such as product handling and packing, transportation, processing, marketing and exporting. All of these activities generate additional profits and employment in Nova Scotia and New Brunswick.
Lobster harvesting is predominantly an occupation held by men, although there are a number of female harvesters. According to 2016 Census information, the gender breakdown in Nova Scotia and New Brunswick for people working in the fish harvesting sectorFootnote 3 (all species) was 87.6% male and 12.4% female. The gender breakdown in Nova Scotia and New Brunswick in the fish processing sectorFootnote 4 (all species) was 52.6% male and 47.4% female.
Lobster harvested by over 2,700 inshore lobster vessels in the 2015-16 season generated revenues of $876 million for commercial and communal commercial licence holders, a record for the region. The landings of inshore lobster in 2015-2016 also represented a regional record at 60,819 tonnes or just over 134 million pounds. Preliminary figures for the 2016-17 season suggest that landings and landed value were 2nd all-time highs for the region.
The Maritimes Region lobster fishery accounted for 61% of Canadian lobster landings in 2016 and was, therefore, an important supplier for Canadian exporters. Canadian exports of lobster reached a record $2.15 billion in 2016.
3.2 Lobster and the Atlantic fishery
In 2016, commercial fishery landed value for DFO Atlantic regions (Maritimes, Gulf, Quebec and Newfoundland & Labrador) totaled $3.0 billion. Maritimes Region accounted for 46% of this total and lobster accounted for 44% of the total landed value across all Atlantic regions. Within DFO Maritimes Region, lobster accounted for approximately 62% of the total landed value.
Figure 6 shows 2016 commercial landed value by DFO region and major species. Maritimes Region lobster landed value was approximately $833 million (similarly in 2017, data preliminary) and was the dominant value species in the region. Lobster was also the main value species in DFO Gulf Region.
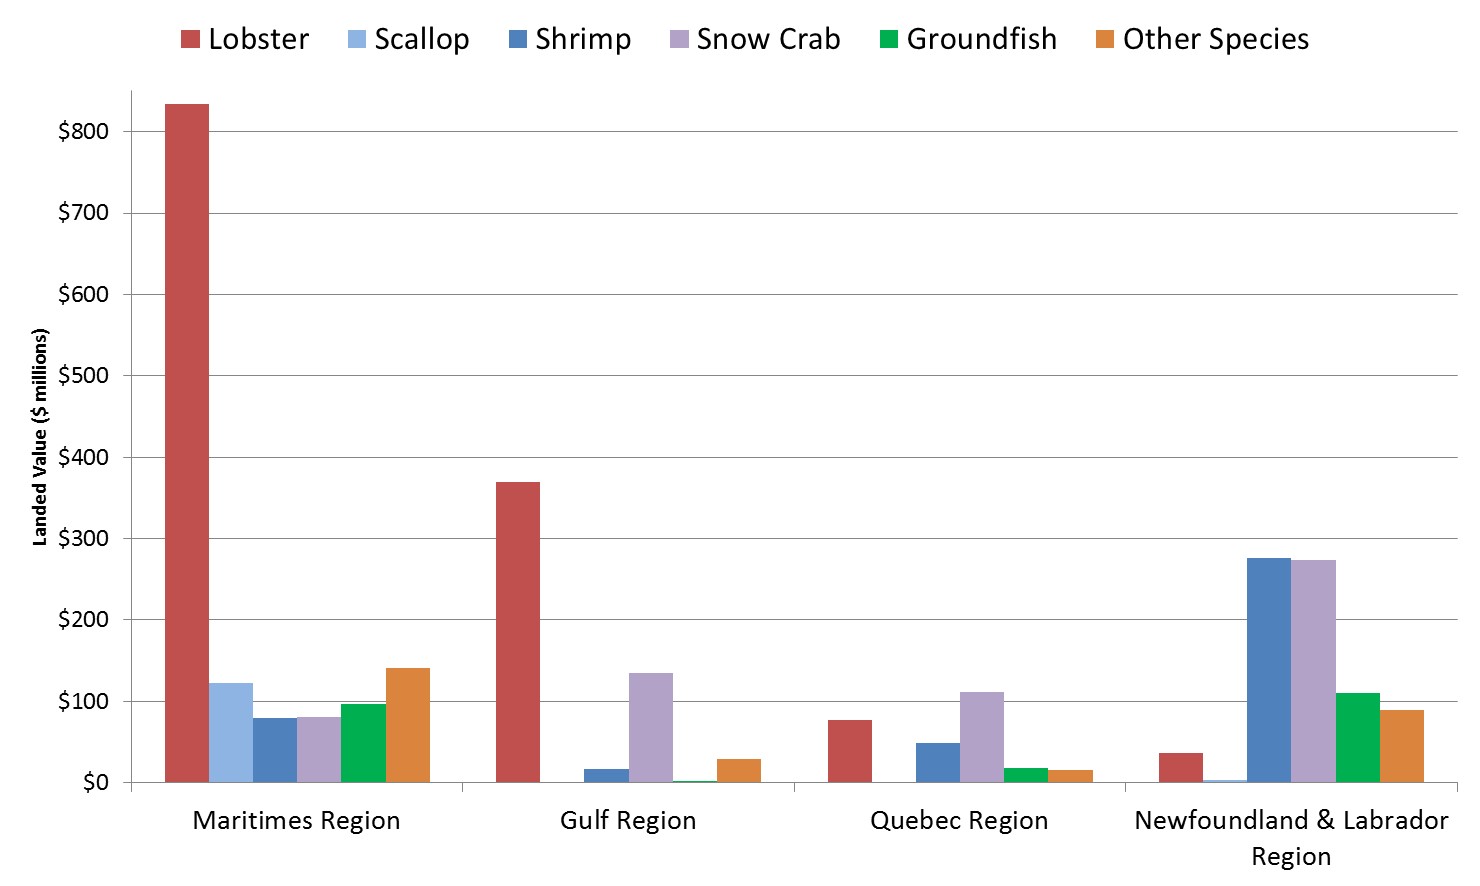
Figure 6: Landed value by major species by DFO Atlantic region (2016) - Description
This chart shows the landed value of major species by DFO Atlantic region.
| - | Maritimes Region | Gulf Region | Quebec Region | Newfoundland & Labrador Region | Atlantic Total | Pacific Region | Canada Total |
|---|---|---|---|---|---|---|---|
| Lobster | $833,536 | $369,033 | $76,303 | $36,593 | $1,315,465 | - | $1,315,465 |
| Scallop | $122,768 | $1,085 | $0 | $3,528 | $127,381 | - | - |
| Shrimp | $79,063 | $16,307 | $48,889 | $276,064 | $420,323 | - | - |
| Snow crab | $80,303 | $134,966 | $111,222 | $274,011 | $600,502 | - | - |
| Groundfish | $96,191 | $2,249 | $18,038 | $110,393 | $226,871 | - | - |
| Other species | $141,216 | $28,731 | $15,939 | $88,933 | $274,819 | - | - |
| TOTAL | $1,353,077 | $552,371 | $270,391 | $789,522 | $2,965,361 | $351,670 | $3,317,031 |
3.3 Inshore lobster in DFO Maritimes Region
3.3.1 Regional landed weight and valueFootnote 5
Lobster landings (as measured as landed weight) in the inshore lobster fishery in Maritimes Region rose almost uniformly year after year over the 1995-96 through 2015-16 seasons, increasing from just under 15,000 tonnes in 1995-96 to a record 60,819 tonnes in 2015-16. Preliminary landings for 2016-17 of just under 53,000 tonnes show a decline from the previous season’s peak, but still similar to the high landings levels of 2013-14 and 2014-15, which were in excess of 51,000 tonnes. From a landings perspective, 2016-17 is expected to be 2nd all-time for Maritimes Region’s inshore lobster fishery though preliminary data for 2017-18 suggest it will be above 2016-17.
The landings increase during the 2008-09 through 2012-13 period coincided with the aftermath of the global financial crisis, which saw several years of lower-than-average prices due to increased supply, a weak market and a strong Canadian dollar. By 2014-15, the market improved and the Canadian dollar weakened against the US dollar, increasing average landed prices and revenues to lobster licence holders in alignment with the historically high landings levels.
Inshore lobster nominal landed value averaged about $350 million over the 15 year period through the 2012-13 season. In just 3 years following the 2012-13 season, inshore lobster landed value more than doubled, rising dramatically from $383 million to $876 million. Preliminary figures for the 2016-17 season suggest a landed value of around $833 million and 2nd all-time high for the region.
Figure 7 shows Maritimes Region inshore lobster landed weight and landed value by season from 1995-96 to 2016-17 (preliminary). See Appendix 3 for the annual figures.

Figure 7: Maritimes Region inshore lobster landed weight and landed value - Description
This chart shows Maritimes Region inshore lobster landed weight and landed value for the period 1996 to 2017, with the latest years’ data as preliminary.
| Tonnes | Maritimes (t) | Maritimes |
|---|---|---|
| - | Maritimes Region Inshore Landed Weight (t) | Maritimes Region Inshore Landed Value ($M) |
| 1996-97 | 16,215 | $186.6 |
| 1997-98 | 18,400 | $209.6 |
| 1998-99 | 19,736 | $260.7 |
| 1999-00 | 20,554 | $288.2 |
| 2000-01 | 24,369 | $346.1 |
| 2001-02 | 27,549 | $334.8 |
| 2002-03 | 26,020 | $390.6 |
| 2003-04 | 26,254 | $364.8 |
| 2004-05 | 27,231 | $380.4 |
| 2005-06 | 28,523 | $387.5 |
| 2006-07 | 28,888 | $364.7 |
| 2007-08 | 31,518 | $385.7 |
| 2008-09 | 32,274 | $322.3 |
| 2009-10 | 35,056 | $317.4 |
| 2010-11 | 37,419 | $375.4 |
| 2011-12 | 43,714 | $420.0 |
| 2012-13 | 44,029 | $382.6 |
| 2013-14 | 51,408 | $565.0 |
| 2014-15p | 51,965 | $660.1 |
| 2015-16p | 60,819 | $876.0 |
| 2016-17p | 52,852 | $833.0 |
3.3.2 Landed weight and value by LFA
In Maritimes Region, inshore lobster landings (i.e. landed weight) vary by LFA based on factors, such as the relative resource abundance, the length of the fishing season and the number of licences. LFA 34 has the greatest number of inshore licences (979) and relatively high resource abundance, generating the highest overall lobster landings in the region.
Figure 8 shows the relative landings by LFA in Maritimes RegionFootnote 6, as well as the landings trends within each LFA from the 2007-08 season through to the 2016-17 season (data is preliminary).
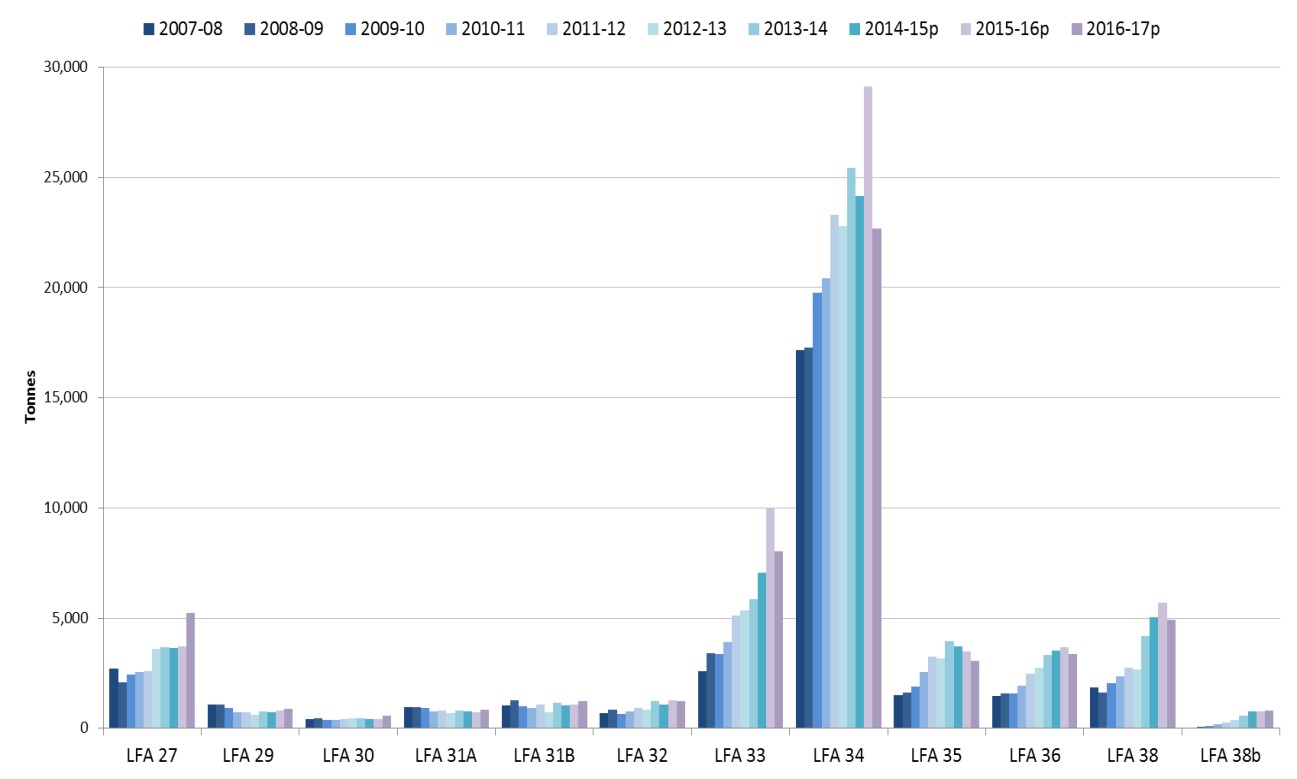
Figure 8: Maritimes Region inshore lobster landed weight by LFA - Description
| - | LFA 27 | LFA 29 | LFA 30 | LFA 31A | LFA 31B | LFA 32 | LFA 33 | LFA 34 | LFA 35 | LFA 36 | LFA 38 | LFA 38b |
|---|---|---|---|---|---|---|---|---|---|---|---|---|
| 1996-97 | 1,290 | 40 | 80 | 50 | 98 | 247 | 1,783 | 10,645 | 738 | 681 | 551 | 0 |
| 1997-98 | 1,263 | 52 | 70 | 72 | 128 | 309 | 2,103 | 12,065 | 837 | 788 | 701 | 0 |
| 1998-99 | 1,332 | 50 | 70 | 78 | 139 | 316 | 2,129 | 13,062 | 920 | 826 | 809 | 0 |
| 1999-00 | 1,397 | 54 | 54 | 85 | 212 | 448 | 2,241 | 13,444 | 910 | 878 | 826 | 0 |
| 2000-01 | 1,716 | 66 | 98 | 102 | 204 | 433 | 2,460 | 16,190 | 1,074 | 1,032 | 989 | 0 |
| 2001-02 | 1,292 | 57 | 78 | 103 | 210 | 358 | 2,764 | 19,043 | 1,218 | 1,261 | 1,145 | 12 |
| 2002-03 | 1,540 | 125 | 73 | 152 | 279 | 389 | 2,320 | 17,613 | 1,234 | 1,155 | 1,073 | 54 |
| 2003-04 | 1,735 | 190 | 84 | 213 | 305 | 289 | 1,955 | 17,801 | 1,337 | 1,169 | 1,133 | 35 |
| 2004-05 | 1,919 | 402 | 112 | 426 | 498 | 403 | 2,519 | 17,250 | 1,172 | 1,143 | 1,363 | 15 |
| 2005-06 | 1,848 | 658 | 187 | 672 | 825 | 602 | 2,555 | 17,009 | 1,234 | 1,295 | 1,595 | 32 |
| 2006-07 | 1,914 | 792 | 216 | 827 | 1,061 | 631 | 3,033 | 16,583 | 1,191 | 1,138 | 1,413 | 80 |
| 2007-08 | 2,711 | 1,076 | 413 | 962 | 1,031 | 704 | 2,598 | 17,143 | 1,488 | 1,477 | 1,855 | 47 |
| 2008-09 | 2,072 | 1,088 | 452 | 956 | 1,270 | 829 | 3,401 | 17,262 | 1,617 | 1,596 | 1,638 | 79 |
| 2009-10 | 2,424 | 914 | 371 | 911 | 1,001 | 657 | 3,377 | 19,749 | 1,898 | 1,594 | 2,035 | 113 |
| 2010-11 | 2,542 | 727 | 383 | 757 | 925 | 758 | 3,909 | 20,401 | 2,546 | 1,916 | 2,348 | 200 |
| 2011-12 | 2,590 | 729 | 416 | 807 | 1,080 | 922 | 5,126 | 23,295 | 3,247 | 2,488 | 2,744 | 259 |
| 2012-13 | 3,588 | 607 | 461 | 671 | 740 | 862 | 5,345 | 22,770 | 3,168 | 2,739 | 2,682 | 384 |
| 2013-14 | 3,670 | 768 | 455 | 806 | 1,148 | 1,239 | 5,839 | 25,427 | 3,941 | 3,325 | 4,196 | 578 |
| 2014-15p | 3,649 | 722 | 424 | 754 | 1,036 | 1,087 | 7,071 | 24,148 | 3,723 | 3,524 | 5,045 | 766 |
| 2015-16p | 3,716 | 791 | 417 | 724 | 1,072 | 1,289 | 10,024 | 29,131 | 3,482 | 3,681 | 5,711 | 774 |
| 2016-17p | 5,250 | 874 | 580 | 841 | 1,214 | 1,238 | 8,020 | 22,684 | 3,072 | 3,382 | 4,915 | 800 |
| 2017-18p | 5,861 | 1,160 | 633 | 916 | 1,182 | 1,120 | 8,431 | 23,958 | 3,632 | 4,072 | 4,438 | 837 |
Figure 9 shows the average landed weight per licence by LFA, with the area licence count converted to Category A equivalent (i.e., partnership/stacked licences at 0.75, Category B licences at 0.30). The LFAs with the highest 2016-17 landings per licence were LFA 38, LFA 35 and LFA 30.
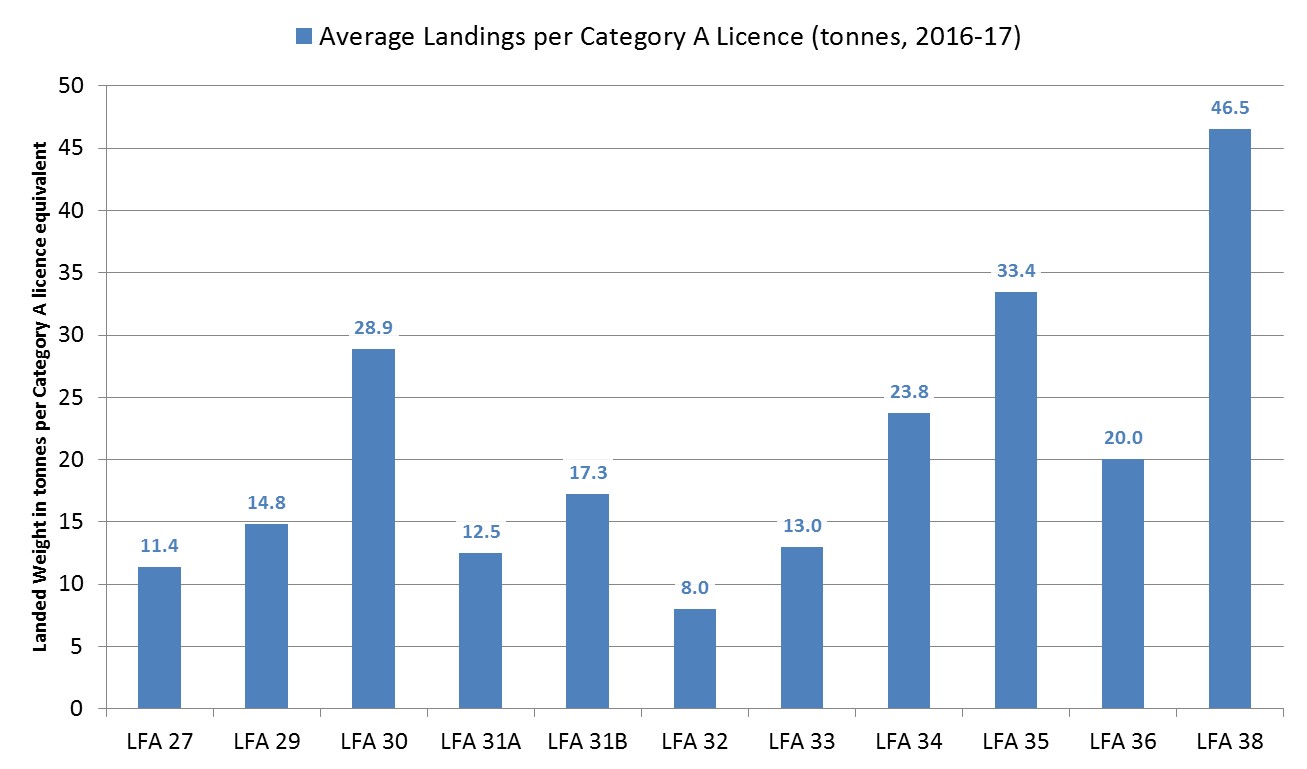
Figure 9: Maritimes Region inshore lobster average landed weight per licence - Description
This chart shows the average landed weight per licence by LFA, with the area licence count converted to Category A equivalent (i.e., partnership/stacked licences at 0.75, Category B licences at 0.30). The LFAs with the highest 2016-17 landings per licence were LFA 38, LFA 35 and LFA 30.
| - | LFA 27 | LFA 29 | LFA 30 | LFA 31A | LFA 31B | LFA 32 | LFA 33 | LFA 34 | LFA 35 | LFA 36 | LFA 38 |
|---|---|---|---|---|---|---|---|---|---|---|---|
| Licence Count (Category A equivalent) | 460.7 | 59.0 | 20.0 | 67.2 | 70.3 | 152.7 | 617.9 | 955.0 | 91.9 | 168.8 | 122.8 |
| Landed Weight (tonnes, 2016-17) | 5,250.0 | 874.0 | 580.0 | 841.0 | 1,214.0 | 1,238.0 | 8,020.0 | 22,684.0 | 3,072.0 | 3,382.0 | 5,715.0 |
| Average Landings per Category A Licence (tonnes, 2016-17) | 11.4 | 14.8 | 28.9 | 12.5 | 17.3 | 8.0 | 13.0 | 23.8 | 33.4 | 20.0 | 46.5 |
| Relative to 38 | 24.5% | 31.8% | 62.1% | 26.9% | 37.1% | 17.2% | 27.9% | 51.0% | 71.8% | 43.1% | 100.0% |
Figure 10 shows inshore lobster landed value by LFA from the 2007-08 season through 2016-17 (data is preliminary).
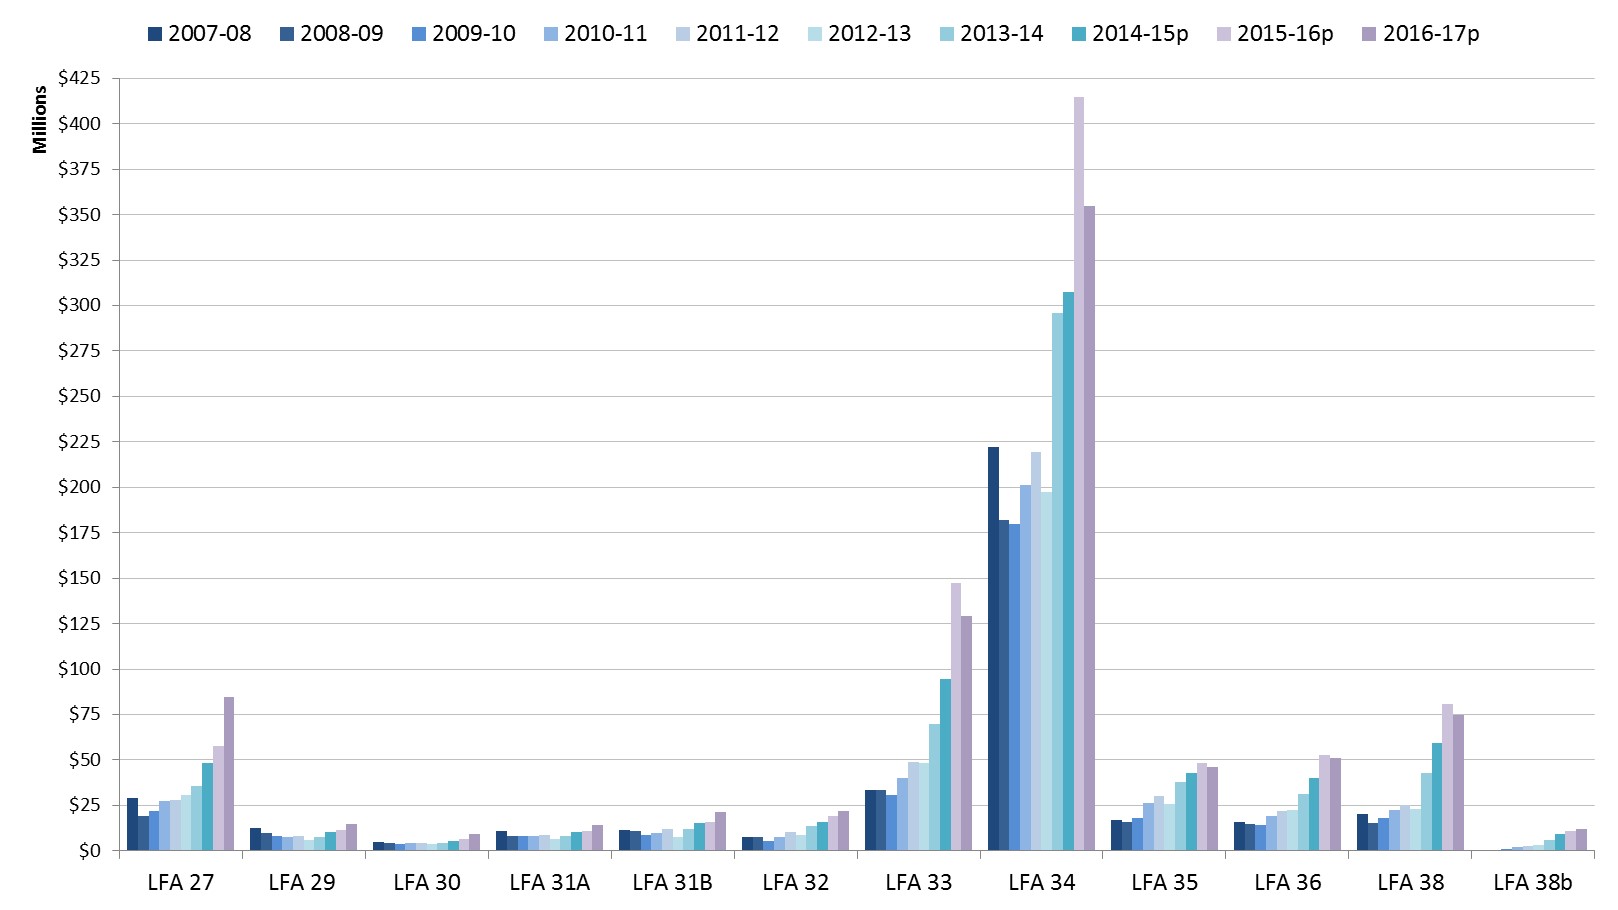
Figure 10: Maritimes Region inshore lobster landed value by LFA - Description
This chart shows inshore lobster landed value by LFA from the 2007-08 season through 2016-17 (data is preliminary).
| - | LFA 27 | LFA 29 | LFA 30 | LFA 31A | LFA 31B | LFA 32 | LFA 33 | LFA 34 | LFA 35 | LFA 36 | LFA 38 | LFA 38B |
|---|---|---|---|---|---|---|---|---|---|---|---|---|
| 2007-08 | $29,199 | $12,315 | $4,875 | $10,632 | $11,366 | $7,771 | $33,665 | $222,078 | $16,811 | $15,918 | $20,448 | $506 |
| 2008-09 | $18,988 | $9,816 | $4,483 | $8,358 | $11,060 | $7,475 | $33,513 | $182,187 | $15,999 | $14,460 | $15,363 | $486 |
| 2009-10 | $21,854 | $7,947 | $3,548 | $7,933 | $8,531 | $5,617 | $30,877 | $179,557 | $18,041 | $14,225 | $18,122 | $1,037 |
| 2010-11 | $27,574 | $7,570 | $4,331 | $7,906 | $9,491 | $7,761 | $40,018 | $201,157 | $26,388 | $18,925 | $22,386 | $1,804 |
| 2011-12 | $27,980 | $8,065 | $4,519 | $8,895 | $11,907 | $10,209 | $48,826 | $219,602 | $29,976 | $22,130 | $25,105 | $2,627 |
| 2012-13 | $30,590 | $5,828 | $3,973 | $6,292 | $7,639 | $8,499 | $48,041 | $197,505 | $25,674 | $22,264 | $22,797 | $3,410 |
| 2013-14 | $35,723 | $7,616 | $4,433 | $7,962 | $11,924 | $13,364 | $69,876 | $295,854 | $37,592 | $31,420 | $42,938 | $6,119 |
| 2014-15 | $48,357 | $10,221 | $5,596 | $10,522 | $15,123 | $15,988 | $94,745 | $307,543 | $42,851 | $40,250 | $59,378 | $9,296 |
| 2015-16p | $58,266 | $11,607 | $6,699 | $10,703 | $15,946 | $19,315 | $149,419 | $419,669 | $48,000 | $53,158 | $82,031 | $10,332 |
| 2016-17p | $84,303 | $14,436 | $9,289 | $13,945 | $21,467 | $21,929 | $129,000 | $356,000 | $45,791 | $49,854 | $74,750 | $12,134 |
3.3.3 Lobster landings by jurisdiction
Figure 11 shows how the landings of inshore lobster in Maritimes Region during the year relate to landings in other Canadian and American management jurisdictions (2016 data). Figure 12 shows the % share of Maritimes Region inshore lobster landings relative to the total supply.
While total supply tends to be low from January through April, Maritimes Region lands the majority, between 72% and 79%, depending on the month. Some portion of sales made early in the year tend to come from lobster caught at the end of the previous year. Although landings in Maritimes Region increase in May, the share of total supply declined to 35% in 2016 and declined further to 24% in June and 8% in July. Supply from Maritimes Region in 2015 was extremely low (1-2%) in August and September via the relatively small LFA 38b fishery and the sale of lobster from harvesters’ inventory.
In October, with LFA 35 opening and fishing activity in other jurisdictions, such as Gulf Region, winding down, the Maritimes Region share increases (to 13% in October 2016). LFAs 36 and 38 open mid-November and LFAs 33 and 34 open at the end of November, bringing the Maritimes Region share for November 2016 to 44%. For December 2016, Maritimes Region accounted for 83% of lobster landings (sales), with some portion of the December catch held for sale into January of the next year.

Figure 11: North American landings of inshore lobster by jurisdiction, 2016 - Description
This chart shows how the landings of inshore lobster in Maritimes Region during the year relate to landings in other Canadian and American management jurisdictions (2016 data).
| 2016 Month | Landings (Sales) (t) | - | - | - | - | - | - | - | - | Maritimes Region % of Total North American Lobster Landings (Sales) (2016) | - | |
|---|---|---|---|---|---|---|---|---|---|---|---|---|
| - | Maritimes Region | Gulf Region | Newfoundland & Labrador Region | Quebec Region | Canada Total | Maine | Other US | Maine as % of US Total | US Total | Canada + US Total | LFA 41 Portion | |
| Jan | 5,595 | 0 | 0 | 0 | 5,595 | 1,176 | 461 | 71.8% | 1,637 | 7,232 | 77.4% | 69 |
| Feb | 3,032 | 0 | 0 | 0 | 3,032 | 490 | 302 | 61.9% | 793 | 3,825 | 79.3% | 78 |
| Mar | 2,614 | 0 | 0 | 0 | 2,614 | 442 | 246 | 64.3% | 688 | 3,302 | 79.2% | 97 |
| Avr | 4,380 | 0 | 455 | 240 | 5,075 | 791 | 231 | 77.4% | 1,022 | 6,097 | 71.8% | 105 |
| May | 9,784 | 11,663 | 1,676 | 2,615 | 25,739 | 1,482 | 419 | 77.9% | 1,901 | 27,639 | 35.4% | 121 |
| June | 4,894 | 9,000 | 645 | 1,801 | 16,340 | 3,455 | 933 | 78.7% | 4,388 | 20,727 | 23.6% | 191 |
| July | 1,279 | 155 | 77 | 522 | 2,032 | 11,384 | 1,779 | 86.5% | 13,162 | 15,195 | 8.4% | 108 |
| Aug | 158 | 3,367 | 0 | 5 | 3,530 | 11,363 | 2,018 | 84.9% | 13,382 | 16,911 | 0.9% | - |
| Sept | 240 | 2,756 | 0 | 0 | 2,996 | 9,743 | 1,602 | 85.9% | 11,344 | 14,340 | 1.7% | - |
| Oct | 1,856 | 539 | 0 | 0 | 2,395 | 10,281 | 1,794 | 85.1% | 12,075 | 14,470 | 12.8% | 19 |
| Nov | 6,826 | 0 | 0 | 0 | 6,826 | 7,085 | 1,497 | 82.6% | 8,582 | 15,408 | 44.3% | 45 |
| Dec | 16,117 | 0 | 0 | 0 | 16,117 | 2,425 | 802 | 75.2% | 3,227 | 19,344 | 83.3% | 28 |
| 2016 Totals | 56,775 | 27,480 | 2,853 | 5,182 | 92,290 | 60,116 | 12,084 | 83.3% | 72,200 | 164,490 | 34.5% | 789 |
| 2015 Totals | 55,662 | 27,633 | 2,732 | 5,900 | 91,927 | 55,521 | 11,028 | 83.4% | 66,549 | 158,476 | 35,1% | - |
| 2014 Totals | 57,336 | 28,360 | 2,138 | 5,353 | 93,187 | 56,412 | 10,706 | 84.0% | 67,119 | 160,306 | 35.8% | - |
| 2013 Totals | 44,830 | 26,685 | 2,200 | 4,286 | 78,002 | 57,798 | 10,134 | 85.1% | 67,932 | 145,933 | 30.7% | - |
| 2006 Totals | 31,091 | 17,279 | 2,644 | 3,241 | 54,255 | 32,962 | 8,590 | 79.3% | 41,551 | 95,807 | 32.5% | - |
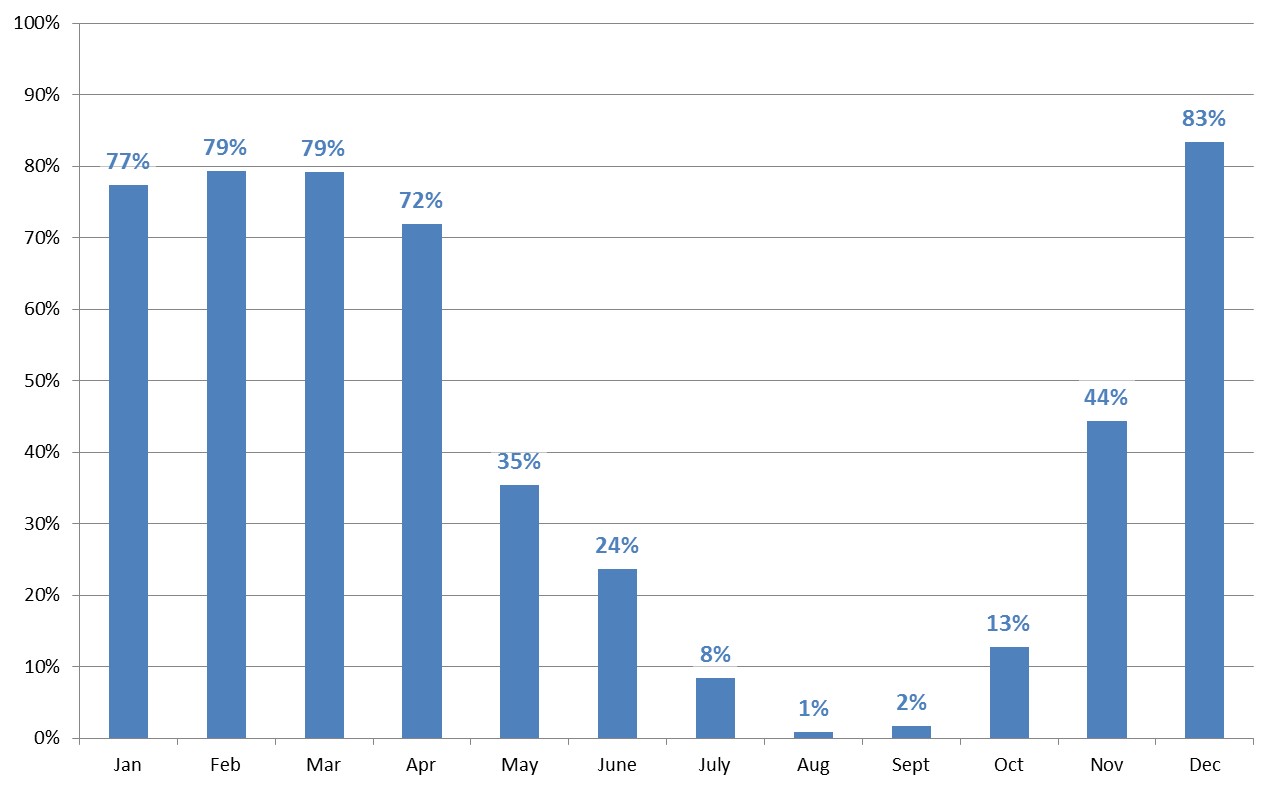
Figure 12: Maritimes Region monthly lobster landings (sales) as share of North American total inshore lobster landings, 2016 - Description
| 2016 Month | Landings (Sales) (t) | - | - | - | - | - | - | - | - | Maritimes Region % of Total North American Lobster Landings (Sales) (2016) | - | |
|---|---|---|---|---|---|---|---|---|---|---|---|---|
| - | Maritimes Region | Gulf Region | Newfoundland & Labrador Region | Quebec Region | Canada Total | Maine | Other US | Maine as % of US Total | US Total | Canada + US Total | LFA 41 Portion | |
| Jan | 5,595 | 0 | 0 | 0 | 5,595 | 1,176 | 461 | 71.8% | 1,637 | 7,232 | 77.4% | 69 |
| Feb | 3,032 | 0 | 0 | 0 | 3,032 | 490 | 302 | 61.9% | 793 | 3,825 | 79.3% | 78 |
| Mar | 2,614 | 0 | 0 | 0 | 2,614 | 442 | 246 | 64.3% | 688 | 3,302 | 79.2% | 97 |
| Apr | 4,380 | 0 | 455 | 240 | 5,075 | 791 | 231 | 77.4% | 1,022 | 6,097 | 71.8% | 105 |
| May | 9,784 | 11,663 | 1,676 | 2,615 | 25,739 | 1,482 | 419 | 77.9% | 1,901 | 27,639 | 35.4% | 121 |
| June | 4,894 | 9,000 | 645 | 1,801 | 16,340 | 3,455 | 933 | 78.7% | 4,388 | 20,727 | 23.6% | 119 |
| July | 1,279 | 155 | 77 | 522 | 2,032 | 11,384 | 1,779 | 86.5% | 13,162 | 15,195 | 8.4% | 108 |
| Aug | 158 | 3,367 | 0 | 5 | 3,530 | 11,363 | 2,018 | 84.9% | 13,382 | 16,911 | 0.9% | - |
| Sept | 240 | 2,756 | 0 | 0 | 2,996 | 9,743 | 1,602 | 85.9% | 11,344 | 14,340 | 1.7% | - |
| Oct | 1,856 | 539 | 0 | 0 | 2,395 | 10,281 | 1,794 | 85.1% | 12,075 | 14,470 | 12.8% | 19 |
| Nov | 6,826 | 0 | 0 | 0 | 6,826 | 7,085 | 1,497 | 82.6% | 8,582 | 15,408 | 44.3% | 45 |
| Dec | 16,117 | 0 | 0 | 0 | 16,117 | 2,425 | 802 | 75.2% | 3,227 | 19,344 | 83.3% | 28 |
| 2016 Totals | 56,775 | 27,480 | 2,853 | 5,182 | 92,290 | 60,116 | 12,084 | 83.3% | 72,200 | 164,490 | 34.5% | 789 |
3.3.4 Average price
The average nominal inshore price for lobster in the Maritimes Region has fluctuated greatly over the period 1988 through 2017 (preliminary), reaching a low of just below $3.00 per pound in 1990 before rising to $6.62 in 2003. As lobster is considered a luxury food item, its price is relatively high among fish and seafood products, with this price appearing to be sensitive to macro-economic conditions and related changes to income levels.
Following the onset of the global financial crisis in 2008, coupled with an increased supply of lobster and a stronger Canadian dollar, the average price dropped to a low of $4.16 in 2012 before rising again to an all-time high of $7.43 in 2017. The nominal price history is represented by the blue line in Figure 13.
Adjusting for inflation, the average price at the wharf peaked in 1999 at $8.61 per pound and averaged $6.61 over the 1988 to 2017 period. While not a record, the 2017 average price was the highest in 12 years and represented a significant turnaround from the lows in the wake of the global financial crisis. The inflation-adjusted price is represented by the red line in Figure 13.
Adjusting the constant dollar average inshore lobster price (red line) to factor out the currency exchange rate with the US dollar can provide a more standardized look at the long-term average price relative to the market (green line in Figure 13).
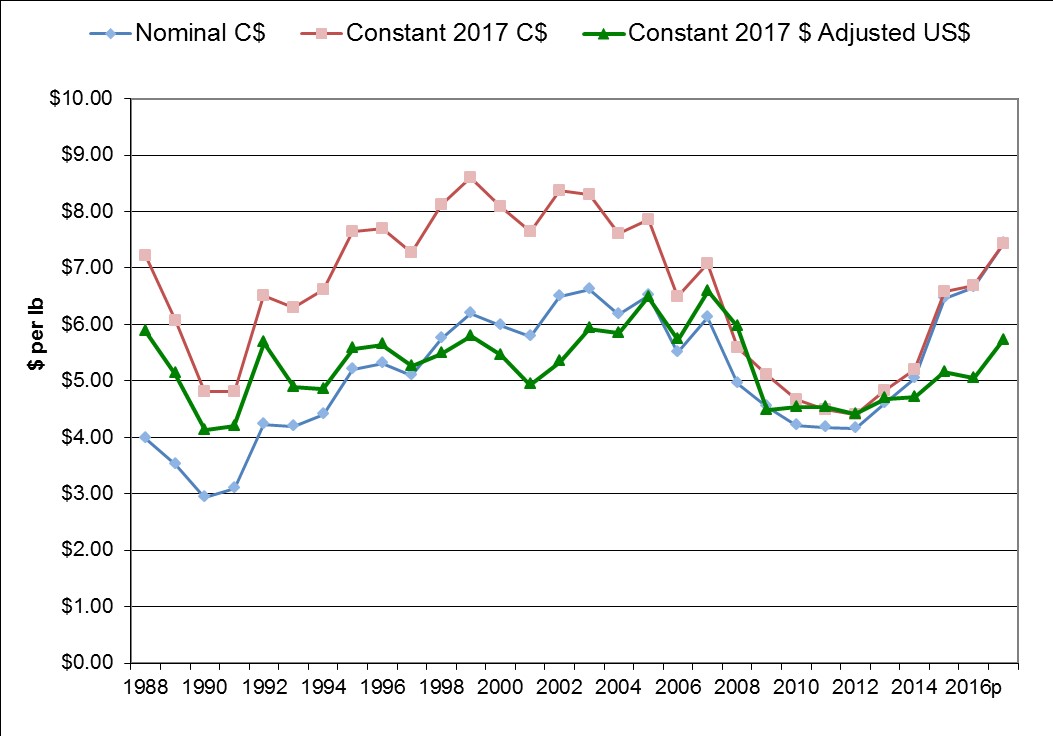
Figure 13: Maritimes Region average inshore lobster price, 1988 to 2017p - Description
Figure 13: This chart shows Maritimes Region average inshore lobster price for the period 1988 to 2017, with the latest years’ data as preliminary.
| - | Nominal C$ | Constant 2017 C$ | Constant 2017 $ Adjusted US$ |
|---|---|---|---|
| 1988 | $3.99 | $7.30 | $5.93 |
| 1989 | $3.52 | $6.14 | $5.18 |
| 1990 | $2.93 | $4.87 | $4.17 |
| 1991 | $3.09 | $4.86 | $4.25 |
| 1992 | $4.24 | $6.58 | $5.74 |
| 1993 | $4.19 | $6.38 | $4.94 |
| 1994 | $4.40 | $6.69 | $4.90 |
| 1995 | $5.19 | $7.73 | $5.63 |
| 1996 | $5.30 | $7.77 | $5.70 |
| 1997 | $5.10 | $7.36 | $5.32 |
| 1998 | $5.75 | $8.21 | $5.54 |
| 1999 | $6.20 | $8.70 | $5.86 |
| 2000 | $5.99 | $8.18 | $5.51 |
| 2001 | $5.79 | $7.73 | $4.99 |
| 2002 | $6.49 | $8.47 | $5.39 |
| 2003 | $6.62 | $8.40 | $5.99 |
| 2004 | $6.17 | $7.68 | $5.90 |
| 2005 | $6.51 | $7.94 | $6.55 |
| 2006 | $5.49 | $6.57 | $5.79 |
| 2007 | $6.12 | $7.16 | $6.66 |
| 2008 | $4.95 | $5.65 | $6.03 |
| 2009 | $4.54 | $5.17 | $4.53 |
| 2010 | $4.22 | $4.72 | $4.58 |
| 2011 | $4.17 | $4.53 | $4.58 |
| 2012 | $4.16 | $4.45 | $4.46 |
| 2013 | $4.59 | $4.87 | $4.73 |
| 2014 | $5.05 | $5.26 | $4.76 |
| 2015 | $6.46 | $6.66 | $5.21 |
| 2016p | $6.60 | $6.78 | $5.12 |
| 2017p | $7.32 | $7.32 | $5.63 |
| Year | CPI | Convert to 2017 | 2017 Lobster Price (Maritimes Region) | Exchange Rate (annual average) | Adj to USD |
|---|---|---|---|---|---|
| 1988 | 71.20 | 1.8315 | $7.30 | $0.813 | $5.93 |
| 1989 | 74.80 | 1.7433 | $6.14 | $0.845 | $5.18 |
| 1990 | 78.40 | 1.6633 | $4.87 | $0.857 | $4.17 |
| 1991 | 82.80 | 1.5749 | $4.86 | $0.873 | $4.25 |
| 1992 | 84.00 | 1.5524 | $6.58 | $0.872 | $5.74 |
| 1993 | 85.60 | 1.5234 | $6.38 | $0.775 | $4.94 |
| 1994 | 85.70 | 1.5216 | $6.69 | $0.732 | $4.90 |
| 1995 | 87.60 | 1.4886 | $7.73 | $0.729 | $5.63 |
| 1996 | 88.90 | 1.4668 | $7.77 | $0.733 | $5.70 |
| 1997 | 90.40 | 1.4425 | $7.36 | $0.722 | $5.32 |
| 1998 | 91.30 | 1.4283 | $8.21 | $0.674 | $5.54 |
| 1999 | 92.90 | 1.4037 | $8.70 | $0.673 | $5.86 |
| 2000 | 95.40 | 1.3669 | $8.18 | $0.673 | $5.51 |
| 2001 | 97.80 | 1.3333 | $7.73 | $0.646 | $4.99 |
| 2002 | 100.00 | 1.3040 | $8.47 | $0.637 | $5.39 |
| 2003 | 102.80 | 1.2685 | $8.40 | $0.714 | $5.99 |
| 2004 | 104.70 | 1.2455 | $7.68 | $0.768 | $5.90 |
| 2005 | 107.00 | 1.2187 | $7.94 | $0.825 | $6.55 |
| 2006 | 109.10 | 1.1952 | $6.57 | $0.882 | $5.79 |
| 2007 | 111.50 | 1.1695 | $7.16 | $0.930 | $6.66 |
| 2008 | 114.09 | 1.1429 | $5.65 | $1.066 | $6.03 |
| 2009 | 114.43 | 1.1395 | $5.17 | $0.876 | $4.53 |
| 2010 | 116.46 | 1.1197 | $4.72 | $0.971 | $4.58 |
| 2011 | 119.90 | 1.0876 | $4.53 | $1.011 | $4.58 |
| 2012 | 121.7 | 1.0715 | $4.45 | $1.000 | $4.46 |
| 2013 | 122.8 | 1.0619 | $4.87 | $0.971 | $4.73 |
| 2014 | 125.2 | 1.0415 | $5.26 | $0.905 | $4.76 |
| 2015 | 126.6 | 1.0300 | $6.66 | $0.782 | $5.21 |
| 2016p | 127.0 | 1.0268 | $6.78 | $0.755 | $5.12 |
| 2017p | 130.4 | 1.0000 | $7.32 | $0.770 | $5.63 |
Over the 1988 to 2017 period, this inflation- and-exchange-rate-adjusted price averaged $5.27 per pound, reaching a peak in 2007 at $6.59. The lowest year in the time series was 1990 with an average price of $4.13. The price fluctuated while increasing to $5.79 in 1999 and dropping to $4.93 in 2001, potentially affected by the economic declines from the end of the dot-com bubble as well as the turmoil and uncertainty experienced after the 9/11 attacks. Prices rose again during the asset bubble years of the mid-2000s, reaching a peak of $6.59 in 2007 and declined precipitously after 2008. From 2009 to 2014, the adjusted price averaged about $4.50 per pound, then increased to over $5.00 again in 2015 and rose to $5.72 in 2017.
3.4 Harvesting employment
The inshore lobster fishery is the main driver of commercial fishery harvesting employment in Maritimes Region, employing an average of 7,500 people annually over the 2014 to 2018 period, which represents 62% of the average annual number of registered commercial fish harvesters in the region.
Lobster harvesting employment varies by LFA and relates mainly to the number of licences in an LFA, but also to vessel size, the distance from shore and time of year that fishing occurs and the number of partnerships and stacked licences in the LFA.
Figure 14 shows the average annual employment by LFA in Maritimes Region for the period 2014 through 2018. LFA 27 figures do not include Gulf Region based employment.
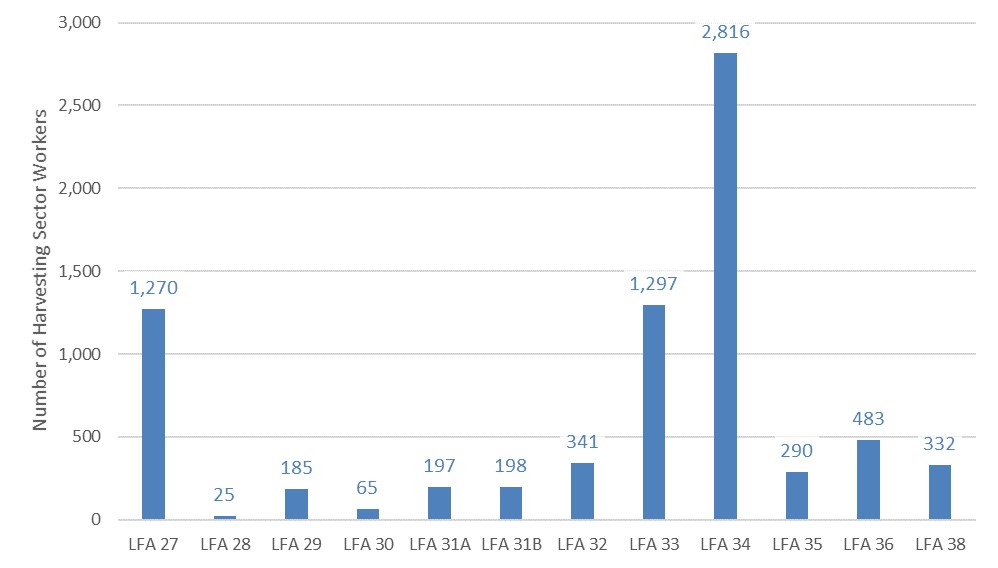
Figure 14: Lobster harvesting employment by LFA (annual average, 2014-2018) - Description
Figure 14: This chart shows the average annual employment by LFA in Maritimes Region for the period 2014 through 2018. LFA 27 figures do not include Gulf Region based employment.
| 5 year averages | |
|---|---|
| MarRegion | 7441.304 |
| LFA 27 | 1269.976 |
| LFA 28 | 24.85683 |
| LFA 29 | 185.2317 |
| LFA 30 | 65.24366 |
| LFA 31A | 197.4195 |
| LFA 31B | 198.1777 |
| LFA 32 | 341.2264 |
| LFA 33 | 1297.162 |
| LFA 34 | 2815.766 |
| LFA 35 | 290.1382 |
| LFA 36 | 483.482 |
| LFA 38 | 331.8131 |
Tables 11 and 12 show the average crew complement by year by LFA, as well as the estimated harvesting employment by year by LFA in Maritimes Region. The crew complement figures are averages of crew reports by inshore lobster licence holders. The harvesting employment figures use these average crew complement figures, multiplied by the number of active enterprises in the LFA (and assuming 2 people on board the vessel for Category B licences).
Harvesting employment ranged from 7,163 in 2014 to a high of 7,835 in 2017, then declined slightly to 7,737 in 2018. The average regional inshore lobster harvesting employment for the 2014 to 2018 period was exactly 7,500 people (vessel captains and crew).
| LFA | 2014 | 2015 | 2016 | 2017 | 2018 | Average |
|---|---|---|---|---|---|---|
| 27 | 2.53 | 2.60 | 2.77 | 2.89 | 3.02 | 2.76 |
| 28 | 1.93 | 1.95 | 1.51 | 1.90 | 2.00 | 1.86 |
| 29 | 3.29 | 3.05 | 2.79 | 3.09 | 3.11 | 3.07 |
| 30 | 3.23 | 3.20 | 3.23 | 3.14 | 3.51 | 3.26 |
| 31A | 2.82 | 2.90 | 2.92 | 3.04 | 3.02 | 2.94 |
| 31B | 2.81 | 2.77 | 2.82 | 2.86 | 2.86 | 2.82 |
| 32 | 2.11 | 2.18 | 2.20 | 2.31 | 2.29 | 2.22 |
| 33 | 2.11 | 2.23 | 2.15 | 2.29 | 2.26 | 2.21 |
| 34 | 2.99 | 3.07 | 2.93 | 3.13 | 3.03 | 3.03 |
| 35 | 2.77 | 3.08 | 3.28 | 3.33 | 3.26 | 3.14 |
| 36 | 2.76 | 2.88 | 3.04 | 3.04 | 3.31 | 3.00 |
| 38 | 2.93 | 3.04 | 2.71 | 3.27 | 3.01 | 2.99 |
| LFA | 2014 | 2015 | 2016 | 2017 | 2018 | Average |
|---|---|---|---|---|---|---|
| 27 | 1,143 | 1,186 | 1,262 | 1,357 | 1,402 | 1,270 |
| 28 | 25 | 25 | 21 | 25 | 28 | 25 |
| 29 | 199 | 187 | 169 | 186 | 184 | 185 |
| 30 | 65 | 64 | 65 | 63 | 70 | 65 |
| 31A | 194 | 197 | 195 | 208 | 193 | 197 |
| 31B | 199 | 196 | 199 | 200 | 197 | 198 |
| 32 | 324 | 336 | 338 | 356 | 351 | 341 |
| 33 | 1,253 | 1,316 | 1,269 | 1,349 | 1,299 | 1,297 |
| 34 | 2,761 | 2,841 | 2,729 | 2,915 | 2,832 | 2,816 |
| 35 | 255 | 290 | 301 | 307 | 298 | 290 |
| 36 | 429 | 460 | 491 | 494 | 544 | 483 |
| 38 | 315 | 330 | 300 | 375 | 339 | 332 |
| Maritimes Region | 7,163 | 7,429 | 7,339 | 7,835 | 7,737 | 7,500 |
3.5 Dependency on lobster
In the context of the analysis in this section of the report, LFA dependency refers to the total lobster landed value by lobster licence holders within an LFA relative to the total commercial landed value by the same group. It is generally high across all LFAs in Maritimes Region, with the average for the region as a whole of 90%. Licence dependency for lobster licence holders is an average of the dependency on lobster for each licence holder in the LFA. The average licence dependency for lobster licence holders in the region is 94%.
In LFA 27, for example, lobster represents 78% of the total commercial fishery landed value for lobster licence holders in the area, while the average dependency on lobster for lobster licence holders in the LFA is 92%. This suggests that there was a relatively small subset of licence holders with significant landed value from other species but that most lobster licence holders are highly dependent on lobster.
LFA 31B has the highest dependency on lobster in terms of both LFA total landings and average licence holder dependency. LFA 29 had the biggest gap between LFA dependency and average licence dependency.
Figure 15 shows dependency information by Maritimes Region LFA with both LFA dependency (lobster as a share of total landed value by LFA lobster licence holders) and average lobster licence dependency (the LFA average % dependency by lobster licence holders on lobster).

Figure 15: Dependency on lobster for LFA and for lobster licence holders by LFA (2016) - Description
Figure 15: This chart shows dependency information by Maritimes Region LFA with both LFA dependency (lobster as a share of total landed value by LFA lobster licence holders) and average lobster licence dependency (the LFA average % dependency by lobster licence holders on lobster).
| - | Overall LFA Dependency % | Avg Licence Dependency % |
|---|---|---|
| LFA 27 | 78 | 92 |
| LFA 29 | 70 | 96 |
| LFA 30 | 71 | 88 |
| LFA 31A | 88 | 94 |
| LFA 31B | 99 | 99 |
| LFA 32 | 91 | 94 |
| LFA 33 | 90 | 94 |
| LFA 34 | 94 | 97 |
| LFA 35 | 89 | 91 |
| LFA 36 | 89 | 91 |
| LFA 38 | 93 | 94 |
| Maritimes ave% | 90 | 94 |
County dependency examines the degree to which lobster contributes to total commercial fishery landed values by county in Maritimes Region. At the county level, the landed value of the commercial fishery varies by county, as does the relative importance of lobster. In 2016, counties with the highest total landed value are Shelburne County, NS, with $302 million of which lobster accounted for 70%. Yarmouth County, NS, had $227 million in commercial fishery landed value of which lobster was 71%. Charlotte County, NB, had $155 million in total landed value with lobster accounting for 82%.
In Nova Scotia, counties east of Shelburne County tended to have a lower contribution from lobster with other key fisheries making up the balance, including snow crab, shrimp, clam, groundfish, elver, etc.,.
Victoria County, NS, which straddles DFO Maritimes and Gulf regions, had 89% of its commercial fisheries landed value from lobster. See Figure 16 for more information.
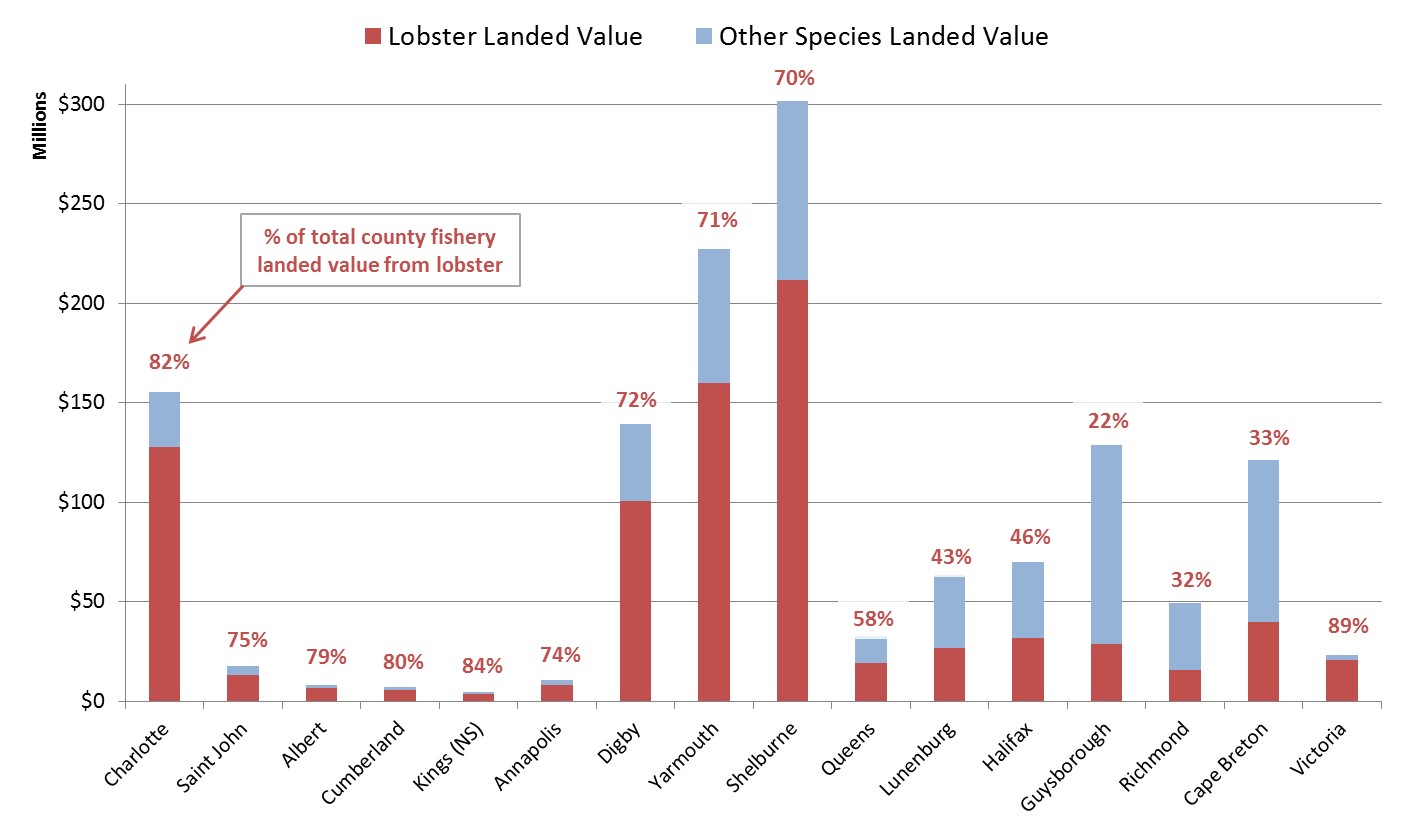
Figure 16: Lobster dependency by county in DFO Maritimes Region (2016) - Description
Figure 16: This chart shows lobster dependency information by county in Maritimes Region.
| - | Lobster Landed Value | Other Species Landed Value | Total Landed Value | % Lobster |
|---|---|---|---|---|
| Charlotte | $127,947,962 | $27,391,479 | $155,339,441 | 82.4% |
| Saint John | $13,236,827 | $4,326,858 | $17,563,685 | 75.4% |
| Albert | $6,381,949 | $1,722,882 | $8,104,831 | 78.7% |
| Cumberland | $5,732,735 | $1,427,213 | $7,159,948 | 80.1% |
| Kings (NS) | $3,682,344 | $725,386 | $4,407,730 | 83.5% |
| Annapolis | $8,071,189 | $2,801,015 | $10,872,204 | 74.2% |
| Digby | $100,473,030 | $38,965,770 | $139,438,800 | 72.1% |
| Yarmouth | $160,155,304 | $67,126,629 | $227,281,933 | 70.5% |
| Shelburne | $212,013,357 | $89,574,767 | $301,588,124 | 70.3% |
| Queens | $19,113,896 | $13,597,150 | $32,711,046 | 58.4% |
| Lunenburg | $26,886,011 | $36,383,836 | $63,269,847 | 42.5% |
| Halifax | $32,011,285 | $38,020,420 | $70,031,705 | 45.7% |
| Guysborough | $28,514,524 | $100,092,362 | $128,606,886 | 22.2% |
| Richmond | $15,770,267 | $33,624,033 | $49,394,300 | 31.9% |
| Cape Breton | $39,581,417 | $81,853,963 | $121,435,380 | 32.6% |
| Victoria | $20,685,600 | $2,627,012 | $23,312,612 | 88.7% |
| Total | $820,257,697 | $540,260,775 | $1,360,518,472 | 60.3% |
| Victoria (Maritimes) | $18,178,008 | $2,627,012 | $20,805,020 | 87.4% |
| Victoria (Gulf) | $2,507,592 | $0 | $2,507,592 | 100.0% |
3.6 International trade of lobster
3.6.1 Imports
Canadian exporters of frozen/processed lobster source much of their product from domestic lobster fishery landings, but also from imports of lobster from the US. From 2012 to 2016, Canada’s imports of US lobster averaged just over 30,500 tonnes and reached a record nominal value of $433 million in 2016. See Figure 17 for more information.
The large rise in the import weight of lobster from the US after 2008 coincided with the dramatic increase in landings during these years, particularly in Maine where landed weight nearly doubled from 31,690 tonnes in 2008 to 59,854 tonnes in 2016.

Figure 17: Value of Canadian lobster imports from US (2000 to 2016) - Description
Figure 17: This chart shows the value of Canadian lobster imports from the US for the period 2000 to 2016.
| Import WEIGHT and VALUE | - | - | - | - | - | - | - | - | - | - | - | - | - | - | - | - | - |
|---|---|---|---|---|---|---|---|---|---|---|---|---|---|---|---|---|---|
| - | 2000 | 2001 | 2002 | 2003 | 2004 | 2005 | 2006 | 2007 | 2008 | 2009 | 2010 | 2011 | 2012 | 2013 | 2014 | 2015 | 2016 |
| Canada Import Weight of Lobster from US | 17,2 05,7 34 |
16,3 28,0 81 |
21,3 19,2 39 |
17,3 62,5 97 |
15,1 74,0 39 |
15,1 69,1 86 |
16,9 50,4 07 |
14,9 78,6 55 |
14,6 59,7 12 |
16,9 40,4 07 |
21,8 11,1 34 |
26,4 48,7 84 |
31,0 16,9 75 |
29,0 54,9 95 |
31,6 51,5 85 |
30,5 41,9 75 |
31,5 64,0 00 |
| Canada Import Value of Lobster from US | $196, 477, 511 |
$191, 285, 809 |
$233, 798, 442 |
$203, 800, 213 |
$181, 184, 485 |
$194, 015, 976 |
$183, 671, 727 |
$155, 769, 993 |
$139, 746, 684 |
$131, 985, 742 |
$188, 327, 222 |
$212, 384, 018 |
$215, 136, 756 |
$237, 413, 480 |
$346, 550, 293 |
$415, 095, 314 |
$432, 617, 959 |
3.6.2 Exports
The value of Canada’s lobster exports reached a record $2.15 billion in 2016, which was 2.7 times the modern era lows of 2009 when total lobster exports were valued at $803 million. In the early 2000s, the split for export value between live lobster and frozen/processed was approximately 50:50. By 2016, the frozen/processed product forms accounted for 61% of Canadian lobster export value, with live lobster making up 39%. In 2016, the US accounted for 71.4% of Canada’s lobster export value, with Asia accounting for 19.9% and the European Union 9.0%.
Generally, the lobster landed by the inshore fleet in Maritimes Region is destined for the live lobster market.
3.6.3 Exports of frozen/processed lobster
Canadian exports of frozen/processed lobster reached a record level of $1.31 billion in 2016, triple the 2009 modern era low of $425 million in 2009. Live lobster export value peaked in 2015 at $855 million and declined slightly to $838 million in 2016, which was still 2.4 times the 2010 low of $346 million. See Figure 18 for more information.
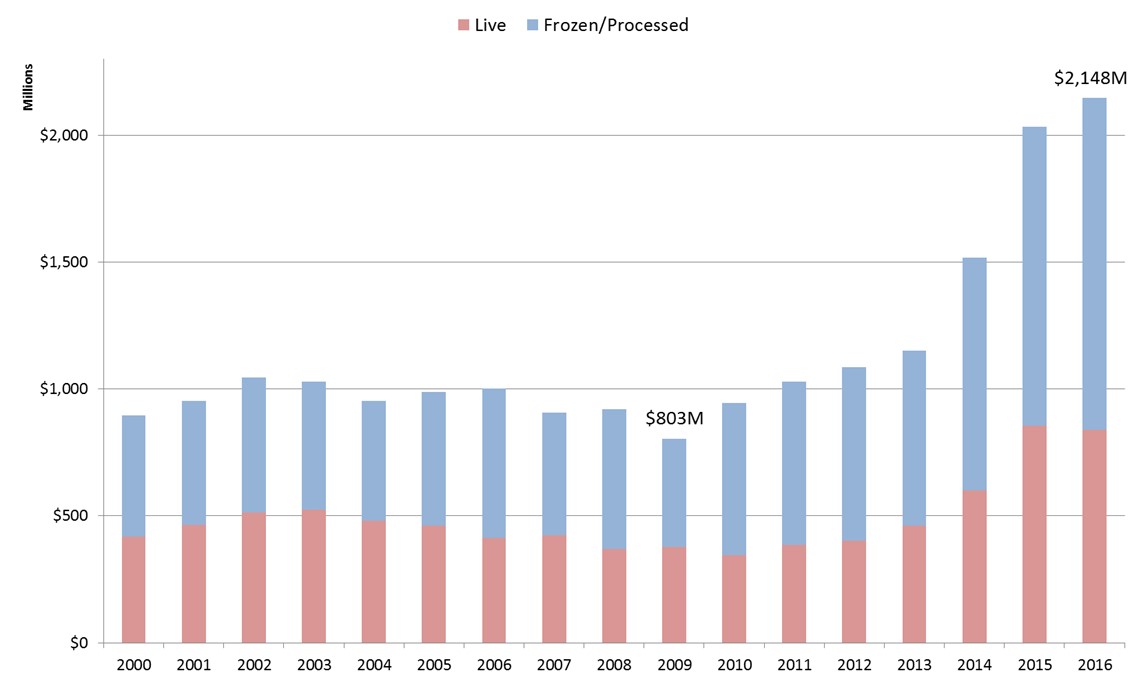
Figure 18: Value of Canadian lobster exports (2000 to 2016) - Description
Figure 18: This chart shows the value of Canadian lobster exports for the period 2000 to 2016.
| - | 2000 | 2001 | 2002 | 2003 | 2004 | 2005 | 2006 | 2007 | 2008 | 2009 | 2010 | 2011 | 2012 | 2013 | 2014 | 2015 | 2016 |
|---|---|---|---|---|---|---|---|---|---|---|---|---|---|---|---|---|---|
| Live | $418, 763, 506 |
$463, 191, 442 |
$514, 052, 377 |
$523, 362, 934 |
$481, 675, 806 |
$460, 805, 523 |
$413, 252, 233 |
$422, 915, 154 |
$369, 097, 512 |
$378, 386, 938 |
$345, 539, 816 |
$386, 214, 455 |
$402, 349, 190 |
$461, 619, 986 |
$599, 328, 975 |
$855, 522, 199 |
$838, 154, 847 |
| Frozen/ Processed | $477, 813, 236 |
$491, 138, 564 |
$530, 292, 981 |
$506, 106, 711 |
$470, 128, 045 |
$528, 653, 873 |
$589, 593, 468 |
$482, 951, 146 |
$551, 870, 422 |
$425, 061, 053 |
$600, 455, 651 |
$641, 706, 779 |
$683, 896, 931 |
$688, 583, 246 |
$919, 668, 245 |
$1,178, 024, 502 |
$1,310, 252, 110 |
The US is the main market for Canadian frozen/processed lobster and reached a record of $1.03 billion in 2016. Export value to Asian and European markets also reached record levels in 2016 at $153 million and $124 million, respectively.
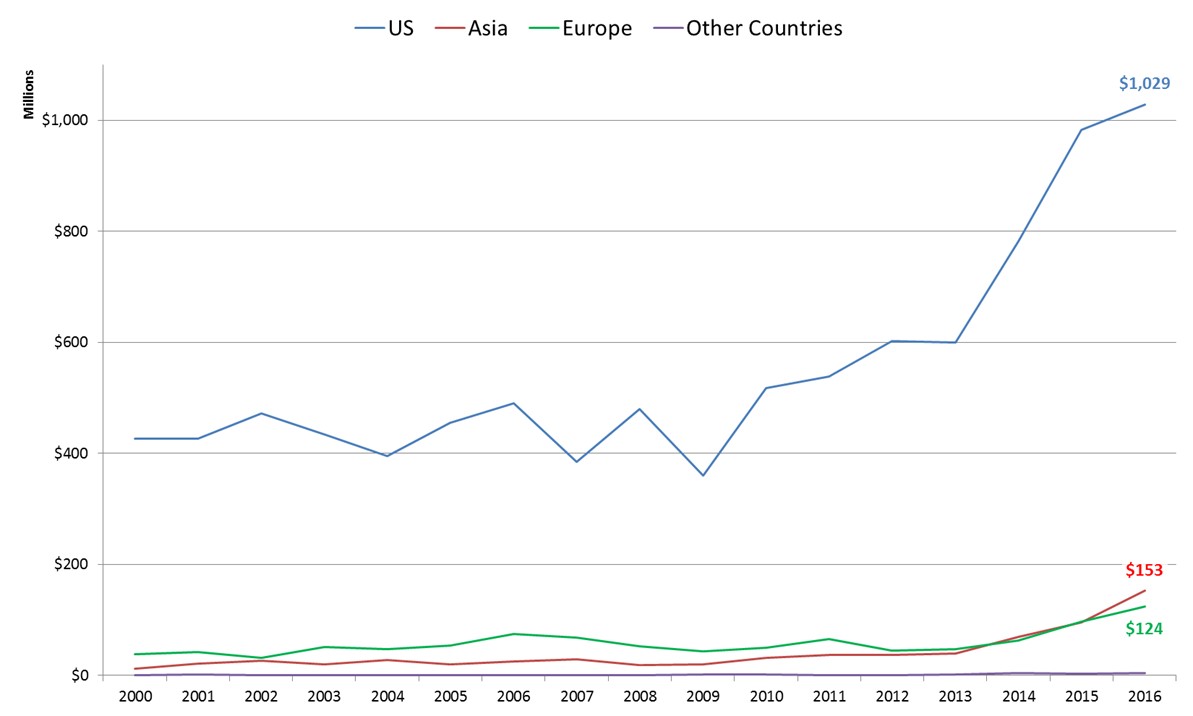
Figure 19: Value of Canadian frozen/processed lobster exports (2000 to 2016) - Description
Figure 19: This chart shows the value of Canadian frozen/processed lobster exports for the period 2000 to 2016.
| Market | - | - | - | - | - | - | - | - | - | - | - | - | - | - | - | - | - |
|---|---|---|---|---|---|---|---|---|---|---|---|---|---|---|---|---|---|
| - | 2000 | 2001 | 2002 | 2003 | 2004 | 2005 | 2006 | 2007 | 2008 | 2009 | 2010 | 2011 | 2012 | 2013 | 2014 | 2015 | 2016 |
| US | $426, 487, 575 |
$426, 809, 196 |
$472, 076, 812 |
$434, 868, 065 |
$395, 233, 761 |
$455, 462, 787 |
$489, 800, 959 |
$385, 111, 923 |
$480, 362, 746 |
$359, 590, 611 |
$517, 355, 932 |
$537, 973, 437 |
$601, 887, 107 |
$599, 392, 657 |
$782, 024, 565 |
$982, 924,139 |
$1,028, 793,269 |
| Asia | $12, 467, 033 |
$21, 540, 521 |
$26, 109, 224 |
$20, 363, 608 |
$27, 790, 183 |
$19, 401, 241 |
$24, 948, 816 |
$29, 167, 257 |
$19, 122, 799 |
$20, 337, 624 |
$31, 301, 775 |
$37, 444, 042 |
$36, 456, 443 |
$39, 459, 277 |
$70, 067, 105 |
$95, 107, 829 |
$152, 745, 569 |
| Europe | $38, 631, 774 |
$41, 672, 610 |
$31, 921, 812 |
$50, 698, 663 |
$46, 936, 057 |
$53, 696, 757 |
$74, 181, 615 |
$68, 225, 014 |
$51, 950, 724 |
$43, 684, 820 |
$50, 290, 232 |
$65, 284, 035 |
$44, 642, 741 |
$47, 714, 270 |
$63, 244, 867 |
$97, 223, 081 |
$124, 264, 555 |
| Other Countries | $226, 854 |
$1,116, 237 |
$185, 133 |
$176, 375 |
$168, 044 |
$93, 088 |
$662, 078 |
$446, 952 |
$434, 153 |
$1,447, 998 |
$1,507, 712 |
$1,005, 265 |
$910, 640 |
$2,017, 042 |
$4,189, 481 |
$2,733, 075 |
$4,448, 717 |
| Total | $477, 813, 236 |
$491, 138, 564 |
$530, 292, 981 |
$506, 106, 711 |
$470, 128, 045 |
$528, 653, 873 |
$589, 593, 468 |
$482, 951, 146 |
$551, 870, 422 |
$425, 061, 053 |
$600, 455, 651 |
$641, 706, 779 |
$683, 896, 931 |
$688, 583, 246 |
$919, 526, 018 |
$1,177, 988,124 |
$1,310, 252,110 |
| - | - | - | - | - | - | - | - | - | - | - | - | - | - | - | - | - | US% of total non-Live |
During the 2000 to 2016 period, the US averaged about 85% of the market for Canadian frozen/processed lobster, with this figure declining to 78% in 2016. See Figure 19 for more information.
3.6.4 Exports of live lobster
For live lobster, the US was also the main market with a peak export value of $552 million in 2015 before declining to $506 million in 2016. Asian markets accounted for a record $256 million in 2016, the first time that Asia reached half of the value of the US market for Canadian live lobster exports. Europe reached historic highs with $76 million and $72 million in 2015 and 2016, respectively.
The US share of Canadian live lobster export value declined from a peak of 82% in 2001 to a low of just over 60% in 2016. Asian markets represented less than 10% of Canada’s live lobster market through 2009 before rising to just over 30% in 2016. Europe accounted for about 9% of Canada’s live lobster export market in 2016, down from a time series high of about 16% in 2008.
China and Hong Kong have accounted for a major portion of the increase in the Asian market for Canadian live lobster, rising from about $10 million in 2009 to a record $167 million in 2016. Canadian live lobster exports to South Korea rose from around $12 million in 2012 to a record $43 million in 2016. Of Canada’s live lobster exports to Asia in 2016, China and Hong Kong accounted for 65% and South Korea accounted for 18%. See Figure 20 for more information.
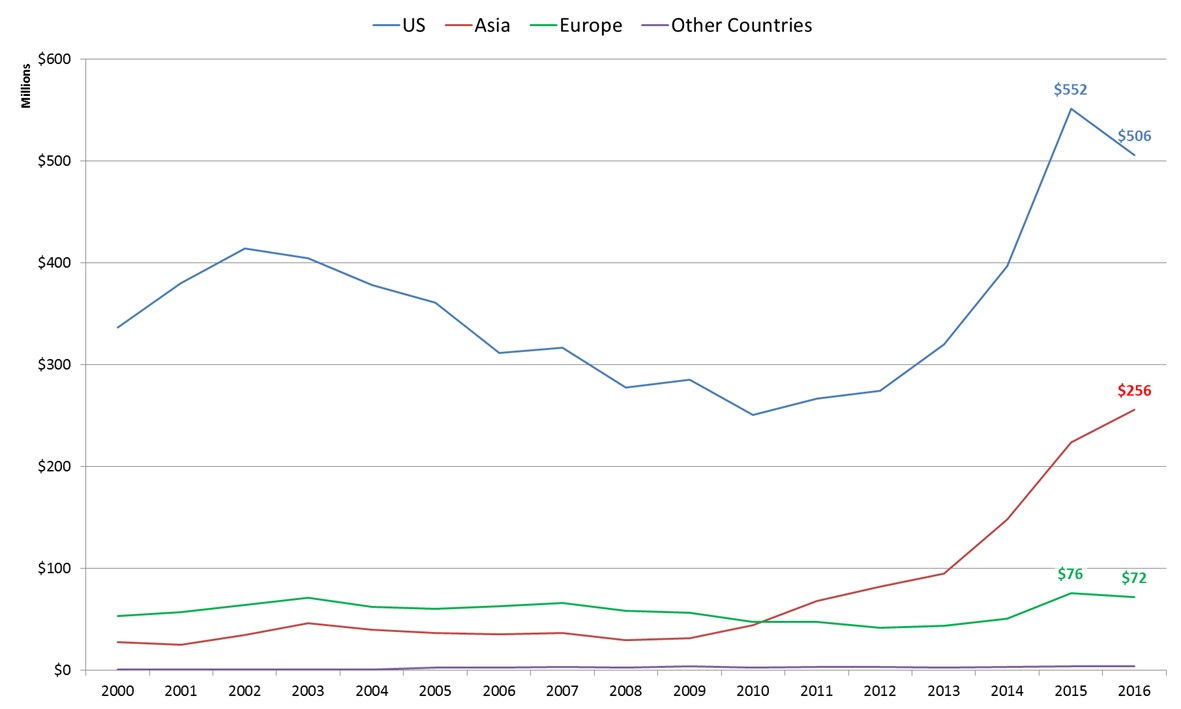
Figure 20: Value of Canadian live lobster exports (2000 to 2016) - Description
Figure 20: This chart shows the value of Canadian live lobster exports for the period 2000 to 2016.
| - | 2000 | 2001 | 2002 | 2003 | 2004 | 2005 | 2006 | 2007 | 2008 | 2009 | 2010 | 2011 | 2012 | 2013 | 2014 | 2015 | 2016 |
|---|---|---|---|---|---|---|---|---|---|---|---|---|---|---|---|---|---|
| US | $337, 072, 853 |
$380, 353, 079 |
$414, 161, 452 |
$404, 784, 064 |
$378, 182, 414 |
$361, 256, 837 |
$311, 973, 983 |
$316, 879, 337 |
$277, 722, 622 |
$285, 633, 780 |
$251, 077, 276 |
$266, 730, 792 |
$274, 839, 957 |
$320, 108, 047 |
$396, 814, 475 |
$551, 525, 425 |
$505, 921, 726 |
| Asia | $27, 464, 980 |
$25, 065, 070 |
$35, 086, 490 |
$46, 587, 192 |
$40, 080, 471 |
$36, 957, 111 |
$35, 700, 466 |
$36, 513, 011 |
$29, 909, 977 |
$31, 901, 622 |
$44, 298, 595 |
$68, 214, 313 |
$82, 570, 836 |
$94, 883, 234 |
$148, 442, 814 |
$223, 762, 316 |
$256, 101, 309 |
| Europe | $53, 467, 233 |
$57, 136, 051 |
$64, 079, 252 |
$71, 398, 544 |
$62, 441, 993 |
$60, 158, 985 |
$62, 870, 901 |
$66, 229, 760 |
$58, 758, 071 |
$56, 749, 355 |
$47, 635, 281 |
$47, 748, 652 |
$41, 694, 612 |
$44, 013, 440 |
$50, 769, 327 |
$76, 142, 544 |
$71, 813, 285 |
| Other Countries | $758, 440 |
$637, 242 |
$725, 183 |
$593, 134 |
$970, 928 |
$2,432, 590 |
$2,706, 883 |
$3,293, 046 |
$2,706, 842 |
$4,102, 181 |
$2,528, 664 |
$3,520, 698 |
$3,243, 785 |
$2,615, 265 |
$3,302, 359 |
$4,091, 914 |
$4,318, 527 |
4. Management issues
4.1 Tag replacement policy
All lobster licence holders are subject to a trap limit and are issued a yearly set of consecutively and uniquely numbered tags to attach to their traps, which match the trap limit. Compliance with the trap limit is monitored through verification of validly tagged traps. When traps are lost, damaged, destroyed or need to be replaced, the licence holder must obtain a replacement tag. Tag replacement procedures should ensure that requests are formal and accurately track the number of replaced tags each year. They should be administratively efficient, provide licence holders with reasonable access and ensure that records are maintained in a manner that facilitates compliance. Various approaches are in place throughout the region and licence holders should contact a local DFO office or industry representative for the specifics in their respective LFAs.
4.2 Residency requirements (LFA 33)
Within LFA 33, the redistribution of licences and effort, in some cases to take advantage of increased catch rates, has been a source of concern. A policy was developed through the advisory process in 2006 and updated in 2010 intended to minimize the negative impacts of this redistribution. As well, a policy was developed to ensure that the approval of a substitute operator was compliant policy. The policies are as follows:
- In LFA 33 residency requirements apply; applicants must have resided in Lunenberg or Queens Counties, the portion of Shelburne County east of the Barrington River or the portion of Halifax County west of the western edge of Cole Harbour. LFA 33 residency requirements may not apply to requests for the issuance of a replacement licence to the licence holder’s son, daughter, son-in-law, daughter-in-law, grandson, granddaughter, father or mother.
- In LFA 33 substitute operators must be residents of Lunenburg or Queens Counties, the portion of Shelburne County east of the Barrington River or the portion of Halifax County west of the western edge of Cole Harbour or a resident of the same port cluster as the licence holder.
These policies do not apply to communal commercial licences.
4.3 Gear loss
Traps lost at sea create a risk of ghost fishing. To reduce this risk, all lobster traps must be fitted with biodegradable panels. In 2018, the department began systematically to collect data on lost fishing gear across all fisheries. Currently, lobster licence holders in all LFAs are required to report lost gear to the department, including lost traps, rope and buoys.
4.4 Gear conflicts
The potential for gear conflict is possible within all LFAs. Historically, this fleet has maintained good communication with other fisheries to alleviate any problems. Regulations help to address conflict by defining properly marked gear and spacing requirements. Section 37(1) of the Atlantic Fishery Regulations , with respect to gear spacing, states that the master of a vessel with mobile gear shall maintain a distance of at least 1/2 nautical mile between his vessel, including any mobile gear attached thereto and any previously set fishing gear.
The combination of applying existing regulations pertaining to distances between mobile and previously set fixed gear, gear marking, the promotion of enhanced communication and conflict resolution between fleets will continue as the main approach to resolve potential conflicts.
4.5 Reporting requirements
Data provided through the submission of logbooks is the primary method through which catch, effort, landings, value, retained bycatch, species at risk and positional information is collected for this fishery. Historically, compliance with reporting requirements was approximately 75%. In 2008, DFO announced that, effective for the 2009 season, licences for lobster fishing would not be issued until fish harvesters have filed reporting documents (logbooks) for all months of the previous lobster season. Licence holders should refer to their conditions for details related to reporting requirements including those related to species at risk. Licence holders who have banked their licence must still comply with reporting requirements (this may entail submission of a nil report).
Logbooks must be submitted to a certified dockside monitoring company (DMC) recognized by DFO Maritimes Region. In LFA 27, Gulf-based licence holders who land their catch in Gulf Region submit their logbooks to DFO and the data is held in Gulf Region databases.
4.6 Retained bycatch
4.6.1 Existing authorizations
Licence holders in all LFAs may retain incidentally caught rock crab, green crab and sculpins. Typically, these species are retained for use as bait by the licence holder. In LFAs 34-38, licence holders may also retain incidentally caught Jonah crab. A current priority for the fishery is to review the impact that retention in the fishery may be having on these populations (other than on green crab, which is an invasive species).
In the recent past, licence holders were required to record any crab they retained for use as bait on their lobster log and any crab they landed and sold on a separate crab log. There was no requirement to report retained sculpins. In the fall of 2018, a new version of the lobster log and new reporting instructions were introduced. Licence holders are now required to report all of their retained bycatch, including sculpins, on their lobster log, whether the bycatch is retained for personal use as bait or landed and sold. The new requirements reflect an attempt to simplify and improve catch reporting in the fishery.
At-sea sampling is also being systematically introduced. Data from the at-sea sampling will be used along with the logbook data to estimate mortality of rock crab, sculpins and Jonah crab in the fishery.
4.6.2 New authorizations
On occasion, licence holders have asked to be allowed to retain other species of bycatch. Any such requests must be submitted to DFO through the advisory committee process. The department has agreed with the industry that these requests will be reviewed according to 3 criteria:
- a sharing formula and management framework can be developed that are compatible with fisheries that already target that species or that are already a significant source of incidental mortality;
- the management framework is enforceable and compliance is believed to be good; and
- there is evidence that the harvest is sustainable (data is collected, impacts are analyzed and impacts are shown to be sustainable).
Under existing regional policy, developing the science needed to demonstrate the sustainability of the harvest of bycatch species is the responsibility of the lobster industry.
In LFA 33, a pilot project was undertaken from 2014/15 to 2016/17 to allow retention of incidentally caught Jonah crab when fishing inside 12 nautical miles from shore. The pilot was terminated after the 3 years for a number of reasons, including a lack of progress in establishing sustainability.
In LFA 27, a pilot project was initiated in 2016 to allow retention of incidentally caught cunner. Catch data is being collected by the industry and reported on annually to the department. The pilot is under review.
4.7 Discarded bycatch
4.7.1 Undersized lobsters
Lobsters less than the minimum legal size must be released. In LFAs 28 and 29, the minimum legal size is 84 mm. In the remaining inshore LFAs, the minimum legal size is 82.5 mm. Minimizing the capture of undersized lobsters is desirable for the efficiency of the fishery as well as to minimize the stress and injury that may result from handling. To minimize the capture of undersized lobsters, all traps must be fitted with escape vents in the exterior wall of each parlour. The vents may also facilitate the escape of non-target species. Discarded lobsters are generally expected to survive and the release of undersized lobsters, along with the release of berried and v-notched female lobsters, is an important conservation measure in the fishery.
4.7.2 Other discarded species
Several species of fish and crustaceans are caught as a bycatch in lobster trap fisheries. Where retention is not authorized, these species must be returned immediately to the waters from which they were taken and in a manner that causes them the least harm.
DFO’s Policy on Managing Bycatch requires the monitoring of fisheries on bycatch species. Systematic at-sea data collection is being introduced in inshore LFAs where it does not currently exist (LFAs 28-30 and 33-38) and reviewed and expanded where it does (LFAs 27 and 31A-32). Should discard amounts of any species be a concern, post-release survival studies may be undertaken and mitigation measures considered. Populations of particular interest at this time include cusk and 4X5Y cod.
4.7.3 Species at risk
A number of marine species are considered to be at risk within Canada. Ensuring protection and promoting recovery of at-risk species is a national priority. To this end, Canada developed the Species at Risk Act (SARA) and a number of complementary programs to promote recovery and protection of species considered to be extirpated, endangered, threatened or of special concern under SARA or identified as such by the Committee on the Status of Endangered Wildlife in Canada (COSEWIC).
SARA includes prohibitions that protect endangered, threatened and extirpated species (Section 32), their residences (Section 33) and their critical habitat (Section 58). Provided specific criteria can be met, SARA allows activities that would otherwise be prohibited to proceed through the issuance of permits or agreements under Section 73 and 74 or through exemptions under Section 83(4). The recovery of species at risk involves the development and implementation of recovery strategies, action plans or management plans and the protection of any critical habitat that has been identified as necessary for the survival or recovery of the species. For species listed as special concern, critical habitat is not identified and the Section 32 prohibitions do not apply.
The Government of Canada has listed several species on Schedule 1 of SARA. Within the Maritimes Region, the following are SARA-listed species for which there may be interactions with the inshore lobster fishery.
- Northern wolffish (Anarhichas denticulatus) – threatened
- Spotted wolffish (Anarhichas minor) – threatened
- Atlantic wolffish (Anarhichas lupus) – special concern
- Leatherback sea turtle (Dermochelys coriacea) – endangered
- North Atlantic right whale (Eubalaena glacialis) – endangered
- Northern bottlenose whale (Hyperoodon ampullatus) – endangered
- Sowerby’s beaked whale (Mesoplodon bidens) – special concern
In accordance with Section 83(4) of SARA, lobster licence holders are currently permitted to conduct their fishery, which may interact with the 2 wolffish species listed as threatened and the leatherback sea turtle listed as endangered, under the condition that any animals incidentally captured be returned to the water in a manner that causes the least harm possible. This permission is provided and described in each species’ respective recovery strategy, which may change over time. The Species at risk public registry contains up-to-date information.
Mandatory prohibitions do not apply to species listed as special concern. Therefore, licence holders do not need to receive SARA permits for fishery interactions with Atlantic wolffish or other special concern species.
There are currently no activities permitted under Section 83(4) of SARA as they relate to the North Atlantic right whale (NARW) nor northern bottlenose whale.
4.7.4 Marine mammals
Fishing can present a threat to marine mammals as a result of vessel strikes and entanglement in fishing lines. Standard operating procedures for setting and retrieving gear have been developed in some LFAs to reduce the potential for entanglement and in all LFAs licence holders have been encouraged to minimize the amount of fishing line floating at the surface. In some LFAs, licence holders have agreed to a maximum distance between primary and secondary buoys.
Roseway Basin, which overlaps with LFAs 33, 34 and 40, has been identified as critical habitat for NARWs. Grand Manan Basin, which overlaps with LFAs 34 and 38, has also been identified as critical habitat. NARWs have typically been present in the waters of Maritimes Region from June through December and as a result their presence has not overlapped with most of the lobster fishing activity. Nevertheless, additional surveillance is conducted at the start of the fishing season in the Bay of Fundy and delays in the opening of the lobster seasons are considered if NARW are present. In-season closures are also considered. In 2018, the department closed an area within Roseway Basin to fixed gear fishing for a period of 16 days because of the presence of NARWs. There were also 2 closures in 2018 to fixed gear fisheries in Grand Manan Basin, 1 for 16 days and the other for 30 days. Only the 16 day closure in Grand Manan Basin affected the lobster fishery, as the other closures occurred when the commercial lobster seasons were closed.
Research is being undertaken in many fixed gear fisheries in Canada and abroad to better understand the risks that fishing activity presents to marine mammals and to develop innovations that will reduce the risk and/or severity of entanglements. The department is working with the industry in all LFAs on gear-related measures to reduce risk in the lobster fishery.
4.8 LFA 40
In 1979, DFO established a rectangular, regulatory closed area on Browns Bank, identified as LFA 40, to protect lobster brood stock (see Figure 2). The closure continues to remain in effect and is 1 of the conservation measures in both the inshore and offshore lobster fisheries for promoting lobster productivity. The closure encompasses all portions of Browns Bank shallower than 50 fathoms and straddles the inshore/offshore line, with approximately 57% of its area in LFA 34 and 43% in LFA 41. The closure does not affect other fishing gear sectors.
4.9 Marine conservation targets
In October 2017, the Government of Canada announced that it has reached its first milestone of protecting 5% of marine and coastal areas. The federal government remains committed to protecting 10% of Canada’s marine and coastal areas by 2020. The 2020 target is both a domestic target (Canada’s Biodiversity Target 1) and an international target as reflected in the Convention on Biological Diversity’s Aichi Target 11 and the United Nations General Assembly’s 2030 Agenda for Sustainable Development under Goal 14. The 2017 and 2020 targets are collectively referred to as Canada’s marine conservation targets. For more information on the background and drivers for Canada’s marine conservation targets, visit Meeting Canada’s marine conservation targets.
To meet these targets, Canada is establishing Marine Protected Areas (MPAs) and other effective area-based conservation measures (other measures, also known as marine refuges), in consultation with industry, non-governmental organizations and other interested parties. See Marine protected areas (MPAs), areas of interest (AOIs) and other measures for an overview of these tools, including a description of the role of fisheries management measures that qualify as other measures.
Specific management measures established for the inshore lobster fishery have been identified to contribute to Canada’s marine conservation targets. These management measures consist of the Musquash Estuary MPA (LFA 36), St. Anns Bank MPA (LFA 27) and 3 sensitive benthic area closures that are considered marine refuges (see sub-section 4.10).
4.10 Sensitive benthic areas
Canada is committed under United Nations Resolution 61/105, to protecting marine habitats that are particularly sensitive to fishing. A principal policy for meeting this commitment in Canadian waters is DFO’s Policy for Managing the Impacts of Fishing on Sensitive Benthic Areas (SBA Policy). The SBA Policy requires that mitigation measures be considered where there is a risk that bottom-contact fishing will cause serious or irreversible harm to ecologically or biologically significant areas. Currently, several important coral and sponge grounds in Maritimes Region are closed to bottom contact fishing under this policy. There are 3 that fall within the fishing grounds of the inshore lobster fishery: the Emerald Basin Sponge Conservation Area (in LFAs 32 and 33); the Sambro Bank Sponge Conservation Area (in LFA 33); and the Jordan Basin Conservation Area (in LFA 34).
4.11 Gear impacts
As discussed in Section 2.1.1 Stock assessment, adult lobsters can be found on all bottom types (e.g., cobble, ledge, mud, sand and gravel). In high energy areas, particularly mud and sand, natural sediment movements have a significantly greater impact than lobster traps. The spatial scale of the trap foot print is small and traps are weighted in order to minimize movement due to currents. As a result, the area of potential damage on the marine ecosystem, including the benthic habitat, is likely to be insignificant compared to other types of fishing gear. Trap impacts do however, depend on density of placement and frequency of trap hauls (see Section 2.2.4) and the potential impact of the tens of millions of trap hauls in a year throughout the entire Maritimes Region is not fully understood.
4.12 Market access
4.12.1 European Union and IUU fishing
The European Union introduced regulations effective January 2010 that require Canadian fish and seafood products to have a government validated catch certificate attesting that the product is from a non-IUU fishery (illegal, unregulated and unreported fishery). Live lobster is not exempt from this requirement.
DFO has created a new Catch Certification Office (CCO) and that provides client services to those in the fishing industry affected by this regulation. These services are through a web-based system (called the Fisheries Certificate System) that accepts applications from industry with validation from the CCO and then audit and verification by enforcement employees. The first official catch certificate under the European Union IUU catch regulation was issued successfully on January 1, 2010. More information can be found on online.
4.12.2 Paralytic shellfish poisoning
Paralytic Shellfish Poisoning (PSP) is a serious illness caused by eating shellfish contaminated with algae that contains a toxin harmful to humans. When algae levels elevate in marine waters the condition is sometimes referred to as a red tide. In July 2008, after testing United States lobster samples, the United States Food and Drug Agency advised the public against consuming lobster hepatopancreas from the East Coast (including Canada) due to elevated levels of PSP. Subsequently, Japan implemented mandatory testing of hepatopancreas in shipments of lobsters from Canada to verify compliance with Japan’s Food Sanitation Law. This mandatory testing slowed the release of the product to market and if tested positive was refused entry to Japan.
In response to requirements by the Japanese government, a survey was conducted throughout the Maritimes to determine the distribution and levels of PSP. Canada and Japan have agreed upon a certification process whereby exporters test their own shipments and obtain export certificates through the Canadian Food and Inspection Agency (CFIA). Although random shipments may be tested, this allows for the unrestricted flow of product into Japan.
4.12.3 Ecolabelling
The Marine Stewardship Council (MSC) is an international, non-profit organization that administers a widely recognized environmental certification and eco-labeling program for wild capture fisheries. MSC-certified fish products are said to come from fisheries that meet standards for sustainable fishing. In 2015, the inshore lobster fisheries in Maritimes, along with those in Gulf Region, were certified as sustainable by the MSC. The application for assessment was submitted by the Nova Scotia and New Brunswick Lobster Eco-Certification Society, a group of harvesters, buyers, shippers and processors that was formed in order to pursue their mutual interest in eco-certification. In order to maintain the certification, the industry has been required to satisfy conditions related to the specification of research objectives, species used for bait, bycatch monitoring and harvest control rules. The department is working with the industry to meet conditions where these are aligned with DFO policies and priorities. Additional information about the MSC is available online.
4.12.4 Transboundary
In October 1984, a binding decision by the International Court of Justice (ICJ) decision established the official boundary between Canada and the United States (US) in the Gulf of Maine, known as the Hague Line. The ICJ decision did not address overlapping claims within the 12 mile limit. As a result, an area of approximately 259 km² surrounding Machias Seal Island remains in dispute. The authority for the Canadian claim is found in the Oceans Act , Fishing Zones of Canada (Zone 4 and 5) Order. The authority for the US claim is taken from the US Federal Register/Vol. 60: No 163/ Wednesday August 23, 1995 / Notices. 43825 .
In the late 1990s, Maine lobster harvesters significantly increased their effort in the Disputed Zone, causing considerable concern for adjacent Canadian lobster harvesters. Discussions between officials and licence holders have failed to achieve a consensus on the management of this area. Since 2002, DFO has authorized LFA 38 licence holders to fish during the summer so as to provide year-round Canadian fishing access within the Disputed Zone (Area 38B).
Canada-US enforcement collaboration has included an annual joint enforcement planning meeting between Department of Marine Resources, National Oceanic and Atmospheric Administration and DFO. In addition, DFO Conservation and Protection officials, the Canadian Coast Guard Captains and the State of Maine Department of Marine Resources have a joint planning approach for vessel patrols providing a strong enforcement presence throughout the Disputed Zone.
5. Obectives
Management planning involves the specification of objectives (what you want to achieve), of strategies (what will be done to achieve these objectives) and of tactical management measures (how the strategies will be implemented). It is impractical to pursue conservation in isolation from the economic, social and cultural aspirations of users and these must be recognized in any plan if it is to be successful. This section therefore presents objectives for both the conservation aspects of the fishery and the social, cultural and economic aspects. Section 6 presents the strategies associated with these objectives and Section 7 presents the tactical management measures that will be adhered to for the duration of this plan.
5.1 Conservation objectives
Any commercial fishing will have some level of negative impact on the ecosystem. The intent of DFO’s conservation objectives is to limit negative impacts on the ecosystem (i.e. on harvested stocks, non-harvested stocks or the habitats on which stocks rely). DFO is committed to managing in an environmentally sustainable manner while recognizing the economic importance of this industry to multiple stakeholders. The overarching conservation objective is to allow sustainable use that safeguards ecological processes and genetic diversity for present and future generations.
More specifically, DFO’s conservation objectives are as follows:
- Do not cause unacceptable reduction in productivity so that components can play their role in the functioning of the ecosystem
- Do not cause unacceptable reduction in biodiversity in order to preserve the structure and natural resilience of the ecosystem
- Do not cause unacceptable modification to habitat in order to safeguard both physical and chemical properties of the ecosystem.
Productivity is currently the primary conservation objective for the Maritimes Region inshore lobster fishery and achieving this objective is critical. A discussion on reproductive productivity is in Section 2.1.4 Reproductive potential. Background on species productivity for lobster is available in the FRCC reports of 1995 and 2007, as well as in the 2001 Report of the Lobster Conservation Working Group.
5.2 Social, cultural and economic objectives
A departmental social, cultural and economic objective is to support healthy and prosperous Aboriginal communities and to ensure respect for the constitutional protection afforded Aboriginal and treaty rights.
A second objective is to help create the circumstances for economically prosperous fisheries. The commercial fishing industry generates economic benefits for Canadian businesses and supports many coastal communities. Ultimately, the economic viability of the commercial fishery depends on the industry itself. However, the department is committed to managing the commercial fishery in a manner that helps its members be economically successful while using the ocean’s resources in an environmentally sustainable manner. The overarching social, cultural and economic objective is thus to help create the circumstances for economically prosperous fisheries wherein fishing enterprises are more self-reliant, self-adjusting and internationally competitive.
The Economic Profile of the Maritimes Region Inshore Commercial Lobster Fishery, written by the Policy and Economics Branch of DFO, Maritimes Region, provides an in-depth review of the contribution the Maritimes Region lobster fishery makes to our social, cultural and economic objectives.
6. Strategies
While the above objectives may be considered to be general statements, they are translated into practical terms through the definition of strategies. The strategies outlined in this IFMP constitute what is being done to manage pressures imposed by fishing activities in order to control their impact on valued fish population and ecosystem attributes. Such pressures include fishing mortality, disturbance of bottom habitat and introduction of pollutants. Fish population attributes include spawning biomass, size/age structure, genetic diversity. Similarly, ecosystems attributes include the area of a particular habitat type and the balance of predators to prey.
DFO is making efforts to identify ecologically or biologically sensitive areas (EBSAs), ecologically or biologically sensitive species (EBSSs), depleted species and degraded areas that are also viewed as attributes of an ecosystem.
Strategies define how the pressures imposed by human activities will be managed, e.g. what level of fishing mortality is viewed as acceptable and how much bottom habitat disturbance is too much. This is done by using references that define pressure levels that cause unacceptable or undesirable impacts on valued ecosystem attributes. The basis for determining references will vary depending on the state of knowledge. Some may be chosen fairly arbitrarily when knowledge is weak, perhaps based on historical trends. When more is known, their determination may involve evaluation of alternative population/ecosystem dynamics models, ranging from single species to full ecosystem models. There are many gaps in scientific knowledge of ecosystem structure and function and no matter how references are determined they will need revision as the human and environmental factors affecting ecosystems become better understood.
6.1 Conservation strategies
Explicit strategies (with specified references where these have been developed) have been developed for the key pressures imposed by the inshore lobster fishery, as follows.
Productivity
- Keep lobster fishing mortality moderate
- Keep fishing mortality moderate for bycatch species, i.e. Jonah crab, rock crab
- Allow sufficient escapement from exploitation for spawning
- Limit disturbing activity during important reproductive seasons
As discussed in Section 2, the strategy for moderating lobster fishing mortality is provisional. Work is ongoing to refine the strategy in accordance with the department’s policy on the precautionary approach.
In addition, consideration will need to be given to accounting for incidental mortality from lost lobster traps as well as to developing reference points for the retained bycatch species.
Biodiversity
- Control unintended incidental mortality of North Atlantic right whales
- Control unintended incidental mortality of other species
The contribution of the inshore lobster fishery to the mortality of NARWs cannot be quantitatively measured. Nevertheless, since right whales are endangered, efforts will continue to keep interactions with them as low as practicable.
The need to develop more specific strategies and reference points for other species will be considered as the impact of the inshore lobster fishery on bycatch becomes better understood. Additional data on discards from the fishery was collected in 2009/10 and more comprehensive data collection has been initiated across the region.
Habitat
- Manage area disturbed of bottom habitat
- Limit introduction of pollutants
- Minimize introduction of debris
Currently there are 2 MPAs and 3 sensitive benthic area closures within the inshore lobster fishing grounds. Overviews of these conservation areas and associated objectives are available online.
Other strategies for protecting habitat are to limit the introduction of pollutants and debris (oils, plastic straps, bait boxes, tags, etc.) from the large number of vessels used in this fishery.
6.2 Social, cultural and economic strategies
In the inshore lobster fishery, the strategy for supporting healthy and prosperous Aboriginal communities is as follows:
- Respect Aboriginal and treaty rights; and
- Facilitate Aboriginal participation in fisheries and associated economic opportunities.
The strategies for achieving the more general prosperity objective are as follows:
- Offer flexibility in policy and licensing to individual enterprises/licence holders
- Promote stability in access to resources and allocations
- Provide internal mechanisms that allow self-adjustment of capacity to resource availability
- Support certification for sustainability.
These strategies reflect some of the recommendations from the AFPR, which has been subsumed within the broader Fisheries Renewal initiative. Among other things, AFPR emphasized the need for flexibility in policy and licensing and stability in access to resources and allocations. Fisheries Renewal recognizes that strategies such as these will improve the ability of fishing enterprises to adapt to changing resource and market conditions and to respond to market opportunities. These are particularly important to the inshore lobster fishery, which historically has been a cyclic fishery both in abundance and in market price. The fleet requires methods to adapt to both good and bad conditions
In addition, the region’s strategies for supporting economic prosperity reflect the increasingly conservation orientated environment in which the fishing industry operates. Fish harvesters face increasing domestic and international pressure to demonstrate the sustainability of their operations with respect to both the target species and the ecosystem more broadly. Continued access to some markets hinges on this. In this context, the department is committed to supporting fleets seeking environmental certification and, in this way, to helping maintain access to international and domestic markets.
7. Tactical and management measures for the duration of the plan
Tactical management measures are how the strategies will be implemented to manage the pressures imposed by fishery activities. The principal tactical management measures that will be applied in this fishery to implement the key strategies identified above are described here. (Note that tactics may regulate more than 1 pressure. They are listed here under the strategies with which they are most strongly associated.)
Productivity
Keep lobster fishing mortality moderate
- Limited entry
- Prescribed access areas (LFAs)
- Trap limits
- Minimum legal sizes
- Window in some LFAs (i.e. release of mid-sized lobsters)
- Seasons (i.e. closures during spawning/molting/extrusion periods)
- Gear fitted with escape vents and biodegradable panels
- Studies on improving gear efficiency and selectivity
Keep fishing mortality moderate for bycatch
- Minimum legal size of Jonah crab
- Gear fitted with escape vents and biodegradable panels
Allow sufficient escapement from exploitation for spawning
- Release of berried female lobsters
- V-notching of berried female lobsters
- Release of female Jonah and rock crab
Biodiversity
Control unintended incidental mortality of NARWs
- Voluntary standards of practice developed with the World Wildlife Federation (e.g., avoidance protocols, gear setting techniques)
- Outreach and information provided to harvesters
Control unintended incidental mortality for other species
- Gear fitted with escape vents and biodegradable panels
- Completion of SARA monitoring documents
Habitat
Manage area disturbed of bottom habitat
- Coral and sponge closures
- MPAs
- Gear handling (weighted traps, proper hauling)
Limit introduction of pollutants
- Periodic reminders at meetings of proper disposal of waste material
- Minimize introduction of debris
Prosperity
Facilitate Aboriginal participation in fisheries and associated economic opportunities and in the management of aquatic resources
- Provide for FSC fisheries for Indigenous communities
- Build on the Marshall Response Initiative through further programming and initiatives
Offer flexibility in policy and licensing
- Maintain the allowance for the formation of partnerships and stacking of licences so fleets may rationalize capacity during periods of changing price or abundance
Promote stability in access to resources and allocations
- Limit entry to fishery through licensing policy so that licence holders may develop long-term business plans
Allow self-adjustment of capacity to resource availability
- Maintain the allowance for the formation of partnerships and stacking of licences so fleets may rationalize capacity during periods of changing price or abundance
Support certification for sustainability
- Work with the industry to develop a framework for bycatch monitoring and to develop harvest control rules
7.1 Harvest control rules
Harvest control rules (HCRs) compliant with the PA Policy were adopted in 2019 (LFAs 27-33) and 2020 (LFAs 34-38) following updated reference points provided through the framework assessments and subsequent consultation.
The HCRs are pre-agreed decision rules that state what actions will be taken should there be a decline in stock status or should exploitation exceed the removal reference. The HCRs leave the choice of controls for achieving reductions in exploitation open so that the economic and biological factors in play at the time that the reductions are needed can be considered. This means that no decisions have been made at this time on the specific controls that may be implemented in the future. Nevertheless, it has been agreed that controls will be chosen from among those that form part of the current management framework for the inshore lobster fisheries in the Region.
A detailed description of the HCRs is available in Appendix 5 (LFAs 27-33) and Appendix 6 (LFAs 34-38).
8. Access and allocation
In 1990, the Supreme Court of Canada ruled that members of the Musqueam band had an Aboriginal right to fish for FSC purposes. As a response to that decision, DFO launched the Aboriginal Fisheries Strategy, which provided members of Aboriginal groups access to fisheries resources for FSC purposes. DFO recognizes this FSC access to fishery resources has priority over other allocations, provided conservation of the stock is not an issue. Within this principle, DFO provides regulated access to lobster for Aboriginal people to provide for some of their FSC needs.
Commercial access to this resource is managed as a limited entry, competitive fishery. Access is provided through commercial licences identified as Category A licences, Category B licences (1/3 the number of traps of a Category A licence) or partnerships (1.5 times the number of traps of a Category A licence). First Nations organizations are provided commercial access through communal commercial licences equivalent to Category A licences, with flexibility in how the licences are fished.
There is no recreational access.
Note that the Minister can, for reasons of conservation or for any other valid reasons, modify access, allocations and sharing arrangements as outlined in this IFMP in accordance with the powers granted pursuant to the Fisheries Act .
9. Shared stewardship arrangements
As with other fisheries in Maritimes Region, the advisory committee process is the primary consultation forum for the inshore lobster fishery. Committees typically consist of representatives of industry, Aboriginal communities, provincial governments, community stakeholders, non-governmental organizations and DFO. Harvester representatives generally include elected port representatives (or an alternate). Advisory committees provide an interface for discussion on issues, such as conservation, protection, science and fisheries management. Many day-to-day management concerns are addressed through the work of these committees. In addition to advisory committees other committees are place to discuss specific matters including science and enforcement and DFO engages in issue specific consultation, formally and informally, on an ongoing basis.
10. Compliance plan
10.1 Conservation and Protection program description
The management of Canadian fisheries requires an integrated approach to monitoring, control and surveillance that involves the deployment of fishery officers to conduct at-sea boardings and aerial surveillance, land patrols, dockside monitoring audits, as well as plant and harvester inspections.
Conservation and Protection (C&P) activities are designed to ensure compliance with the legislation, policies and fishing plans as they relate to conservation and the sustainable use of the resource. The C&P National Compliance Framework describes a 3 pillar approach to the monitoring and enforcement of this and other fisheries. The pillars are Education/Shared Stewardship, Monitoring Control and Surveillance and Major Case Management.
10.2 Regional compliance program delivery
Compliance in the inshore lobster fishery is achieved through the application of the Fisheries Act, the Fishery (General) Regulations, the Atlantic Fishery Regulations and the Aboriginal Communal Fishing Licences Regulations.
The following offers a general description of Monitoring, Control and Surveillance (MCS) activities carried out by C&P in the inshore lobster fishery.
- Fishery Officers perform routine vessel, vehicle, aerial and foot patrols. During these patrols, officers conduct regular inspections of fish harvesters and buyers to check gear, catches, licences, logbooks and compliance with release requirements.
- Fishery Officers use a number of investigative techniques when dealing with reports of fraud and collusion. This often involves a cooperative approach along with interactions and communication with other federal, provincial and municipal government agencies and partners.
- C&P designates dockside and at-sea observers (third parties). These designations are subject to individuals meeting background checks and eligibility criteria and require the successful completion of exams. C&P monitors program standards for the dockside monitoring program (DMP) through audits and may initiate corrective actions if a dockside observer is found to be deficient in the performance of their duties.
10.3 Consultation
Shared stewardship and education are achieved in the inshore lobster fishery through a renewed emphasis on the importance of communication with the community at large, including the following:
- Presentations to client/stakeholder groups;
- Informal interaction with all parties involved in the fishery on the wharf, during patrols or in the community to promote conservation;
- Participation by C&P supervisors in advisory meetings with industry to provide information regarding compliance concerns and to solicit input from stakeholders in relation to monitoring, control and surveillance activities;
- Internal consultation with Resource Management and other DFO branches to assess the effectiveness of enforcement activities and to develop recommendations for the upcoming season; and
- Direction by C&P of approximately 2,000 hours per year to compliance promotion through stakeholder meetings, public relations and school visits (for all fisheries).
10.4 Compliance program performance
In recent years, C&P has been building its intelligence and major case management capability for all fisheries. The program is moving toward increased intelligence gathering, specialized investigations, retroactive review of suspected illegal activity and broadening the scope of inspections to include buyers, plants and transportation. Some of this work has focused on the inshore lobster fishery. A summary of officer time, violations and penalties is presented in Appendix 4.
10.5 Current compliance issues
The exceeding of trap limits with untagged and tagged gear, fishing in closed or unauthorized areas and the retention of incidental catch to rebait traps (rather than returning it to the water) are 3 enforcement concerns that exist in all LFAs. Fishing in closed or unauthorized areas includes fishing during a closed time, fishing in an area that the licence holder is not authorized to fish in and fishing in closed areas (e.g., a marine protected area). Species such as cod, snow crab, winter flounder and female rock and Jonah crab are examples of some of the incidentally caught species that are used as bait and not returned to the sea as required by regulations.
Illegal fishing in all of its forms is a serious threat to the orderly management and control of the inshore lobster fishery. In 2018, lobster prices ranged from $6.50 to $9.00 per pound ($14.50-$20.00 per kg) depending on the time of the year and quality of lobster. The high prices paid as well as cash sales for lobster afford a substantial financial incentive to engage in the illegal harvesting of lobster within this region. These higher prices are related to increased demand for the export lobster market. This kind of activity negatively affects future management goals that are set by industry and Fisheries Management.
Other enforcement concerns include the removal of eggs from egg bearing female lobsters; the retention of lobsters that are less than the minimum legal size; and the accurate and timely completion and submission of harvest data.
A review of violations for the period of 2015 to 2017 suggests that non-compliance in the inshore lobster fishery is largely related to the use of illegal gear (traps that exceed the trap limit and traps built in a manner that does not meet legal requirements for lobster traps) and fishing in an unauthorized area or during a closed time. See Appendix 4 for a list of inshore lobster violations by issue and a list of violations by action taken.
To be effective in deterring non-compliance, the efforts taken by C&P must demonstrate that the likelihood of violations being detected is high and that serious violations will result in penalties being imposed. The responses to non-compliance include warnings, tickets or prosecution. Targeted efforts are taken to determine the level of compliance in this fishery and to set targets for an acceptable level of compliance that is achievable given the availability of resources for the program.
10.6 Compliance strategy
Based on established regional compliance priorities, C&P detachment supervisors prepare annual work plans and allocate human, material and financial resources based on an assessment of compliance risks in each fishery.
Inshore lobster compliance challenges and strategies
Compliance risks
- Illegal use of gear/bait
- Untagged gear
- Unauthorized gear use
- Illegal retention for use as bait
- Closed area and time issues
- Fishing in an area without license
- Fishing in closed area/time
- Catch and reporting issues
- Fraud and collusion
- Unreported sales
- Improper logbook
Mitigating strategies
- Engagement, education and communication with industry
- Conduct patrols and inspections using available intelligence.
- Traceability of legal sales
- Use major case investigations when appropriate
- Collaborative work with other federal, provincial and municipal agencies and departments
11. Performance review
It is crucial to effective management that there be evaluations of the performance of sector plans, or specific elements of them, to determine whether the rules and regulations that were employed are being effective and thus that the strategies in the overall plan are being adequately implemented in that sector. The general plan evaluation will determine whether:
- The plan identifies and addresses all the important impacts on the ecosystem
- The strategies are doing their job in meeting the plan objectives
- The strategies are being implemented satisfactorily overall
Long-term objectives for the IFMP centre on maintaining viability of the stock and existing fleet, promoting shared stewardship and optimizing benefits for participants and local communities. Evaluation criteria include:
- Collection of catch and effort information through monitoring documents
- Dockside checks by DFO employees
- Essential data to assess the health of the lobster stock collected and supplied to Science
- Communications to industry
- Feedback from industry
- Overall adherence to the plan
The development of a precautionary approach with identification of effective measures will be a major performance indicator.
12. Monitoring
For reviews of performance evaluation and compliance with tactical management measures to be possible, it is necessary to collect the appropriate data that provide information on how well or badly the various features of the plan are performing.
13. Plan enhancement
These areas for enhancement have been identified:
- Improve data quality
- Improve protection for mature females
- Improve governance
Efforts to develop a framework for development and implementation of the precautionary approach for this fishery are underway. Progress in this regard is expected to advance the efforts to achieve both conservation and socio-economic goals.
Appendix 1 - Glossary
Aboriginal traditional knowledge (ATK): Knowledge that is held by, and unique to, Aboriginal peoples. It is a living body of knowledge that is cumulative and dynamic and adapted over time to reflect changes in the social, economic, environmental, spiritual and political spheres of the Aboriginal knowledge holders. It often includes knowledge about the land and its resources, spiritual beliefs, language, mythology, culture, laws, customs and medicines.
Abundance: Number of individuals in a stock or a population
Age composition: Proportion of individuals of different ages in a stock or in the catches
Biomass: Total weight of all individuals in a stock or a population
Catch per unit effort (CPUE): The amount caught for a given fishing effort, ex., pounds of lobster per trap haul
Communal commercial licence: Licence issued to Aboriginal organizations pursuant to the Aboriginal Communal Fishing Licences Regulations for participation in the general commercial fishery
Committee on the Status of Endangered Wildlife in Canada (COSEWIC): Committee of experts that assess and designate which wild species are in some danger of disappearing from Canada
Discards: Portion of a catch released back to the water after they are caught in fishing gear.
Dockside monitoring program (DMP): A monitoring program that is conducted by a company that has been designated by the department, which verifies the species composition and landed weight of all fish landed from a commercial fishing vessel and/or inputs data from monitoring documents
Ecosystem-based management: Taking into account species interactions and the interdependencies between species and their habitats when making resource management decisions
Fishing effort: Quantity of effort using a given fishing gear over a given period of time
Fixed gear: A type of fishing gear that is set in a stationary position (including lobster traps)
Food, social and ceremonial (FSC): A fishery conducted by Aboriginal groups for food, social and ceremonial purposes
Landings: Quantity of a species caught and landed
Mesh size: Size of the mesh of a net. Different fisheries have different minimum mesh size regulation
Mobile gear: A type of fishing gear that is drawn through the water by a vessel to entrap fish, including otter trawls and Danish/Scottish seines
Nominal value: The dollar value realized in a given year without adjustment for inflation
Observer coverage: When a licence holder is required to carry an officially recognized observer onboard their vessel for a specific period of time to verify the amount of fish caught, the area in which it was caught and the method by which it was caught. Observers may also be used to witness removal of tags and retagging of lobster gear.
Population: Group of individuals of the same species, forming a breeding unit and sharing a habitat
Precautionary approach: Set of agreed cost-effective measures and actions, including future courses of action, which ensure prudent foresight, reduce or avoid risk to the resource, the environment and the people, to the extent possible, taking explicitly into account existing uncertainties and the potential consequences of being wrong
Recruitment: Amount of individuals becoming part of the exploitable stock, e.g., that can be caught in a fishery
Research survey: Survey at sea, on a research vessel, allowing scientists to obtain information on the abundance and distribution of various species and/or collect oceanographic data. (i.e., bottom trawl survey, plankton survey, hydroacoustic survey, etc.)
Species at Risk Act (SARA): The Act is a federal government commitment to prevent wildlife species from becoming extinct and secure the necessary actions for their recovery. It provides the legal protection of wildlife species and the conservation of their biological diversity
Spawning stock: Sexually mature individuals in a stock
Stock: Describes a population of individuals of 1 species found in a particular area and is used as a unit for fisheries management, eg. NAFO area 4R herring
Stock assessment: Scientific evaluation of the status of a species belonging to a same stock within a particular area in a given time period
Traditional ecological knowledge (TEK): A cumulative body of knowledge and beliefs, handed down through generations by cultural transmission, about the relationship of living beings (including humans) with 1 another and with their environment
Tonne: Metric tonne, which is 1,000kg or 2,204.6lbs
Validation: The verification, by an observer, of the weight of fish landed
Vessel size: Length overall
Year-class: Individuals of a same stock born in a particular year. Also called cohort
Appendix 2 - References
Aiken, D. E. and S. L. Waddy (1986). “Environmental influence on recruitment of the American lobster, Homarus americanus: a perspective.” Canadian Journal of Fisheries & Aquatic Sciences 43(11): 2258-2270.
Benestan L, et al. 2015. RAD genotyping reveals fine‐scale genetic structuring and provides powerful population assignment in a widely distributed marine species, the American lobster (Homarus americanus). Molecular Ecology 25(7) 1626-1629.
Campbell, A. (1983). “Growth of tagged American lobsters, Homarus americanus, in the Bay of Fundy.” Canadian Journal of Fisheries & Aquatic Sciences 40(10): 1667-1675.
Campbell, A. (1986). “Migratory movements of ovigerous lobsters, Homarus americanus, tagged off Grand Manan, Eastern Canada.” Canadian journal of fisheries and aquatic sciences 43: 2197-2205.
Carter, J. A. and D. H. Steele (1982). “Stomach Contents of Immature Lobsters (Homarus americanus) From Placentia Bay, Newfoundland.” Canadian Journal of Zoology/Revue Canadienne de Zoologie 60(3): 337-347.
Chiarella, L. A., D. K. Stevenson, et al. (2005). “Results of a Workshop on the Effects of Fishing Gear on Benthic Habitats off the Northeastern United States.” American Fisheries Society Symposium 41: 833-834. 2005.
Cook, A.M., Hubley, P.B., Denton, C., and Howse, V. 2020. 2018 Framework Assessment of American Lobster (Homarus americanus) in LFA 27–33. DFO Can. Sci. Advis. Sec. Res. Doc. 2020/017. vi + 251 p.
Comeau, M. and F. Savoie (2001). “Growth increment and molt frequency of the American lobster (Homarus americanus) in the southwestern Gulf of St. Lawrence.” Journal of Crustacean Biology 21(4): 923-936.
Comeau, M. and F. Savoie (2002). “Maturity and reproductive cycle of the female American lobster, Homarus americanus in the southern Gulf of St Lawrence, Canada.” Journal of Crustacean Biology 22(4): 762-774.
DFO (2009). Biological Basis for the Protection of Large Lobsters in Lobster Fishing Areas 33 to 38. DFO Can. Sci. Advis. Sec. Sci. Resp. 2008/017 16p.
DFO. 2010. Assessment of Scallops (Placopecten magellanicus) in Scallop Fishing Area (SFA) 29 West of Longitude 65 30'W. DFO Can. Sci. Advis. Sec. Sci. Advis. Rep. 2010/039.
DFO. 2010. Potential impacts of fishing gears (excluding mobile bottom-contacting gears) on marine habitats and communities. DFO Can. Sci. Advis. Sec. Sci. Advis. Rep. 2010/003.
DFO. 2012. Reference points consistent with the precautionary approach for a variety of stocks in the Maritimes Region. DFO Can. Sci. Advis. Sec. Sci. Advis. Rep. 2012/035.
Drinkwater, K., C. Hannah, et al. (2001). Modelling the Drift of Lobster Larvae off Southwest Nova Scotia Canadian Science Advisory Secretariat Research Document. 2001/51: 32.
Drinkwater, K. F., M. J. Tremblay, et al. (2006). “The influence of wind and temperature on the catch rate of the American lobster (Homarus americanus) during spring fisheries off eastern Canada.” Fisheries Oceanography 15(2): 150-165.
Elner, R. W. and A. Campbell (1987). “Natural diets of lobster Homarus americanus from barren ground and macroalgal habitats off southwestern Nova Scotia, Canada.” Marine ecology progress series. Oldendorf 37(2-3): 131-140.
Eno, N., D. S. Macdonald, et al. (2001). “Effects of crustacean traps on benthic fauna.” ICES Journal of Marine Science 58(1): 11-20.
Fogarty, M. J. and J. S. Idoine (1988). “Application of a yield and egg production model based on size to an offshore American lobster population.” Transactions of the American Fisheries Society 117(4): 350-362.
Gendron, L., P. Fradette, et al. (2001). “The importance of rock crab (Cancer irroratus) for growth, condition and ovary development of adult American lobster (Homarus americanus).” Journal of Experimental Marine Biology and Ecology 262(2): 221-241.
Harding, G. C. (1992). American lobster (Homarus americanus Millne Edwards): A discussion paper on their environmental requirements and the known anthropogenic effects on their populations: Canadian technical report of fisheries and aquatic sciences/Rapport technique canadien des sciences halieutiques et aquatiques 1992.
Kenchington, E. L., G. C. Harding, et al. (2009). “Pleistocene glaciation events shape genetic structure across the range of the American lobster, Homarus americanus.” Molecular Ecology 18(8): 1654-1667.
Lavalli, K. L. and P. Lawton (1996). “Historical review of lobster life history terminology and proposed modifications to current schemes.” Crustaceana 69(5): 594-609.
Morgan, L. E. and R. Chuenpagdee (2003). Shifting gears: addressing the collateral impacts of fishing methods in U.S. waters. Pew science series on conservation and the environment, Pew science series on conservation and the environment, Environment Division Pew Charitable Trusts.
Pezzack, D.S., C.M. Denton and M.J. Tremblay (2014). “Overview of By-catch and Discards in the Maritimes Region Lobster Fishing Areas (LFAs) 27-33 based on Species at Risk Act(SARA) At-sea Sampling 2009-2010. DFO Can. Sci. Advis. Sec. Res. Doc. 2014/040. V + 27 p.
Pezzack, D. S. and D. R. Duggan (1986). “Evidence of migration and homing of lobsters (Homarus americanus) on the Scotian Shelf.” Canadian Journal of Fisheries & Aquatic Sciences 43(11): 2206-2211.
Pugh T. L. 2014. The potential for sperm limitation in American lobsters (Homarus americanus) as indicated by female mating activity and male reproductive capacity. Doctoral dissertation, University of New Hampshire, Durham, NH.
Tremblay, J., D. Pezzack, C. Denton, A. Reeves, S. Smith, A. Silva and J. Allard. 2011. Framework for assessing lobster off the coast of eastern Cape Breton and the eastern and south shores of Nova Scotia (LFAs 27-33). DFO Can. Sci. Advis. Sec. Res. Doc. 2011/058.
Tremblay, M.J., Pezzack, D.S. and Gaudette, J. 2012. Development of Reference points for Inshore Lobster in the Maritimes Region (LFAs 27-38). DFO Can. Sci. Advis. Sec. Res. Doc. 2012/028. iv + 18 p.
Waddy, S. L. and D. E. Aiken (1986). “Multiple fertilization and consecutive spawning in large American lobsters, Homarus americanus.” Canadian Journal of Fisheries and Aquatic Sciences 43(11): 4.
Waddy, S. L. and D. E. Aiken (1990). “Intermolt insemination, an alternative mating strategy for the American lobster (Homarus americanus).” Canadian Journal of Fisheries and Aquatic Sciences 47(12): 2402-2406.
Waddy, S. L. and D. E. Aiken (1991). Egg production in the American lobster, Homarus americanus. Crustacean Egg Production A. Wenner and A. Kuris.
Xue, H., L. Incze, et al. (2008). “Connectivity of lobster populations in the coastal Gulf of Maine. Part I: Circulation and larval transport potential.” Ecological Modelling 210(1-2): 193-211
Appendix 3 - Annual landed weights and values
| Maritimes region Inshore Lobster | ||
|---|---|---|
| - | Landed weight (t) | Landed value ($M) |
| 1996-97 | 16,215 | 186.6 |
| 1997-98 | 18,400 | 209.6 |
| 1998-99 | 19,736 | 260.7 |
| 1999-00 | 20,554 | 288.2 |
| 2000-01 | 24,369 | 346.1 |
| 2001-02 | 27,549 | 334.8 |
| 2002-03 | 26,020 | 390.6 |
| 2003-04 | 26,254 | 364.8 |
| 2004-05 | 27,231 | 380.4 |
| 2005-06 | 28,523 | 387.5 |
| 2006-07 | 28,888 | 364.7 |
| 2007-08 | 31,518 | 385.7 |
| 2008-09 | 32,274 | 322.3 |
| 2009-10 | 35,056 | 317.4 |
| 2010-11 | 37,419 | 375.4 |
| 2011-12 | 43,714 | 420.0 |
| 2012-13 | 44,029 | 382.6 |
| 2013-14 | 51,408 | 565.0 |
| 2014-15 | 51,965 | 660.1 |
| 2015-16p | 60,819 | 875.9 |
| 2016-17p | 52,852 | 833.3 |
Note: data for most recent years is preliminary
Appendix 4 - C&P statistical summary
| 2015 | 2016 | 2017 |
|---|---|---|
| 28,385 | 28,373 | 21,016 |
Note: The above totals are for the entire Maritimes Region C&P Area
| Year | 2015 | 2016 | 2017 |
|---|---|---|---|
| Vehicles | 248 | 135 | 95 |
| Vessels | 4,199 | 3,535 | 2,527 |
| Persons | 3,131 | 3,474 | 2,636 |
| Gear | 67,202 | 68,375 | 60,741 |
| Site Checks | 8,310 | 7,994 | 6,165 |
| Issue | 2015 | 2016 | 2017 | Average |
|---|---|---|---|---|
| Area/time | - | - | - | - |
| Fish for lobster during a closed time | 74 | 82 | 67 | 74 |
| Illegal gear / gear used Illegally | - | - | - | - |
| Gear used Illegally | 83 | 97 | 43 | 74 |
| Gear conflict | 5 | 1 | 3 | 3 |
| Illegal buy/sell/possess | - | - | - | - |
| Illegal buy sell possess | 131 | 107 | 94 | 111 |
| Illegal export | - | - | 1 | 0.3 |
| Illegal transportation | 1 | - | - | 0.3 |
| Inspection | 2 | 6 | 2 | 3 |
| Species size limit | 33 | 38 | 28 | 33 |
| Registration/licence | - | - | - | - |
| Registration licence | 107 | 205 | 133 | 149 |
| Reporting | 21 | 505 | 35 | 187 |
| Other | - | - | - | - |
| Assault/obstruct | 7 | 5 | 1 | 4 |
| Other legislation | 5 | 6 | - | 4 |
| Total | 469 | 1,052 | 407 | 643 |
Note: This index is derived from the Fishery Officer time tracking system. This includes all violations observed by fishery officers and not just those that resulted in an apprehension, charge or conviction. This index does not consider severity. Fines imposed in the Maritimes Region in accordance to the Fisheries Act are available online.
| Action | 2015 | 2016 | 2017 | Average |
|---|---|---|---|---|
| Charges laid | 185 | 196 | 97 | 159 |
| Charges not approved | 20 | 18 | 9 | 16 |
| Charges pending / under review | 13 | 23 | 34 | 23 |
| Diverted (alternative measures) | 1 | - | 3 | 1 |
| Other | 5 | 7 | 0 | 4 |
| Seizure(s) - personal unknown | 35 | 58 | 50 | 48 |
| Ticket issued | - | 1 | 1 | 0.7 |
| Warning issued | 210 | 749 | 213 | 391 |
| Total | 469 | 1052 | 407 | 643 |
Appendix 5: Harvest Control Rules for LFAs 27-33
The harvest rate strategy and harvest control rules (HCRs) presented in this document have been developed according to Fisheries and Oceans Canada’s A fishery decision-making framework incorporating the precautionary approach (PA Policy).
This document, developed in consultation with industry partners and stakeholders, applies to the commercial lobster fisheries in Lobster Fishing Areas (LFAs) 27 to 33. It came into effect July 2019.
This document does not apply to food, social and ceremonial fisheries for lobster. It is acknowledged that Indigenous rights to fish for food, social and ceremonial purposes will take priority, after conservation, over commercial uses of the lobster resource.
Management objectives
In Maritimes Region, one of the overarching objectives of fisheries management is to not cause unacceptable reductions in productivity so that components of the marine environment can play their role in the functioning of the ecosystem. In LFAs 27-33, this will be achieved through managing the commercial exploitation of lobster and promoting egg production in a manner consistent with the PA Policy and according to the following sub-objectives:
- To maintain a healthy lobster stock;
- To manage the risk of the fishery causing or precipitating a decline in stock status, such that -
- where the stock is high in the healthy zone, the risk is low to moderate;
- where the stock is not high in the healthy zone, the risk is low; and
- To promote recovery of the stock should it fall into the cautious or critical zone.
Harvest control tool box
Currently, the lobster stocks in all LFAs are high in the healthy zone. The HCRs presented herein are pre-agreed decision rules that state what actions will be taken should there be a decline in stock status or should exploitation exceed the removal reference. The HCRs leave the choice of controls for achieving reductions in exploitation open so that the economic and biological factors in play at the time that the reductions are needed, can be considered. This means that no decisions have been made at this time on the specific controls – increase of X mm in the minimum legal size, introduction of a window measure, shortening of the season by X days, etc. – that may be implemented in the future.
Nevertheless, it has been agreed that controls will be chosen from among those that form part of the current management framework for the inshore lobster fisheries in the Region. A list of these controls – the “harvest control tool box” – is presented below.
Input Controls
- Limited entry
- Trap limits
- Fixed seasons
Escapement / Biological Controls
- Release of berried females
- Release of v-notched females
- Minimum legal size
- Maximum legal size (females)
- Window measure (females)
- Area closure (i.e. LFA 40)
- Maximum hoop size
- Escape vent size
Different controls will have different effects on exploitation, and these effects may vary across LFAs. In February 2018, DFO Science provided advice on simulating the effects of changes to minimum and maximum sizes, season lengths and window measures on egg production and landings (Cook, et al. 2020).
Harvest strategy and harvest control rules
Summary
The harvest strategy is to maintain exploitation at or below the removal reference within each LFA. The HCRs, which have been developed for each stock status zone, are summarised in the following table and elaborated upon further below.
Summary of HCRs for the commercial lobster fisheries in LFAs 27-33
Healthy zone
Stock status:
- Above the USR
- Maintain the exploitation rate at or below the removal reference
- Declining and approaching the USR
- Request science advice
- Initiate consultations
- Consider reducing the exploitation rate
Cautious zone
Stock status:
- Below the USR
- Reduce the exploitation rate
- Progressively reduce the exploitation rate as stock status declines
- Midway between the USR and LRP and declining
- Request science advice
- Initiate consultations on a rebuilding plan
- Approaching the LRP
- Prepare to implement rebuilding plan
Critical zone
Stock status: Below the LRP
- Reduce the exploitation rate to the lowest possible level
- Implement the rebuilding plan
For all stock status zones, exploitation rates will be calculated by Science annually based on a three year running median and will be reported on in stock status updates or stock assessments. This will allow for monitoring by the advisory committees of whether exploitation rates are being maintained at or below the removal reference for each stock status zone, and it will allow for evaluating the success of management actions in effecting changes to exploitation rates when these are implemented.
In LFA 28, where exploitation rates and a removal reference have not been developed, management actions will respond to the status of the stock relative to the USR and LRP and data from secondary and contextual indicators.
The HCRs will generally be implemented on an LFA-by-LFA basis. This means that a decline in stock status in one LFA will not automatically necessitate a reduction in exploitation in other LFAs within the same stock assessment unit. Where there is a need to reduce exploitation across more than one LFA, variation in the choice of harvest control(s) will be considered only where the variation will not jeopardize recovery.
The harvest strategy is based on an assumption that changes in stock status can result from changes in the management of the fishery. This is true to some extent. However, environmental factors appear to have a significant effect on the productivity of lobsters. It is therefore possible that the status of the lobster stock will vary as a result of changes in the environment as opposed to changes in fishing pressure. Should it appear that there have been significant changes in lobster productivity to the point that a shift in productivity regimes appears to have occurred, a review will be requested by Science of the reference points in the fishery.
It is anticipated that the duration of the steps required to inform a decision to change harvest controls may take several months. As a result, it is expected that a fishing season will lapse prior to the implementation of any change. For example, if a stock assessment or update identifies that exploitation exceeds the removal reference, a change in management measures to reduce exploitation will be implemented in the year following the updated advice.
Healthy zone
When the stock is in the healthy zone, the advisory committees will monitor the exploitation rate for their LFA in relation to the removal reference. If the exploitation rate exceedsthe removal reference, the advisory committee will discuss and recommend management actions to reduce fishing pressure. If the stock is well into the healthy zone, there will be a greater tolerance for risk. At any time, the advisory committee may also propose a target removal reference and recommend actions for managing the fishery within this lower level of exploitation.
If stock status declines and approaches the USR, there will be a lower tolerance for risk. Advice from Science will be requested, and consultations will be initiated with partners and stakeholders through the advisory committee process. Consultations will focus on the specific changes to harvest controls that will be implemented if stock status falls below the USR. The advisory committee may also recommend changes to harvest controls before stock status reaches the USR in an effort to arrest the decline. In developing recommendations on management actions, the advisory committee will consider the impact of possible actions on egg production and landings, as advised by Science.
Cautious zone
In the cautious zone, the exploitation rate will be reduced progressively if stock status continues to decline. Conversely, the exploitation rate will be increased progressively if stock status improves. In allowing the exploitation rate to increase, consideration will need to be given to the time needed for previous reductions in exploitation to have a positive effect.
As stated in the PA Policy, adjustments to the exploitation rate in the cautious zone need not be linear but linear adjustments will serve as a general guide during consultations: e.g., if the stock is halfway between the USR and LRP, the removal reference will be approximately half of the removal reference for the healthy zone; if the stock is in the bottom quarter of the cautious zone, the removal reference will be approximately a quarter of the removal reference for the healthy zone.
| LFA | Healthy Zone | Cautious Zone (Illustrative*) | Critical Zone | ||
|---|---|---|---|---|---|
| Top Qtr | Mid | Bottom Qtr | |||
| LFA 27 | 0.84 | 0.63 | 0.42 | 0.21 | Lowest possible level |
| LFA 29 | 0.94 | 0.71 | 0.47 | 0.24 | |
| LFA 30 | 0.77 | 0.58 | 0.39 | 0.19 | |
| LFA 31A | 0.89 | 0.67 | 0.45 | 0.22 | |
| LFA 31B | 0.82 | 0.62 | 0.41 | 0.21 | |
| LFA 32 | 0.93 | 0.70 | 0.47 | 0.23 | |
| LFA 33 | 0.81 | 0.61 | 0.41 | 0.20 | |
If stock status declines to midway between the USR and the LRP, advice from Science will be requested, and consultations with the advisory committee will be initiated to support the development of a rebuilding plan. If stock status approaches the LRP, preparations will be made to implement the rebuilding plan.
Critical zone
In the critical zone, removals will be kept to the lowest possible level, which may mean closure of the commercial fishery. Closure would be effected through varying the season to 0 days.
The rebuilding plan will be implemented. The rebuilding plan will promote stock growth, and it will have a high probability of allowing the stock to rebuild within a reasonable timeframe.
Appendix 6: Harvest Control Rules for LFAs 34-38
The harvest rate strategy and harvest control rules (HCRs) presented in this document have been developed according to Fisheries and Oceans Canada’s A Fishery Decision-Making Framework Incorporating the Precautionary Approach (PA Policy).
This document, developed in consultation with industry partners and stakeholders, applies to the commercial lobster fisheries in Lobster Fishing Areas (LFAs) 34 to 38. It came into effect April 2020.
This document does not apply to food, social, and ceremonial fisheries for lobster. It is acknowledged that Indigenous rights to fish for food, social, and ceremonial purposes will take priority, after conservation, over commercial uses of the lobster resource.
Management objectives
In Maritimes Region, one of the overarching objectives of fisheries management is to not cause unacceptable reductions in productivity so that components of the marine environment can play their role in the functioning of the ecosystem. In LFAs 34-38, this will be achieved through managing commercial exploitation and promoting egg production in a manner consistent with the Department’s PA Policy and according to the following sub-objectives:
- to maintain a healthy lobster stock;
- to manage the risk of the fishery causing or precipitating a decline in stock status, such that -
- where the stock is high in the healthy zone, the risk is low to moderate;
- where the stock is not high in the healthy zone, the risk is low; and
- to promote recovery of the stock should it fall into the cautious or critical zone.
Harvest Control Tool Box
Currently, the lobster stocks in all LFAs are high in the healthy zone. The HCRs presented herein are pre-agreed decision rules that state what actions will be taken should there be a decline in stock status or should exploitation exceed the removal reference. The HCRs leave the choice of controls for achieving reductions in exploitation open so that the economic and biological factors in play at the time that the reductions are needed can be considered. This means that no decisions have been made at this time on the specific controls – increase of X mm in the minimum legal size, introduction of a window measure, shortening of the season by X days, etc. – that may be implemented in the future.
Nevertheless, it has been agreed that controls will be chosen from among those that form part of the current management framework for the inshore lobster fisheries in the Region. A list of these controls – the “harvest control tool box” – is presented below.
Input Controls
- Limited entry
- Trap limits
- Fixed seasons
Escapement / Biological Controls
- Release of berried females
- Release of v-notched females
- Minimum legal size
- Maximum legal size (females)
- Window measure (females)
- Area closure (i.e. LFA 40)
- Maximum hoop size
- Escape vent size
Different controls will have different effects on exploitation, and these effects may vary across LFAs. In October 2019, DFO Science provided advice on simulating the effects of changes to minimum and maximum sizes, season lengths, and window measures on egg production and landings (research document forthcoming). For LFA 34, the simulations used two different assumptions of exploitation on the stock: relative fishing mortality estimated by the inshore lobster trawl survey (survey relF) and the exploitation rate generated from the recruitment trap project (CCIR). For LFAs 35-38 where an index of exploitation is not available, these simulations were completed using two differing assumptions of exploitation on the stock, both high and low.
Harvest Strategy and Harvest Control Rules
Summary
The harvest strategy is to maintain exploitation at or below the removal reference within LFA 34. The HCRs, which have been developed for each stock status zone, are summarized in the following table and elaborated upon further below.
Summary of proposed HCRs for the commercial fisheries in LFAs 34-38
Healthy Zone
Above the upper stock reference (USR)
- For LFA 34, maintain the exploitation rate at or below the removal reference
- For LFAs 35-38, maintain stability in input and biological controls (no increase in exploitation). Monitor stock status indicators for signs of overexploitation
Declining and approaching the USR
- Request science advice. For LFA 34, two (2) or more survey biomasses falling below their respective upper stock indicators (USIs) will trigger an assessment
- Initiate consultations
- Consider reducing the exploitation rate
Cautious Zone
Below the USR
- For LFA 34, reduce the exploitation rate
- For LFAs 35-38, aggressively reduce the exploitation rate
- Progressively reduce the exploitation rate as stock status declines
Midway between the USR and limit reference point (LRP) and declining
- Request science advice
- Initiate consultations on a rebuilding plan
Approaching the LRP
- Prepare to implement rebuilding plan
Critical Zone
Below the LRP
- Reduce the exploitation rate to the lowest possible level
- Implement the rebuilding plan
Having an ability to estimate exploitation will be important for monitoring the effectiveness of the HCRs if there is a need to implement them.
For LFA 34, the indicator for exploitation will be calculated by Science annually based on a three year running median and will be reported on in stock status updates or stock assessments. This will allow for monitoring by the advisory committee of whether the exploitation rate is being maintained at or below the removal reference for each stock status zone, and it will allow for evaluating the success of management actions in effecting changes to exploitation rates when these are implemented. In LFA 34, regulated measures for reducing exploitation will not be necessary in any stock status zone if the exploitation rate is shown to be below the removal reference.
In LFAs 35-38, where removal references and exploitation rates have not been developed, regulated measures for reducing exploitation will be necessary if the stock falls below the upper stock reference (USR). The combination of input and biological controls is intended to keep the level of exploitation fairly constant and should be results-driven to effect a change in stock status in a reasonable timeframe. The effectiveness of the controls will need to be evaluated based on the results, i.e. changes to stock status relative to the USRs and limit reference points (LRPs).
The HCRs will generally be implemented on an LFA-by-LFA basis. This means that a decline in stock status in one LFA will not automatically necessitate a reduction in exploitation in other LFAs. Where there is a need to reduce exploitation across more than one LFA, variation in the choice of harvest control(s) will be considered only where the variation will not jeopardize recovery.
The harvest strategy is based on an assumption that changes in stock status can result from changes in the management of the fishery. This is true to some extent. However, environmental factors appear to have a significant effect on the productivity of lobsters. It is therefore possible that the status of the lobster stock will vary as a result of changes in the environment as opposed to changes in fishing pressure. Should it appear that there have been significant changes in lobster productivity to the point that a shift in productivity regimes appears to have occurred, a review will be requested by Science of the reference points in the fishery.
It is anticipated that the duration of the steps required to inform a decision to change harvest controls may take several months. As a result, it is expected that a fishing season will lapse prior to the implementation of any change. For example, if a stock assessment or update identifies that exploitation exceeds the removal reference, a change in management measures to reduce exploitation will be implemented in the year following the updated advice.
Healthy zone
When the stock is in the healthy zone, the LFA 34 Advisory Committee will monitor the exploitation rate in relation to the removal reference. If the exploitation rate exceedsthe removal reference, the committee will discuss and recommend management actions to reduce fishing pressure. At any time, the advisory committee may also propose a target removal reference and recommend actions for managing the fishery within a lower level of exploitation.
For LFAs 35-38, where exploitation rates and a removal reference have not been developed, management actions will respond to the status of the stock relative to the USR and LRP and data from secondary and contextual indicators.
If stock status declines and approaches the USR, advice from Science will be requested and consultations will be initiated with partners and stakeholders through the advisory committee process. For LFA 34, an assessment will be triggered when two or more survey biomasses fall below their upper stock indicators (USIs). Consultations will focus on the specific changes to harvest controls that will be implemented if stock status falls below the USR. The advisory committee may also recommend changes to harvest controls before stock status reaches the USR in an effort to arrest the decline. In developing recommendations on management actions, the advisory committee will consider the impact of possible actions on egg production and landings, as advised by Science.
Cautious zone
In the cautious zone, the exploitation rate will be reduced progressively if stock status continues to decline. Conversely, the exploitation rate will be increased progressively if stock status improves. Consideration will need to be given to the time needed for previous reductions in exploitation to have a positive effect.
As stated in the PA Policy, adjustments to the exploitation rate in the cautious zone need not be linear, but linear adjustments will serve as a general guide during consultations. For example, in LFA 34, if the stock is halfway between the USR and LRP the removal reference will be approximately half of the removal reference for the healthy zone; if the stock is in the bottom quarter of the cautious zone, the removal reference will be approximately a quarter of the removal reference for the healthy zone.
| Index | Healthy Zone | Cautious Zone (Illustrative*) | Critical Zone | ||
|---|---|---|---|---|---|
| Top Qtr | Mid | Bottom Qtr | |||
| ILTS | 0.849 | 0.637 | 0.424 | 0.212 | Lowest possible level |
| DFO RV survey | 0.979 | 0.734 | 0.490 | 0.245 | |
| NEFSC Spring survey | 0.9285 | 0.696 | 0.464 | 0.232 | |
| NEFSC Fall survey | 5.16 | 3.87 | 2.58 | 1.29 | |
*Declines in the removal reference through the cautious zone may be faster or slower depending on conditions surrounding stock status.
In LFAs 35-38, where an assessment of exploitation rate against a removal reference is not available, management actions should mitigate declines and, when possible, promote positive change in biomass. The management response will vary depending on location of the stock within the cautious zone, whether the stock is increasing or decreasing, and indications of incoming recruitment, for example.
If stock status declines to midway between the USR and the LRP, advice from Science will be requested, and consultations with the advisory committee will be initiated to support the development of a rebuilding plan. If stock status approaches the LRP, preparations will be made to implement the rebuilding plan.
Critical zone
In the critical zone, removals will be kept to the lowest possible level, which may mean closure of the commercial fishery. Closure would be effected through varying the season to zero days.
The rebuilding plan will be implemented. The rebuilding plan will promote stock growth, and it will have a high probability of allowing the stock to rebuild within a reasonable timeframe.
Appendix 7: Amendments
March 2022- Various updates, corrections and edits throughout. Primarily these:
- Update to number of licences (Table 1)
- Update to vessel replacement policy for LFAs 33 and 34 (sub-section 1.5)
- Update to stock assessment references (Table 4)
- Update of stock status indicators and reference points for LFAs 34-38 (sub-section 2.4)
- Update to include harvest control rules (sub-section 7.1)
- Addition of Appendix 5: harvest control rules for LFAs 27-33
- Addition of Appendix 6: harvest control rules for LFAs 34-38
March 2019- Various updates, corrections and edits throughout. Primarily these:
- Restructuring and reformatting of sections and appendices
- Update to Foreword
- Update to number of licences (Table 1)
- Updates to educational licensing policy (sub-section 1.2.3)
- Updates to commercial licensing policy (sub-section 1.3.1)
- Corrections to season dates for LFAs 30, 35, 37 and 38 (Table 2)
- Updates to minimum legal size for LFA 27 (Table 2)
- Update to stock assessment references (Table 4)
- Updates to stock status indicators and references points for LFAs 27-33 (sub-section 2.4)
- Complete update of research plan (sub-section 2.5)
- Complete update of socio-economic data (section 3)
- Updates to management issues (sub-sections 4.3, 4.6, 4.7, 4.8, 4.9)
- Complete update of compliance section (section 10)
- Date modified: