
Center of Expertise in Marine Mammalogy: Scientific Research Report 2009-2011
Table of Contents
- Acknowledgements
- Message from the Director of CEMAM
- 1.0 Population Dynamics
- 1.1 Density dependent-density independent growth in marine mammals (Mike Hammill, Don Bowen, Garry Stenson)
- 1.2 Changes in Reproductive Rates of Northwest Atlantic Harp Seals (G.B. Stenson)
- 1.3 Long term changes in grey seal vital rates are linked to a reduction in population growth rate (Don Bowen)
- 1.4 Ringed seal reproduction in Hudson Bay (Steve Ferguson, Magaly Chambellant)
- 1.5 Using genetics to learn about beluga whale groups in Hudson Bay (Mike Hammill, Lianne Postma)
- 2.0 Role of Marine Mammals in the Ecosystem
- 3.0 Marine Mammal - Human Interactions
- 4.0 Relationships with Co-management Boards
- 5.0 Species at Risk
- 6.0 Publications 2009-2011
1.0 Population Dynamics
1.1 Density dependent-density independent growth in marine mammals (Mike Hammill, Don Bowen, Garry Stenson)
Population numbers naturally tend to change over time under the influence of factors such as competition for resources (e.g., food), predation, immigration and emigration, and environmental variability. An issue that is frequently discussed is whether these changes in population numbers are the result of density-independent or density-dependent processes (Fig. 1). Density dependent factors influence the population in proportion to the population size while density independence factors are unrelated to the size of the population. Density-independent population limitation is often due to environmental changes such as a sudden loss in ice, which can be catastrophic for seal species that require ice as a platform for giving birth and raising their young, leading to high mortality of young. Another example is El Niño, where a sudden change in ocean temperature led to large scale food shortages resulting in starvation.

Figure 1. In density-independent growth, resources are not limiting and in theory the population increases continuously, often exponentially, unless some event occurs. In density-dependent growth, rapid growth can occur when the population is very small, but at some point, food or some other resource becomes limited and population growth slows down to stabilize around a level referred to as the environmental carrying capacity.
In the case of density-dependence, some resource, usually food (or the space available for breeding) increasingly becomes limiting: as a result, the amount of food available per animal declines. Below some threshold, this reduction has the effect of reducing body condition, individual growth rate, reproductive performance, and ultimately survival. The effects of density-dependence are not expressed uniformly across the population. Often the first change is an increase in the mortality rates of juveniles, especially during the first year of life, because they not only must learn to find and capture food on their own, they must consume more energy per body size to support metabolic requirements and growth. Reduced survival rates of the young of the year is often associated with a decrease in the per capita birth rate, as adult females struggle to meet their energy requirements for maintaining themselves and for the added energetic costs of pregnancy and nursing. If conditions get severe enough, adult survival also declines in response to food limitation. Although this is the general pattern and suggests a sequence of responses, there is likely to be some overlap among the changes in vital rates for different age and sex classes in the population.
When the number of births in a population equals the number of deaths, population size will stabilize. A population that has stabilized is considered to be at environmental carrying capacity, termed "K". Although there is a tendency to consider this as a constant, in fact, K may vary over time with longer-term environmental variability. For example, a resource increase may improve environmental conditions, resulting in a new higher K and associated population size while lower resources may result in a decrease in K.
Detecting when a population is at or near carrying capacity is difficult because some short-term population fluctuations can be expected as environmental conditions vary from year to year. Also, for the species we deal with, population size is not measured annually and each estimate of population size is measured with some error. Nevertheless, because the numbers of many marine mammal populations were significantly reduced historically by hunting, many of these species have been, or continue to, increase toward K. Harbour seals and gray whales on the west coast of Canada provide an example of populations that appears to be at or close to K, whereas grey seals on Sable Island are showing signs of density-dependent changes in population growth. Unfortunately, for most marine mammal populations we do not have a long time-series of abundance estimates, so it is not possible to determine if a population is near or at K. Furthermore, some populations are still hunted and it is even more of a challenge to determine what K might be in such situations. If there is insufficient survey data to estimate K, then an alternative approach could help to provide insights as to where K might be.
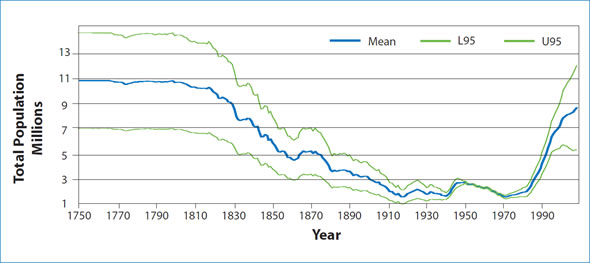
Figure 2: Reconstruction of the Northwest Atlantic harp seal population using information on current population size and data from harvests going back to the late 1700's.
The Northwest Atlantic population of harp seals was significantly reduced due to 300 years of hunting. Since the early 1970s, quota management has allowed the population to increase and during this period we have a relatively long time-series of trend information. The population, which numbered less than 2 million animals in the early 1970s, has grown to around 8.3 million animals in 2008, which is the largest that we have observed in over 6 decades. Over the last 30 years, body condition, growth and age-specific reproductive rates of harp seals have exhibited a declining trend, suggesting that density-dependent factors are affecting the dynamics of this population. However, higher than average pregnancy rates resulted in an estimate of 1.6 million pups born in 2008, the highest in the time series since the 1950s. Such highly variable pregnancy rates make it difficult to determine if the population is approaching carrying capacity. One approach to estimating what K may be is to try to reconstruct the past history of the population to a period prior to when harvesting began. Harp seals have been harvested commercially since the start of the 18th century. In fact the highest harvests occurred during the period of the wooden sealing vessels in the early 1800s. Reconstructing the pre-hunting population using information on how many animals were removed over time is highly uncertain, and in order to assume that this reflects current carrying capacity assumes that ecological conditions that prevailed during the 1800s are similar to environmental conditions today. However, when historical catch data are included in a model and the past size of the population is reconstructed, then the population was estimated to level off at an average of approximately 11 million animals in the early 1800s. Unfortunately, this value is highly uncertain with a possible range of 7 to 15 million animals, but it does provide some indication of the possible maximum size for this population (Fig. 2).
It is important to understand how animals respond to changes in their abundance. Many marine mammal populations were reduced significantly to only a fraction of their pristine population size. Some populations are now recovering and increasing to near-historical numbers. At low populations, there is very little difference between density-independent or density-dependent growth and in some cases, this has led to claims that the populations are 'exploding' and are out of control. At some point, however, populations become limited by food, space or some other factor and density-dependent factors will begin to limit the population, slowing population growth and leading to an eventual levelling off. Understanding the nature of these changes in mortality and reproduction is critical for estimating current abundance and predicting future population growth. The proximity of a population to K can be used as an indication of how healthy it is. A population that is abundant is more likely to withstand sudden perturbations, or catastrophic events, than a small population. Healthy populations are also able to fulfill their traditional ecological role, which for many marine mammals is to stabilize the structure of the marine ecosystem.
1.2 Changes in Reproductive Rates of Northwest Atlantic Harp Seals (G.B. Stenson)
Understanding reproductive rates is critical for understanding the population dynamics of marine mammals. Because it is impossible to survey the entire population, we estimate abundance of harp, hooded, and grey seals by surveying pups and using a population model to scale up these estimates to total population size. Therefore, the reliability of our population estimates are dependent upon accurate annual estimates of age-specific pregnancy rates, particularly as rates vary with changes in population and environmental conditions. However, monitoring such changes is difficult for most species as they require extensive measurements made over long periods. Female reproductive tracts have been collected from harp seals in Newfoundland and southern Labrador waters since the 1950s, with a more systematic program initiated in the 1980s that continues today. Using these data, annual estimates of late-term pregnancy rates, fecundity (proportion of mature females that give birth), and mean age of sexual maturity of Northwest Atlantic harp seals were estimated.
Generally, pregnancy rates for 3-year-old harp seal females were very low (<10 %) with few animals being pregnant. Among the 4- and 5-year-olds, reproductive rates increased during the 1970s, but declined by the mid 1980s to levels similar to, or lower than, those seen in the 1960s. Pregnancy rates for 6-year-olds were low (< 67%) since the mid 1990s when compared with earlier years when rates averaged around 80%. Among the older seals, pregnancy rates were high (80–90%) until the mid 1980s, but then declined. Since then, pregnancy rates fluctuated greatly, but averaged around 60%. Since 2008, pregnancy rates have declined significantly to less than 30%. The proportion of mature females that give birth (referred to as the 'fecundity rate') showed a similar trend, remaining relatively high until the mid 1980s and then declining (Fig. 3). Recent fecundity rates have been highly variable, with years of low pregnancy rates being associated with high levels of late-term abortions.
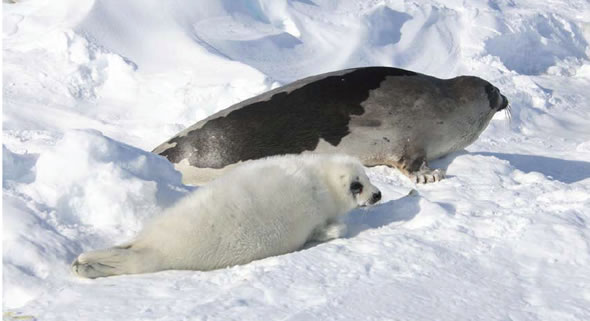
Female harp seal and pup
Photo: DFO Newfoundland

Figure 3: Annual estimates of the proportion of mature harp seal females that give birth, 1980-2011, based upon the examination of reproductive tracts collected from northeast Newfoundland and southern Labrador, December through February.

Harp seal nursing pup.
Photo: DFO Newfoundland
The age at which female harp seals became sexually mature also varied over the past 50 years. From 1954 to 1976, the Mean Age of Sexual Maturity (MAM) averaged 5.3 years. Between 1978 and 1987, however, the average age at which female harp seals became sexually mature declined to 4.6 years. By 1990 it had increased by almost a year and throughout the decade, MAM remained fairly constant around 5.6 years. With the exception of 2000, MAM increased during the early 2000s reaching a time-series high of 6.1 years in 2005-06.
Although the direction of the changes we have observed are consistent with a density-dependent response to changes in population size, dramatic changes in the northwest Atlantic ecosystem have also occurred at the same time. A number of physical and biological factors were examined to determine which may have influenced pregnancy rates in harp seals. The overall decline in average fecundity appears to be a response to increases in population size. The interannual variation, however, is best explained by changes in the rates of late-term abortions. In turn, the abortion rates appear to be influenced by early winter ice conditions and food availability, as indicated by capelin abundance in the preceding fall surveys. This suggests that population dynamics of Northwest Atlantic harp seals is being influenced by a complex interplay of internal and external factors that include both physical and biological factors.
1.3 Long term changes in grey seal vital rates are linked to a reduction in population growth rate (Don Bowen)
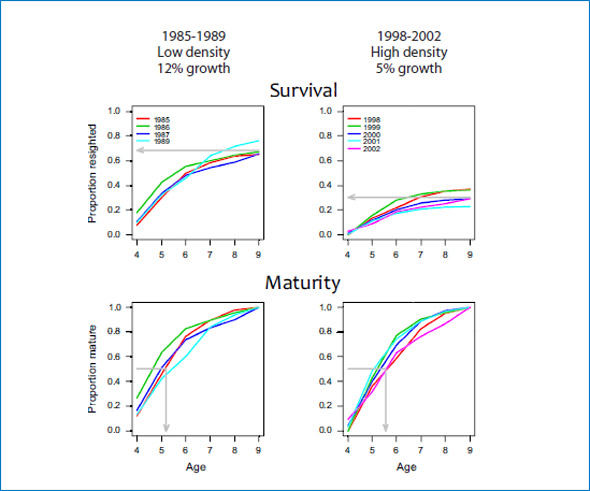
Figure 4: Cumulative proportion of branded female seals resighted on Sable Island between ages 4 and 9 (Survival, first row) and cumulative proportion of resighted females that were seen pregnant or with pup (Maturity, second row) plotted by cohort. The cohorts branded between 1985 and 1989, when the population was at low density and had a high population growth rate are in the first column, and the cohorts branded between 1998 and 2002, when the population density was higher and the growth rate had slowed to 4 to 5% in the second column.
Populations facing resource limitation are expected to exhibit changes in vital rates, such as reduced juvenile survival, delayed maturation and reduced adult survival. Population growth rate of grey seals (Halichoerus grypus) at Sable Island, Nova Scotia has been monitored from 1963 to 2010 by estimating pup production. Recently, the rate of increase in pup production has slowed to 4%/yr from 12%/yr prior to 1997. Periodically between 1969 and 2002, more than 7,000 grey seals were uniquely branded at weaning. Resighting of those branded grey seals, by researchers from the Bedford Institute (D. Bowen, C. den Heyer and J. McMillan) and Dalhousie University (S. Iverson), has been conducted annually from 1983 to 2010 by means of 3-5 weekly censuses of the breeding colony. Resightings of females were used in a mark-recapture analysis to estimate juvenile survival (weaning to age 4), adult survival and age-specific (age 4 to 13) probabilities of first birth. Two groups of cohorts (1985-89 and 1998-2002) were analysed separately to test for temporal changes. Estimated adult survival rates were consistently high (92-99%), but increased slightly during the 1990s. By contrast, the estimated probabilities of first pupping at ages 4 to 13 did not changed and apparent juvenile survival decreased from 78% for the 1980s cohorts to 35% the most recent cohorts (Fig. 4). Although the rate of population growth has slowed significantly, our results show that adult survival has remained high. Therefore, if food limitation is responsible for the observed change in growth rate, then density dependence is being expressed through a marked reduction in juvenile survival.
1.4 Ringed seal reproduction in Hudson Bay (Steve Ferguson, Magaly Chambellant)
Ringed seals are among the smallest and more numerous seal species, and have a northern circumpolar distribution. Sexually mature animals use primarily stable land-fast ice with sufficient snow cover to build sub-nivean birth lairs that are critical for pup survival. As part of a community-based monitoring program established by DFO Winnipeg, ringed seal samples and measurements were collected by Inuit hunters during their fall subsistence harvest in Arviat, Nunavut. Ringed seals were aged by reading growth layer groups in the cementum of decalcified, stained, thin canine tooth sections. Ovaries and testes were frozen upon collection and later examined to assess reproduction.
Growth in length and mass (Fig. 5) of male and female ringed seals were estimated by Gompertz growth curves. There was no sexual dimorphism in length, mass or body condition (fat depth) in western Hudson Bay ringed seals. But, since the females were significantly older, the males may be slightly larger at a given age. Compared with other locations in the Arctic, ringed seals in Hudson Bay were smaller both in length and mass supporting the hypothesis of latitudinal size differences.

Figure 5: Summary of reproductive changes over decades, 1990s versus 2000s.
In Hudson Bay, females became sexually mature around the age of six years but morphological sexual maturity could be detected as early as three years of age. Male ringed seals seemed to reach sexual maturity around five years of age, but testes mass continued to increase until 10 - 11 years of age. Both sexes appear to mature physically before they reach behavioural sexual maturity. The ages at maturity are in accordance with those of other ringed seals in Hudson Bay and in the rest of the Arctic, albeit at the lower end of the spectrum.
The reproductive cycle of ringed seals in Hudson Bay is similar to other Arctic locations. Pups are born on land-fast or stable pack ice in sub-nivean lairs that require a snow depth on the ground of 20 cm or more to provide sufficient protection against Arctic weather and predators. Nominal birth date for pups is set on the 1st of April but the pupping period could be spread over several weeks. In Hudson Bay, traditional knowledge and recent data converge to an earlier pupping period, starting in February and peaking around mid-March. This supports the hypothesis of a latitudinal gradient of pupping. Pups are weaned before break-up, after nursing for 5 – 7 weeks.
Mating is thought to take place underwater around the time of weaning with a reported peak of male sexual activity from February to April in Hudson Bay. Ringed seal gestation lasts around 10.5 months, with a period of suspended development during the first 2 – 3 months. In late spring, ringed seals undertake their annual moult and require an ice platform to haul-out.
Body condition of ringed seals is poorest in early summer after fasting during the breeding and moulting periods. During the open water period all age-classes are mixed and feed intensively.
When the ice starts to form in late fall, adults gather close to shore to establish territories. During this period, juveniles are actively excluded from these habitats. Adult ringed seals show signs of site fidelity during the winter months and may have a weakly polygynous, resource-defence mating system.
We propose that ringed seal population dynamics follows a decadal cycle that relates to fluctuations in the environment and particularly in the sea ice regime, through changes in ocean productivity and predation pressure. Younger seals in the 2000s grew faster, matured earlier and produced more pups that survived better than those in the 1990s. Such life-history traits are more suggestive of a growing population in the 2000s than in the 1990s. The change in life-history traits during the two study periods supports the hypothesis that ringed seal population dynamics in western Hudson Bay may follow decadal fluctuations of the sea ice regime through atmospheric forcing (e.g., North Atlantic Oscillation). The cycle in ringed seal numbers and reproductive performance is linked to the demographic sensitivity of ringed seal pups to snow cover and ice stability for survival. Thus, a long-term decline of ringed seal fitness in response to current and projected trends in Hudson Bay environmental variables is likely and reinforces the need for long-term data of ice-adapted marine mammals living at the southern limit of their range.
1.5 Using genetics to learn about beluga whale groups in Hudson Bay (Mike Hammill, Lianne Postma)
Across their entire range, beluga whales (Delphinapterus leucas) are known to visit estuaries and river mouths during summer. Some of these estuaries are places of regular aggregations for large numbers of whales and they have traditionally provided good harvesting opportunities for subsistence hunters. This is because the return of belugas is usually predictable and numerous whales are present in a confined environment that facilitates hunting. Indeed, reliable access to these aggregation sites appears to have been important in determining ancient settlement patterns in some Arctic areas.
Several explanations have been proposed to explain this behaviour, but no single reason appears to account for the existence of these aggregations in all cases. The estuaries do appear to be biologically significant and may represent critical habitat for these animals. The fact that belugas continue to return to these locations and persist in occupying them even when subjected to repeated disturbance would appear to underline their importance.
Early researchers have suggested that these summer aggregations of whales consist of distinct groups of animals that should be managed as separate populations or separate management units. The concern is that if any aggregation is harvested too much it may result in abandonment of an estuary. This may not have conservation consequences for the species, but it may result in a loss of biodiversity as well as the loss of food resources for individual villages in specific regions.
To determine if belugas living in and around Hudson Bay are actually distinct groups of whales, we are using DNA markers to compare the genetic profiles of the animals. To help us on this, hunters collect a skin sample from animals they have harvested and return this to us along with information on the date and location that the animal was harvested. We then examine the DNA that we can recover from the skin sample and look for both similarities and differences among the samples collected from different areas in different seasons by different hunters.
Belugas are observed along the eastern Hudson Bay coast, in James Bay and along the western Hudson Bay coast throughout the summer months. The eastern Hudson Bay group is the smallest and likely numbers around 3,000 animals. The belugas that summer along western Hudson Bay number around 57,000 whales and may be the largest gathering of whales in the world. Another 9,000 whales are found in James Bay. The Hudson Bay belugas migrate at the end of summer or in the fall to Hudson Strait where they overwinter, though at least some of the James Bay animals appear to remain in the James Bay area throughout the year. The migration patterns of these whales are very interesting because this is when they appear to mix together and gives them opportunities to mate. Breeding among belugas is thought to occur during the late winter-early spring months. Gestation lasts for 9-12 months, with the calves born the following spring. The calves remain with their mother for 12-18 months. These biological characteristics of beluga whales all contribute to what kinds of patterns we can see when we look at the DNA in the samples we receive from the hunters.
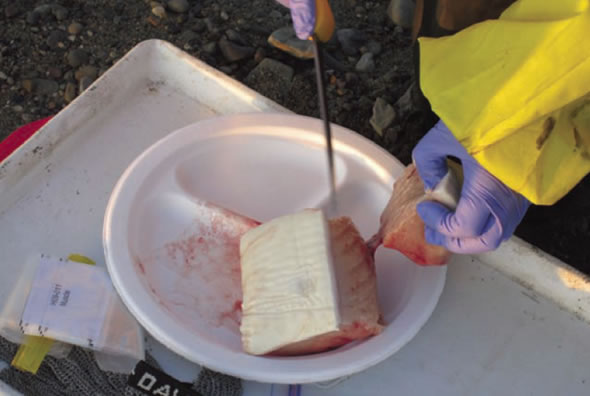
Muktuk sample
Photo: Lisa Loseto
For the genetic analyses, we examine two types of DNA: mitochondrial and nuclear DNA. The mitochondrial DNA (mtDNA) is a type of DNA that is passed on mainly from the mother to her offspring. Looking at information from mtDNA is useful for identifying groups of animals based on their maternal lineages. On the other hand, nuclear DNA (nDNA) is the type of DNA that is more commonly used in forensic science as it is inherited equally from each parent. In belugas, nDNA can therefore be useful for finding out information about breeding patterns i.e. which groups are mating with each other, and what kind of relationships individual whales have to each other.
Among DNA samples collected from beluga whales from the western and eastern coasts of Hudson Bay and from overwintering animals in Hudson Strait, there is little or no differentiation between samples using nuclear DNA. This indicates that animals are interbreeding, probably on the overwintering areas where there are ample opportunities for animals to be together. However, samples from animals that have separated to the summering grounds contained mitochondrial DNA types that were distinct from each other. The strongest mtDNA differences revealed that belugas caught in the summer along the coast of the eastern Hudson Bay (EHB) arc form a genetically distinct group of animals. These EHB whales are genetically most related to the St. Lawrence River belugas, and are quite different from the two main beluga groups in the vicinity, i.e. the western Hudson Bay Stock and the Southeast Baffin Stock.
Using the mtDNA genetic signatures, samples from the northern Quebec (Nunavik) portion of Hudson Strait contain an important proportion (7-31%) of belugas from the EHB stock. This proportion is much higher than would be expected based on the relative size of the western Hudson Bay stock (57,000 animals) compared to the eastern Hudson Bay beluga stock (3,000 animals). This points to differences in the migration patterns between the two groups, particularly when they arrive in the Hudson Strait waters.

DNA extraction from skin
Photo: Lianne Postma
Working with colleagues from Laval University, further analyses of the nuclear DNA from the skin samples indicate that parents and offspring, as well as half siblings and other 'close kin', travel in close association with each other both in space and in time. Stronger relationships are shown among mother-daughters than among mother-sons. These results point towards a network of related individuals, particularly among females. These networks move to and from their summering and wintering areas. As such, young belugas are able to learn the specific migratory route of their mother and close relatives, since they will complete 2-4 migrations by the time that they are weaned. This learning of specific migratory routes may have important conservation and management implications. If animals tend to maintain related groups and repeatedly visit the same areas, then loss of these groups would result in the loss of knowledge about the route. Thus, if animals are extirpated from a particular location, then the chances of the area being recolonized are very small. This appears to be the case in some areas around northern Quebec.
These insights provided by genetics are extremely interesting, and they are also supported by information from other types of studies such as local observations, satellite telemetry, stable isotope analyses and comparisons of contaminant signatures. Taken together, the data help to build a foundation of knowledge about beluga whales that can be used to predict how they may be vulnerable to a variety of stressors in their environment. With this in mind, management decisions can be guided to promote conservation of these animals.
- Date modified: