
Introduction to stock assessment
Unit 3.3: Management Strategy Evaluation
MSE results can be explained using different tables or figures.
Probability tables:
A probability table shows performance metrics from 0 to 100%. Each row represents an MP. Each column represents an objective. In the example below, the colours make it easier to see which MPs perform best across multiple objectives. The colours are accessible for people with colour blindness.
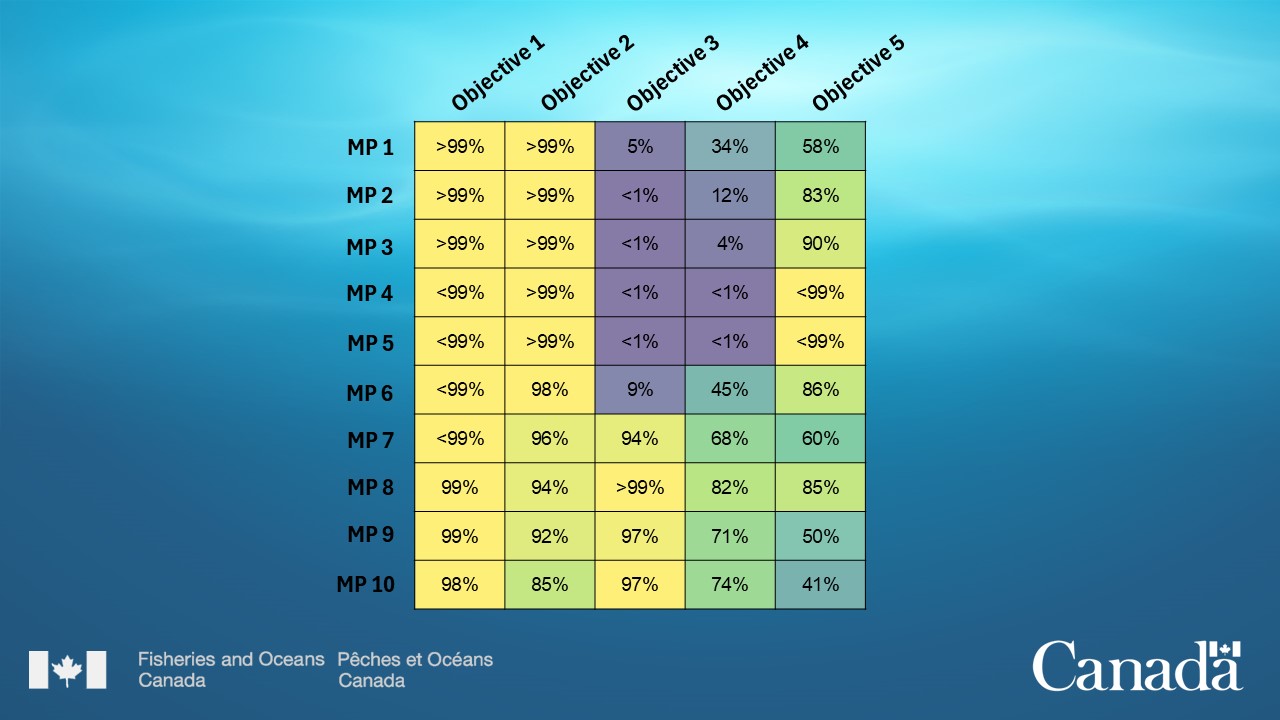
Long description:
The probability table shows how 16 MPs perform across 6 objectives on a scale of 0 to 100%. Colours show performance with yellow indicating the highest performance and purple the lowest. Source: https://www.dfo-mpo.gc.ca/csas-sccs/Publications/ResDocs-DocRech/2021/2021_007-eng.html
Radar plots:
Radar or spider plots show how well MPs achieve competing objectives. Each axis of the web represents a different objective. Axes start from 0% performance at the centre and extend outward to 100%. The probability that an MP will achieve an objective is plotted on each axis as a point. Points are connected to form a polygon that highlights the strengths and weaknesses of each MP. MPs that perform better across multiple objectives have larger polygons. Several MPs can be layered on a single plot for comparison.
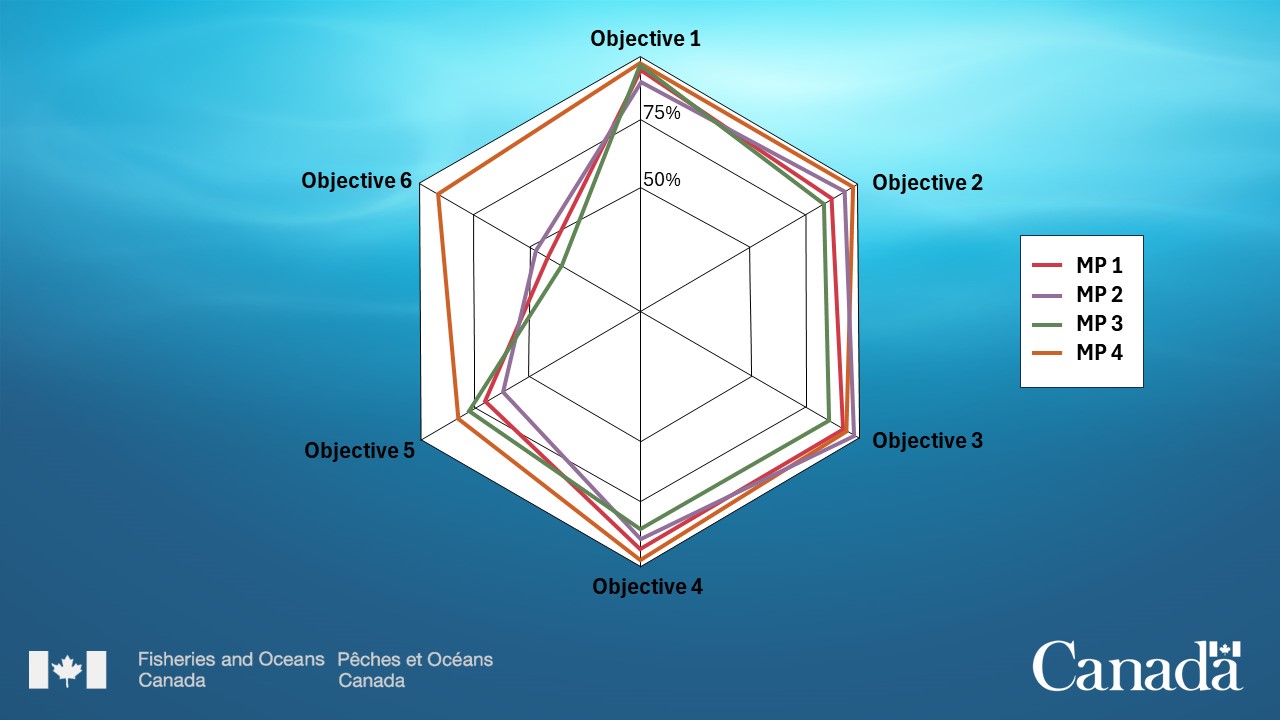
Long description:
The radar plot shows the performance of 4 MPs across 6 objectives. Each axis represents an objective. Each polygon represents an MP. Polygons closer to the outer edge have a higher probability of achieving objectives. Source: https://www.dfo-mpo.gc.ca/csas-sccs/Publications/ResDocs-DocRech/2021/2021_007-eng.html
Dot plots:
Dot plots show how well MPs balance competing objectives. Each axis represents the probability of achieving an objective from 0 to 100%. Each dot represents an MP. Improving an MP's performance for one objective may worsen its performance for another. This explains trade-offs between objectives.
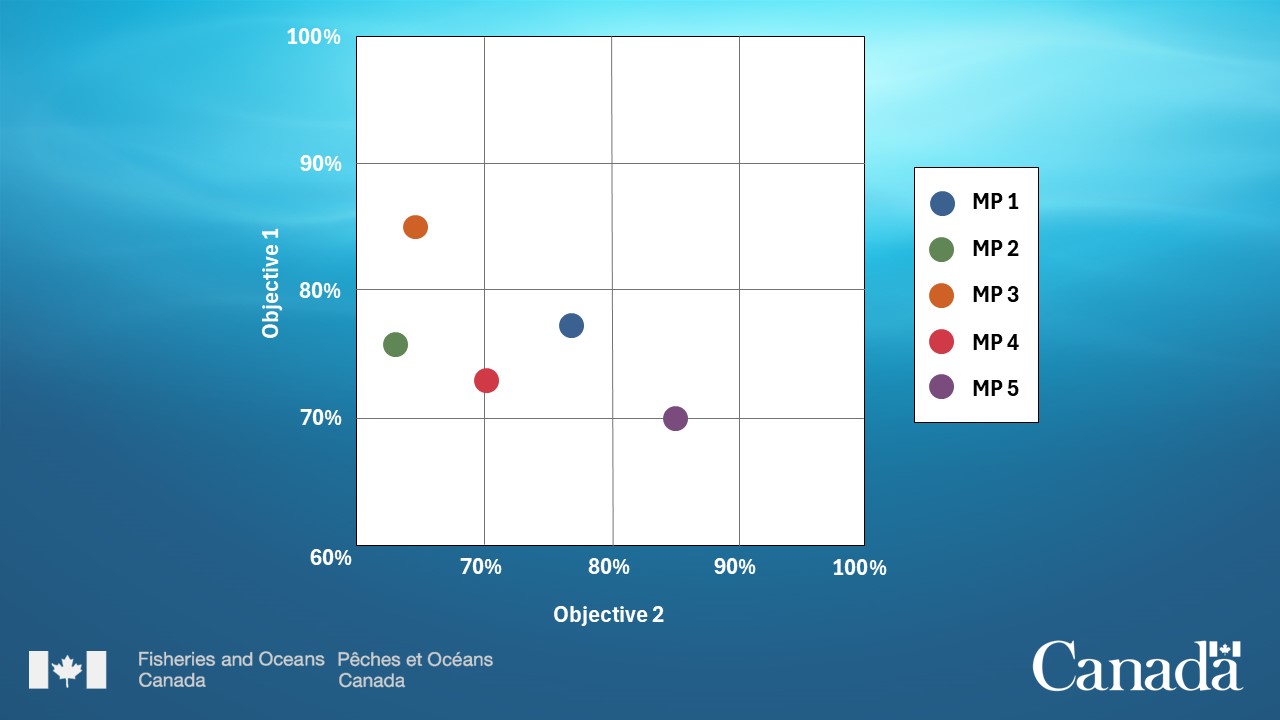
Long description:
The dot plot shows the performance of 5 MPs across 2 objectives. The x- and y-axes show the probability of achieving different objectives. Each dot represents an MP. Source: https://www.dfo-mpo.gc.ca/csas-sccs/Publications/ResDocs-DocRech/2021/2021_007-eng.html
Several MPs may achieve the objectives set out in an MSE. However, only one MP can be used in the real world. Managers can prioritize some objectives above others. Ranking objectives can help narrow down choices.
Once an MP is selected and applied to a fishery in the real world, management actions must be monitored to make sure they are achieving objectives as expected. OMs should be reviewed as new data becomes available to make sure they continue to accurately represent a stock, fishery, and ecosystem. This feedback can refine an MSE process. An MSE process may include a requirement to review MPs and OMs on a regular basis, such as every 3 to 5 years.
Exceptional circumstances are unexpected scientific or management developments that trigger the re-evaluation of an MSE process. Examples include:
- changes to law or policy that affect objectives
- new data that suggests OMs no longer represents reality
- a stock does not respond to management actions as expected
If an exceptional circumstance occurs, updated simulations with revised objectives, MPs, or OMs can lead managers to choose new management actions that achieve objectives better.
- Date modified: