
Introduction to stock assessment
Unit 3.3: Management Strategy Evaluation
MSE uses “closed-loop” simulation to test how well MPs achieve objectives. A closed-loop means that the system not only uses the output from each time step (such as simulated fish stock status and catches) as an input for the next, but it is also able to respond to those inputs and adjust management measures being applied according to the MP being tested. A common time step is 1 year.
Operating models (OMs) generate the data needed for an MSE. They do this by simulating how a stock, fishery, and ecosystem change over time. Each OM represents a different hypothesis about how the system works and how it might change in the future. An MSE can include multiple OMs to assess a variety of assumptions about the stock, fishery or ecosystem, and how they might change over time. In this way, MPs can be tested for their ability to perform across a range of potential future scenarios. MPs that perform well across multiple OMs are considered to be robust to the uncertainties specified in the OMs.
To fill knowledge gaps, OMs make assumptions about a stock, fishery, and ecosystem. Some assumptions are considered more likely than others based on existing data and expert opinion. Common assumptions include:
- recruitment rates
- natural mortality
- effects of climate change
- fishing effort
- the choices and behaviours of resource users (known as fleet dynamics)
There are many possible combinations of assumptions. Assumptions included in OMs can be updated over time as new information becomes available.
Closed-loop simulation is a repeating cycle:
Step 1:
A fish stock is simulated, 1 time step (e.g. 1 year), using:
- existing data
- OM hypotheses
- OM assumptions
Step 2:
Fishing pressure, occurring during this time step, is applied to the simulated stock. The amount of pressure is determined by factors such as fishing effort and gear type. Fishing pressure can be theoretical or based on conditions in the real world.
Step 3:
Data are collected by observing the simulated stock under fishing pressure, during this time step. Types of data include:
- abundance
- biomass
- spawning stock biomass
- age
- size (length, weight)
Step 4:
Real data are never perfect. When data are collected in the real world, there is:
- sampling error
- measurement error
- missing information
To reflect this, error and bias are added on purpose to the simulated data within this time step.
Step 5:
Using the simulated data, stock status is assessed or indicators are calculated. MPs are applied to decide what management actions will be taken in the next time step. New young fish are added to the stock to show recruitment. This information feeds back into Step 1 to begin the next cycle for the following time step (for example, the next year of the simulation).
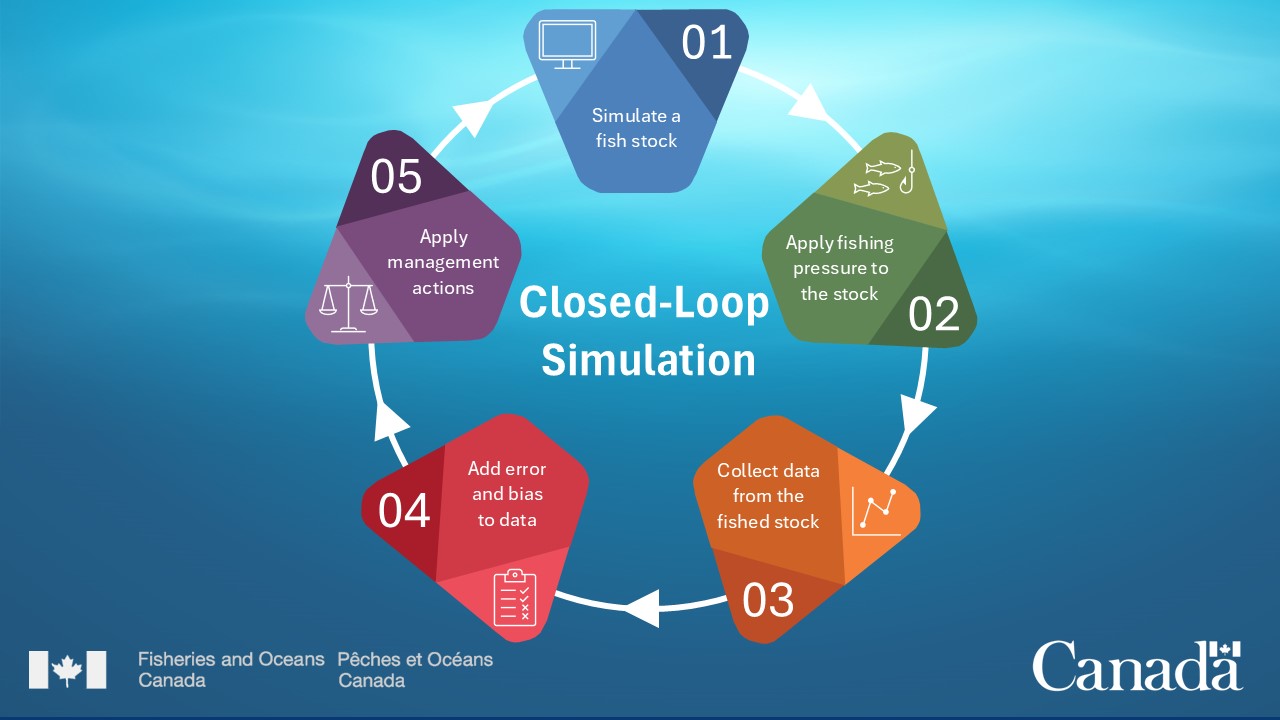
Long description:
Closed-loop simulation is a repeating cycle. To begin, existing data and OMs are used to simulate a fish stock. Fishing pressure is applied to the simulated stock. Data are collected from the simulated stock. Error and bias are added on purpose to the data. Stock status is assessed or indicators are calculated. MPs are applied to decide what management actions will be taken in the next time step. Then, the cycle begins again.
An MSE simulation runs for many time steps. The entire process is repeated many times under the same conditions to capture natural variability. The number of repetitions depends on how much uncertainty there is.
Simulation results are compared to performance metrics to see how well MPs met objectives:
- MPs that achieve objectives across many OMs are considered robust to uncertainty. If they perform well under different assumptions, they are likely to succeed in real life
- MPs that fail to achieve objectives in simulation are unlikely to succeed in the real world. They can be removed from further consideration
- Date modified: