
The Grand Banks of Newfoundland: Atlas of Human Activities
Oceans Division
Oceans and Habitat Management Branch
Fisheries and Oceans Canada (Newfoundland and Labrador Region)
© Her Majesty the Queen in Right of Canada, 2007
All rights reserved. No part of this information (publication or product) may be reproduced or transmitted in any form or by any means, electronic, mechanical, photocopying, recording or otherwise, or stored in a retrieval system, without prior written permission of the Minister of Public Works and Government Services Canada, 2007, Ottawa, Ontario, Canada K1A 0S5 or at Copyright.Droitdauteur@communication.gc.ca.
- Cat. No.
- Fs114-7/2007
Fs114-7/2007E-PDF
Fs114-7/2007F-PDF - ISBN
- 978-0-662-49898-8
978-0-662-45273-7 (English PDF)
978-0-662-73641-7 (French PDF) - URL
- Fisheries and Oceans Canada

DFO/2007-1238
Published by:
Fisheries and Oceans Canada
Newfoundland and Labrador Region
Communications Branch and
Oceans Division, Oceans and Habitat Management Branch
PO Box 5667
St. John’s, NL A1C 5X1
Printed on recycled paper
Acknowledgements
This atlas was co-edited by Jason Simms, Charlene Coates, Geoff Coughlan and Dawn Mercer. Maps were created by Charlene Coates and writing was completed by Geoff Coughlan and Charlene Coates.
Authors would like to sincerely thank the following individuals who kindly shared their knowledge or provided data on various aspects of the Atlas of Human Activities, as well as those that took part in the review process: Susan Gover, Dave Hawkins and Lewis Manual from the Canada-Newfoundland and Labrador Offshore Petroleum Board; Neil Peet and Brian Stone from the Canadian Coast Guard, Newfoundland and Labrador Region; Kirk Regular from Digeos; Scott Lewis and Rick Wadman from Environment Canada; LCdr R. G. Thwaites and Lt (N) Jay Warwick from National Defence; and Louis Armstrong from Transport Canada.
Authors would also like to thank the following staff of Fisheries and Oceans Canada who shared data and advice as well as took part in the review process: Chris Annand, Heather Bishop, Tony Bowdring, Rick Boyce, Heather Breeze, Bill Brodie, Noel Cadigan, Eugene Colbourne, Keith Clarke, Brian Dempson, Glen Herbert, Sean Hinds, Tracey Horseman, Leonard Knight, Morley Knight, Dave Kulka, Roger Menard, Dave Millar, Neil Ollerhead, Mike O’Connell, Richard Palmer, Ann-Marie Russell, Sandra Savory, Murray Scotney, Andrew Smith, Gary Smith, Blair Thorne, Elaine Walker, Ben Whelan and Larry Yetman.
TABLE OF CONTENTS
- Acknowledgments
- Introduction
- Base Maps
- Fisheries Introduction
- Fisheries: Newfoundland and Labrador Region
- Groundfish Landings (2000 – 2003)
- Groundfish Landings by Bottom Otter Trawl (2000 – 2003)
- Groundfish Landings by Gillnet (2000 – 2003)
- Groundfish Landings by Longline (2000 – 2003)
- Groundfish Landings by Scottish Seine (2000 – 2003)
- Groundfish Landings by Mid-water Trawl (2000 – 2003)
- Greenland Halibut Landings (2000 – 2003)
- Yellowtail Flounder Landings (2000 – 2003)
- Redfish Landings (2000 – 2003)
- Atlantic Cod Landings (2000 – 2003)
- Skate Landings (2000 – 2003)
- Witch Flounder Landings (2000 – 2003)
- Atlantic Halibut Landings (2000 – 2003)
- American Plaice Landings (2000 – 2003)
- White Hake Landings (2000 – 2003)
- Monkfish Landings (2000 – 2003)
- Pollock Landings (2000 – 2003)
- Haddock Landings (2000 – 2003)
- Wolffish Landings (2000 – 2003)
- Roughhead Grenadier Landings (2000 – 2003)
- Shellfish Landings (2000 – 2003)
- Snow Crab Landings (2000 – 2003)
- Northern Shrimp Landings (2000 – 2003)
- Stimpsons Surf Clam Landings (2000 – 2003)
- Iceland Scallop Landings (2000 – 2003)
- Sea Scallop Landings (2000 – 2003)
- Whelk Landings (2000 – 2003)
- Large Pelagic Landings (2000 – 2003)
- Bluefin Tuna Landings (2000 – 2003)
- Swordfish Landings (2000 – 2003)
- Bigeye and Albacore Tuna Landings (2000 – 2003)
- Fisheries: Scotia – Fundy Region
- Groundfish Landings (2000 – 2003)
- Redfish Landings (2000 – 2003)
- Atlantic Cod Landings (2000 – 2003)
- White Hake Landings (2000 – 2003)
- Atlantic Halibut Landings (2000 – 2003)
- Skate Landings (2000 – 2003)
- Monkfish Landings (2000 – 2003)
- Pollock Landings (2000 – 2003)
- Greenland Halibut Landings (2000 – 2003)
- Shellfish Landings (2000 – 2003)
- Stimpsons Surf Clam Landings (2000 – 2003)
- Northern Shrimp Landings (2000 – 2003)
- Snow Crab Landings (2000 – 2003)
- Sea Scallop Landings (2000 – 2003)
- Large Pelagic Landings (2000 – 2003)
- Swordfish Landings (2000 – 2003)
- Porbeagle Shark Landings (2000 – 2003)
- Bigeye and Albacore Tuna Landings (2000 – 2003)
- Oil and Gas Activities
- Marine Traffic
- Other Activities
Introduction
This atlas was prepared by the Oceans Division of Fisheries and Oceans Canada (DFO), Newfoundland and Labrador Region, to provide oceans planners, managers and users with a visual interpretation on the location and extent of major human activities that occur within the Grand Banks study area (see map entitled, Atlas of Human Activities Study Area). It will serve as a useful tool in the initial planning stages of the offshore component of the Placentia Bay/Grand Banks Large Ocean Management Area (PB/GB LOMA).
Oceans Division began collecting information in fall 2004 on human activities (i.e. fisheries, oil and gas, commercial shipping, etc.), management zones (i.e. NAFO Areas), and ecological features (i.e. bathymetry). In spring 2006 a draft Atlas of Human Activities was prepared, in which various individuals (i.e. individuals that contributed information or have knowledge on a particular activity) had an opportunity to review and comment on the atlas and the data displayed on the maps. This atlas will be a valuable resource for participants in the PB/GB LOMA (i.e. representatives of government departments and agencies, industry groups, non-governmental organizations, municipal governments, etc.), other oceans managers and planners. A similar atlas was published in 2005 entitled, The Scotian Shelf: An Atlas of Human Activities, by Fisheries and Oceans Canada, Maritimes Region.
This atlas was developed to display maps of recent activities, such as fisheries, oil and gas and commercial shipping within the study area on the Grand Banks. The geographic scope of the project is NAFO Divisions 3LNOP, beginning at the 12 nautical mile territorial sea extending beyond the outer limit of the continental shelf; the southern boundary is defined by 42º N latitude. The study area encompasses an area of 533,300 km2. The scale of the maps in this atlas is 1:4,250,000 and the projection is Latitude/Longitude North American Datum (NAD) 1983.
As the purpose of this atlas is to display recent activities, the Oceans Division collected information available since 2000. It is not the intent of this atlas to compare or portray relationships between recent and historical activities; therefore, minimal historical content is involved. When the data was collected, it was examined to determine which time periods had the most accurate and useful data to use in the project. Much of the information, fisheries for example, is taken from 2000 to 2003 because the data sets are recent and complete. Information on resources such as oil and gas is taken from 2000 up to and including August 2005; with the exception of commercial seismic activity which is taken from 1995 – 1999 because it has passed its privileged date. Other information, such as commercial shipping traffic density and vessel surveillance, only uses data pertaining to one representative year (2000 and 2002 respectively) as this gives an overall snapshot of the activities that occur within the study area. As a caution to atlas users, please note the date printed in the legend as this indicates the date or period in which the data was taken.
The information presented in this atlas is intended to provide users with a visual interpretation on the location and extent of major human activities within the study area. Attempts have been made to verify the information; however, none of the information presented in this atlas should be used for navigational or legal purposes.
Oceans and Coastal Management Division. The Scotian Shelf: An Atlas of Human Activities. DFO/2005-816. ISBN 0-662-69160-1
The Grand Banks of Newfoundland
The Grand Banks of Newfoundland are located south and east of the island of Newfoundland. They are comprised of a grouping of submerged banks including the Grand Bank, Whale Bank, Green Bank and St. Pierre Bank. Most of the bank areas are found at depths up to 200 metres with the majority of area between 51 - 100 metres. The continental slope is quite steep along the southern and eastern portions of the banks and depths reach to beyond 1000 metres over a relatively short distance. The slope to the north, northeast and west (of St. Pierre Bank) is much more gradual. The Grand Bank is deeply incised with submarine canyons along the southern and southeast areas and the Nose and Tail of the Grand Bank lie beyond the Canadian 200 nautical mile Exclusive Economic Zone (EEZ).

Map depicting the Grand Banks of Newfoundland
Grand Banks NAFO Areas
The Grand Banks are located within the Northwest Atlantic Fisheries Organization’s (NAFO) Divisions 3LNOP. According to Halliday and Pinhorn (1990) the Northwest Atlantic was first divided for the purposes of collecting fishery statistics in the 1930s by the North American Council on Fishery Investigations (NACFI). These divisions were modified in the 1950s by the International Commission for the Northwest Atlantic Fisheries (ICNAF). The ICNAF divisions were adopted by NAFO when it came into existence in 1979. Halliday and Pinhorn (1990) indicated that cod and haddock stock structure were the main influences in statistical boundary delineation.
Halliday, R.G. and A.T. Pinhorn. 1990. The Delimitation of Fishing Areas in the Northwest Atlantic. Journal of Northwest Atlantic Fishery Science. Special Issue. Vol. 10.

Map depicting the Grand Banks NAFO Areas
Atlas Of Human Activities Study Area
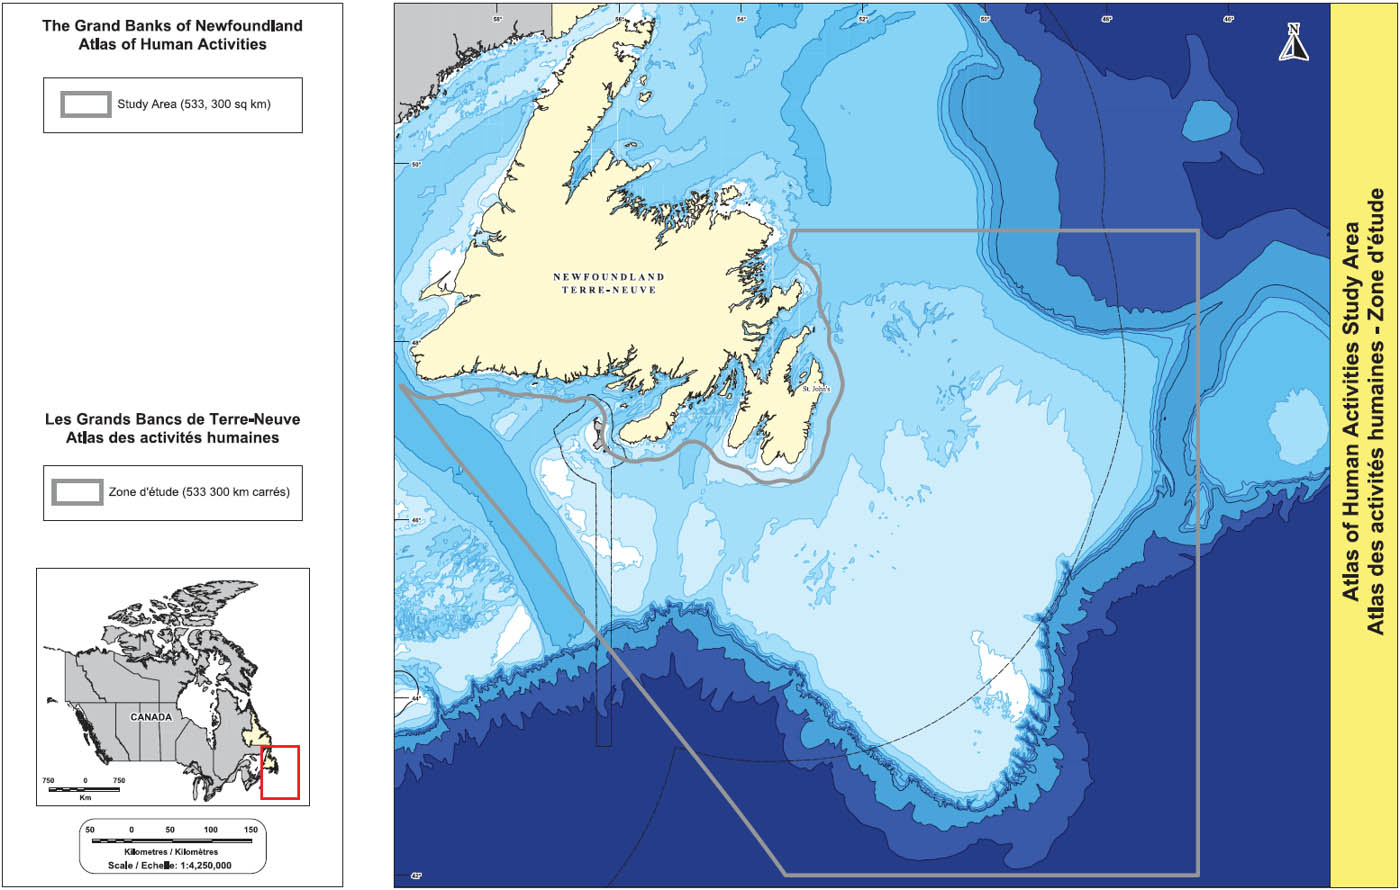
Map depicting the Atlas of Human Activities Study Area
Canada’s Oceans Act gives the Minister of Fisheries and Oceans the responsibility to lead and facilitate integrated management (IM) for Canada’s oceans. The 2005 Oceans Action Plan identified five Large Ocean Management Areas (LOMAs) as priorities for IM planning. The Placentia Bay/Grand Banks area was named as a priority LOMA because it possesses important living and non-living marine resources, areas of high biological diversity and productivity, and increasing development and competition for ocean space and resources. IM will be implemented in the LOMA at different scales including Coastal Management Areas (CMAs) as well as the larger offshore area of the Grand Banks. Planning efforts are undertaken with full participation by stakeholders who work together to develop IM plans within the LOMA. A potential LOMA boundary has been proposed based upon a mix of existing administrative boundaries and ecological considerations, but not yet finalized.
The purpose of this Atlas of Human Activities is to examine the spatial distribution of human activities in the offshore area of the Grand Banks of Newfoundland. Such an examination will contribute to management planning for the offshore component of the Placentia Bay/Grand Banks LOMA. The study area, created for the sole purpose of this atlas, encompasses an area of approximately 533,300 km2 beginning from the outer limit of the 12 nautical mile territorial sea to beyond the outer limits of the continental shelf. The western boundary is defined by the Northwest Atlantic Fisheries Organization (NAFO) line separating Subdivisions 3Pn and 3Ps from 4Vn and Division 3O from 4Vs; the eastern boundary is the NAFO line running between 3L and 3M and 3N and 3M; the northern boundary is the NAFO line between Divisions 3L and 3K and the southern boundary is defined as 42º N latitude. This study area was chosen to reflect the ecosystem-scale of IM planning. The study area boundary appears on all maps included in the atlas.
Fisheries Introduction

Figure 1 shows a sample two-minute grid overlaid on multiple points with corresponding landings reported in metric tonnes; figure 2 shows the same grid with the landings summed.
Newfoundland and Labrador has long been known for its commercial fishery, more specifically its groundfish (i.e. Atlantic cod) fishery. As a result of declining groundfish stocks and moratoria in the early 1990s, more fishing effort has been directed towards shellfish such as crab and shrimp, and large pelagics such as tuna and swordfish. Groundfish species, however, are still landed in smaller quantities. A variety of gear types and fishing methods are used, depending on the target species. These include bottom otter trawl, longline, handline, gillnet, pots, etc. As well, many types and sizes of boats are used ranging from less than 35 feet to greater than 150 feet.
Data Source
The maps within this atlas consist of commercial fisheries landings data for groundfish, large pelagics and shellfish taken from the study area and landed in the Newfoundland and Labrador Region. The data was obtained from the Policy and Economics Branch of Fisheries and Oceans Canada (DFO) Newfoundland and Labrador Region and consists of logbookFootnote 1 data from 2000 – 2003 for NAFO Divisions 3LNOP. Maps were created based on directed species, as well as five gear types used within this region. To give a more comprehensive picture of the fishing activity occurring on the Grand Banks, fisheries data for species taken from the study area and landed in the Scotia-Fundy fisheries management regionFootnote 2 (Scotia-Fundy Region) was obtained from the Policy and Economics Branch of DFO Maritimes Region. This data consists of logbook data from 2000 – 2003 for groundfish, large pelagics and shellfish. Maps for gear type are not shown for species landed in this region as the dataset did not include this information. It is important to note that landings in the Newfoundland and Labrador Region, as well as the Scotia-Fundy Region, are from Canadian vessels. This atlas does not include information pertaining to international fishing vessels (i.e. St. Pierre). It is also important to note that because this information was obtained from logbook data, not all catches (i.e. those taken from less than 35 foot vessels) are reported; as a result, this data is not portrayed in this atlas.
Methodology
For each of the fisheries landings maps, the Grand Banks study area was divided into two-minute units (cells); each cell measuring approximately 2.6 kilometres (east-west) by 3.7 kilometres (north-south). This two-minute ‘grid’ was overlaid on the fisheries data points and the total landings reported for each cell over the four-year period was summed. In the final maps only one value per cell (i.e. sum of landings in metric tonnes) was used; however, each cell may represent many fishing events over the four-year period. Figure 1 shows a sample two-minute grid overlaid on multiple points with corresponding landings reported in metric tonnes; figure 2 shows the same grid with the landings summed.
Each fisheries map was created using thematic maps based on equal count. Equal count has the same number of records in each class; thus, the total number of cells in each class is approximately the same. The highest reported landings (greater than 81 percent) fall within the red cells and the lowest reported landings (less than 20 percent) fall within the dark green cells. Readers should be aware that the map displaying groundfish landed in the Newfoundland and Labrador Region has seven classes; thus, each class accounting for approximately 14 percent of the total area. As well, all fisheries maps within the atlas have various breaks between the five classes; thus, a red cell on one map may have a much larger value than a red cell on another map.
By using equal count, readers are not able to determine where the values fall within the highest class; however, it can be determined that 80 percent of the areas where a particular species is caught, only X metric tonnes are landed (X can be any value depending on the species).
Ambiguous and Erroneous Data
More than 140,000 records have been used to show fishing activity within the atlas study area on the Grand Banks. This number accounts for species landed in the Newfoundland and Labrador Region as well as the Scotia-Fundy Region. When dealing with such a large dataset, there are many opportunities for errors and inaccuracies. For instance, many of the coordinates (latitudes and longitudes) used to show location of activity may have been entered incorrectly (i.e. incorrect coordinates entered into the logbook or coordinates were entered incorrectly in the database). Thus, this would explain why a certain species may be shown to have been caught in an unlikely location. These records have not been deleted from the database; however, readers should be aware that these errors may occur and caution should be exercised when interpreting maps.
For all records within the dataset, only one location is given for each activity (i.e. one latitude and longitude). As a result, a fishing activity that would normally cover a large area (i.e. trawling) is only shown in a single location.
Approximately 89 percent of the original number of records obtained was used to create the final maps. One reason is many of the records did not consist of viable latitude and longitude coordinates (i.e. 0º N, 0º W). As a result, records with high landings, potentially within the atlas study area, would not get included in the maps. Again, caution should be exercised when interpreting these maps; the locations/areas shown should be used as a general guide of where fishing does and does not occur.
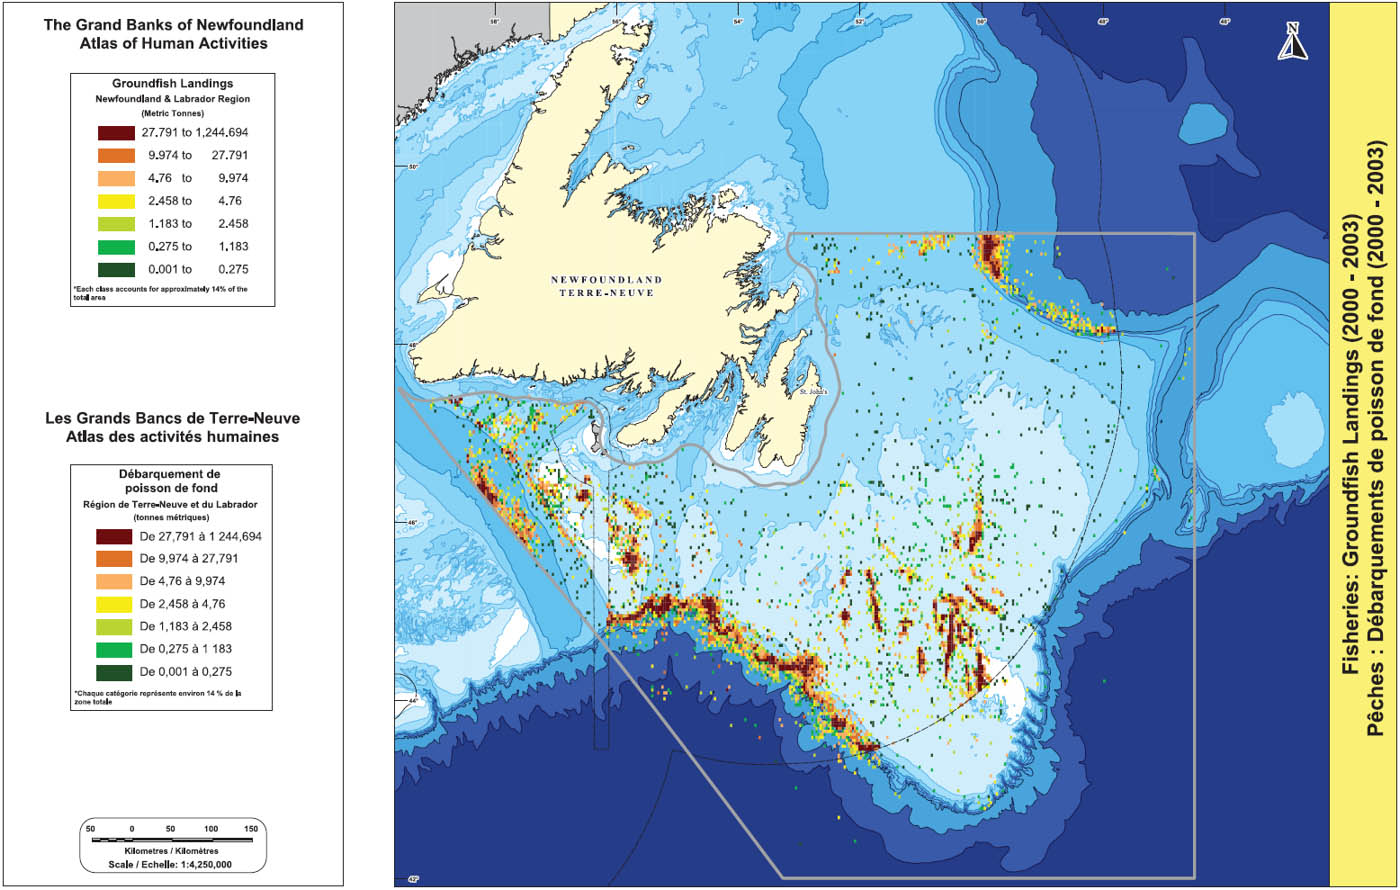
Groundfish Landings In The Newfoundland And Labrador Region (2000 – 2003)
Map of Groundfish Landings (2000 – 2003)
Groundfish landed in Newfoundland and Labrador by Canadian vessels (2000 – 2003) from the study area were associated with directed (quota) fisheries for NAFO Division 3KLMN Greenland halibut (turbot), 3LNO yellowtail flounder, 3O, 3Ps and 3Pn redfish, 3Ps and 3Pn Atlantic cod, 3LNO skate, 4VWX3NOPs Atlantic halibut, and 3Ps witch flounder. In addition to landings of species under quota, the following were either taken as by-catch or as part of non-quota fisheries: Atlantic cod in 3L and 3NO, redfish in 3LN, witch flounder in 3L and 3NO, American plaice in 3LNO and 3Ps, 3LNOPs white hake, Greenland halibut in 3Ps, monkfish in 3NO and 3Ps, pollock in 3O and 3Ps, wolffish (catfish) in 3LNO and 3Ps, haddock in 3NO and 3Ps and roughhead grenadier in 3L and 3O.
Based on logbook data, 2000 – 2003 groundfish landings from the study area were primarily taken from the following areas: the southwest slope of the Grand Bank extending northwest to the St. Pierre Bank, Burgeo Bank and Laurentian Channel, the shelf area of the Grand Bank, and the slope area to the north of the Grand Bank. Total groundfish landings (directed and by-catch) in each of the four years are as follows:
- 2000 – 27,950t
- 2001 – 32,670t
- 2002 – 29,850t
- 2003 – 31,930t
Of these landings a total of approximately 18,040t was reported as by-catch.
The majority of logbook entries indicated use of bottom otter trawl gear followed by gillnet, and longline. Lesser effort was directed using Scottish seine and mid-water trawl. Approximate annual average landings by gear type from 2000 – 2003 include: otter trawl – 21,700t, gillnet – 5,830t, longline – 1,610t, mid-water trawl – 780t and Scottish seine – 660t. Smaller amounts of groundfish (annual average less than 30t) were landed using a variety of other gear types such as baited hand lines, Danish seines, shrimp trawls, pots, etc.
The majority of groundfish (directed and by-catch) landed in Newfoundland and Labrador, from the study area, were from vessels over 100 feet in length, followed by 35 - 65 footers, 65 – 99 footers, and a fewer number of vessels less than 35 feet in length.
Groundfish Landings by Bottom Otter Trawl (2000 – 2003)
The main directed fisheries using otter trawl in the study area targeted yellowtail flounder, redfish, Greenland halibut and skate. Cod was targeted by otter trawl to a lesser degree in 3Ps and by-catch of American plaice and cod was noteworthy in some otter trawl fisheries. Based on logbook data, average annual landings (directed and by-catch) of dominant species over the four year time period are as follows:
- Yellowtail flounder – 11,040t
- Redfish – 4,610t
- Cod – 2,090t
- American plaice – 1,530t
- Greenland halibut – 950t
Landings by otter trawl were distributed throughout the study area including the slope near the 3KL boundary, the shelf area and southwest slope of the Grand Bank and Whale Bank, south of Halibut Channel, Haddock Channel, Green Bank and St. Pierre Bank, the shelf area of St. Pierre Bank, and the Laurentian and Hermitage Channels.

Map depicting Groundfish Landings by Bottom Otter Trawl (2000 – 2003)
Groundfish Landings by Gillnet (2000 - 2003)
The main directed fisheries using gillnet in the study area targeted cod, monkfish, Greenland halibut, skate and white hake. Based on logbook data, average annual landings (directed and by-catch) of dominant species over the four year time period are as follows:
- Cod – 2,050t
- Monkfish – 1,320t
- Greenland halibut – 1,130t
- Skate – 540t
- White hake – 350t
Landings by gillnet in the study area were primarily taken from north of the Grand Bank in 3L, the southwest slope of the Grand Bank and Whale Bank, the southern portions of Halibut and Haddock Channels, the shelf area of the St. Pierre Bank, Burgeo Bank and the Hermitage Channel.

Map depicting Groundfish Landings by Gillnet (2000 – 2003)
Groundfish Landings by Longline (2000 – 2003)
The main directed fisheries using longline in the study area targeted cod, skate, white hake and halibut. Haddock also appeared as a substantial by-catch in longline fisheries. Based on logbook data, average annual landings (directed and by-catch) of dominant species over the four year time period are as follows:
- Cod – 580t
- White hake – 350t
- Skate – 320t
- Halibut – 120t
- Haddock – 110t
Landings by longline in the study area were primarily taken from along the southwest slope of the Grand Bank and Whale Bank, the southern portions of Halibut and Haddock Channels as well as the shelf areas of St. Pierre and Burgeo Banks. Some landings were also taken from the shelf area of the Whale Bank and Grand Bank, as well as the Nose and Tail of the Grand Bank.

Map depicting Groundfish Landings by Longline (2000 – 2003)
Groundfish Landings by Scottish Seine (2000 – 2003)
The main directed fisheries using Scottish seine in the study area targeted cod and yellowtail flounder. American plaice also appeared as the most significant by-catch in Scottish seine fisheries. Based on logbook data, average annual landings (directed and by-catch) of dominant species over the four year time period are as follows:
- Cod – 500t
- Yellowtail flounder – 120t
- American plaice – 40t
Landings by Scottish seine in the study area were taken from the Grand Bank, the St. Pierre Bank and the southern portion of Halibut Channel.
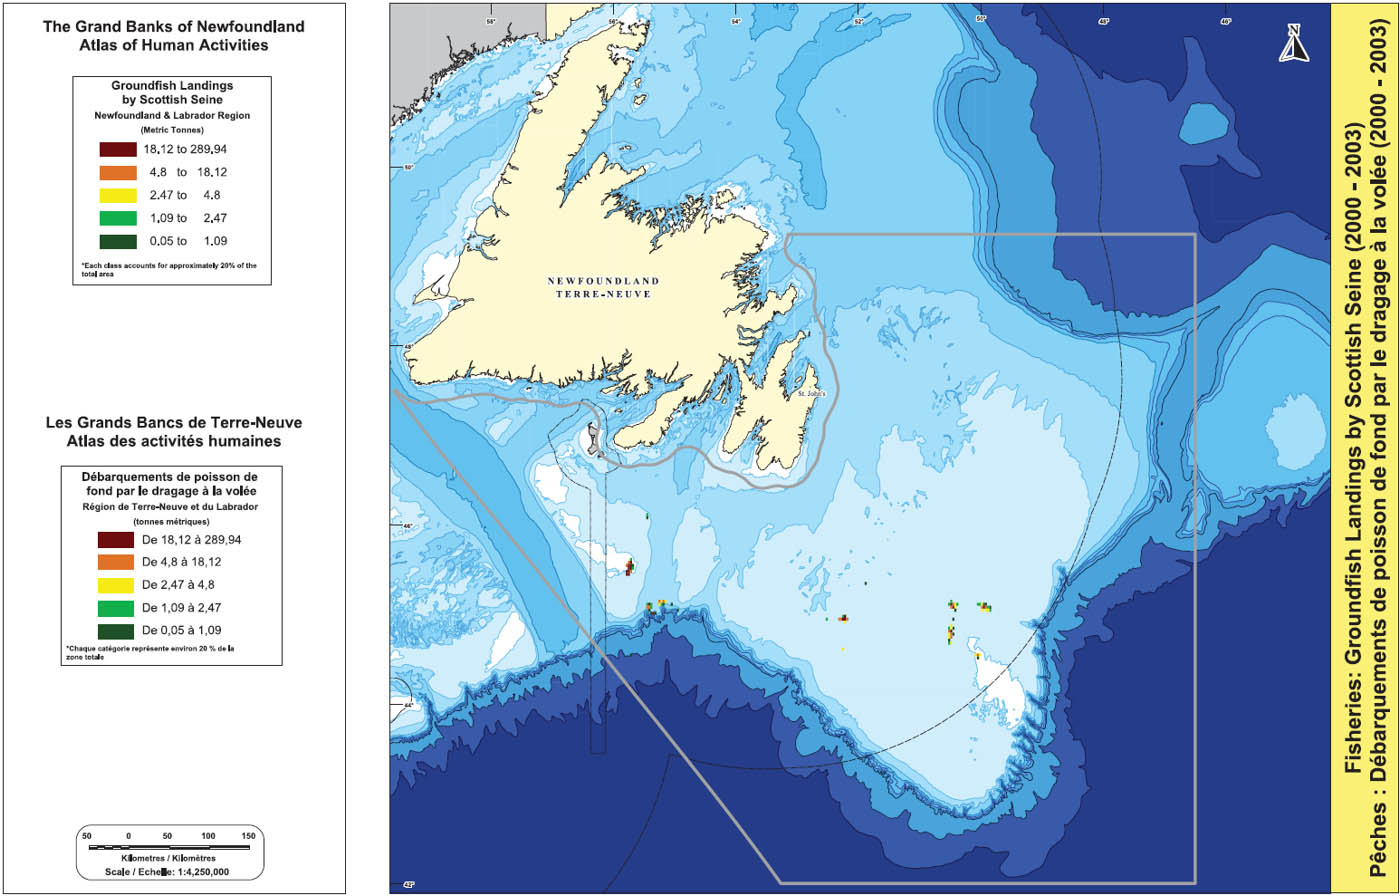
Map depicting Groundfish Landings by Scottish Seine (2000 – 2003)
Groundfish Landings by Mid-Water Trawl (2000 – 2003)
The main directed fishery using mid-water trawl in the study area primarily targeted redfish. Based on logbook data, average annual landings of redfish over the four year time period was 770t. In addition to redfish, species such as cod, white hake, pollock and Greenland halibut were taken (in relatively small amounts) as by-catch.
Landings by mid-water trawl in the study area were primarily taken from the Laurentian and Hermitage Channels.

Map depicting Groundfish Landings by Mid-water Trawl (2000 – 2003)
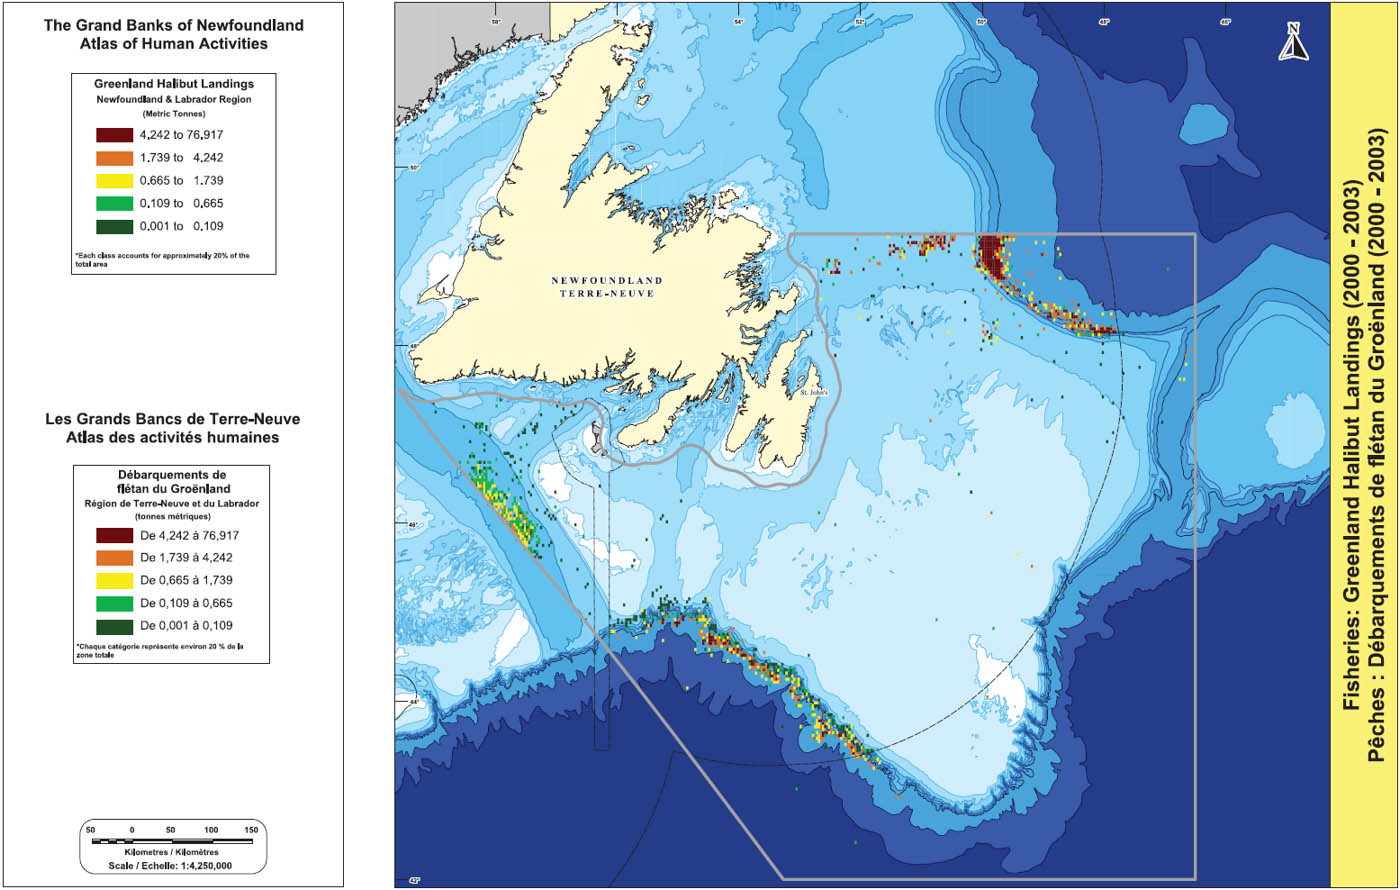
Greenland Halibut Landings in the Newfoundland and Labrador Region (2000 – 2003)
Map of Greenland Halibut Landings (2000 – 2003)
What started as a deepwater bay fishery in the 1960s, the Greenland halibut (turbot) fishery is now focused offshore in areas along the continental slope. In recent years, the majority of Newfoundland and Labrador Greenland halibut landings have been taken from the northern portion of the study area in Division 3K. However, fisheries for this species are prosecuted within the management area.
Newfoundland and Labrador 2000 – 2003 Greenland halibut landings from the study area were taken from the slope area to the north of the Grand Bank, the southwest slope of the Grand Bank and Whale Bank and from the Laurentian Channel. Based on logbook data, highest landings were taken from the northern slope area near the 3K/3L boundary. Landings from 3LNO averaged approximately 2,300t per year with a high of 3,500t in 2000 and a low of 1,200t in 2003 (Brodie and Power 2004).
Gillnet was the dominant gear type in this fishery from 2000 - 2002 followed by otter trawl and minimal longline catches (Brodie and Power 2004). In 2003 however, the majority of catch was taken by otter trawl from the northern slope area near the 3K/3L boundary. June to August was the key period for Greenland halibut landings. Gillnet mesh size can be no less than 190 millimetres and minimum codend mesh size in otter trawl fisheries has been set at 145 millimetres (Brodie and Power 2004).
By-catches of cod and snow crab have been evident in gillnet fisheries and American plaice and witch flounder are common by-catches in otter trawl fisheries. Greenland halibut are taken as by-catch in Canadian shrimp fisheries (Brodie and Power 2004).
Brodie, W.B. and D. Power. 2004. The Canadian Fishery for Greenland Halibut in Subarea 2 + Divisions 3KLMNO, with Emphasis on 2003. NAFO SCR Doc. 04/33. Northwest Atlantic Fisheries Organization.
Yellowtail Flounder Landings in the Newfoundland and Labrador Region (2000 – 2003)
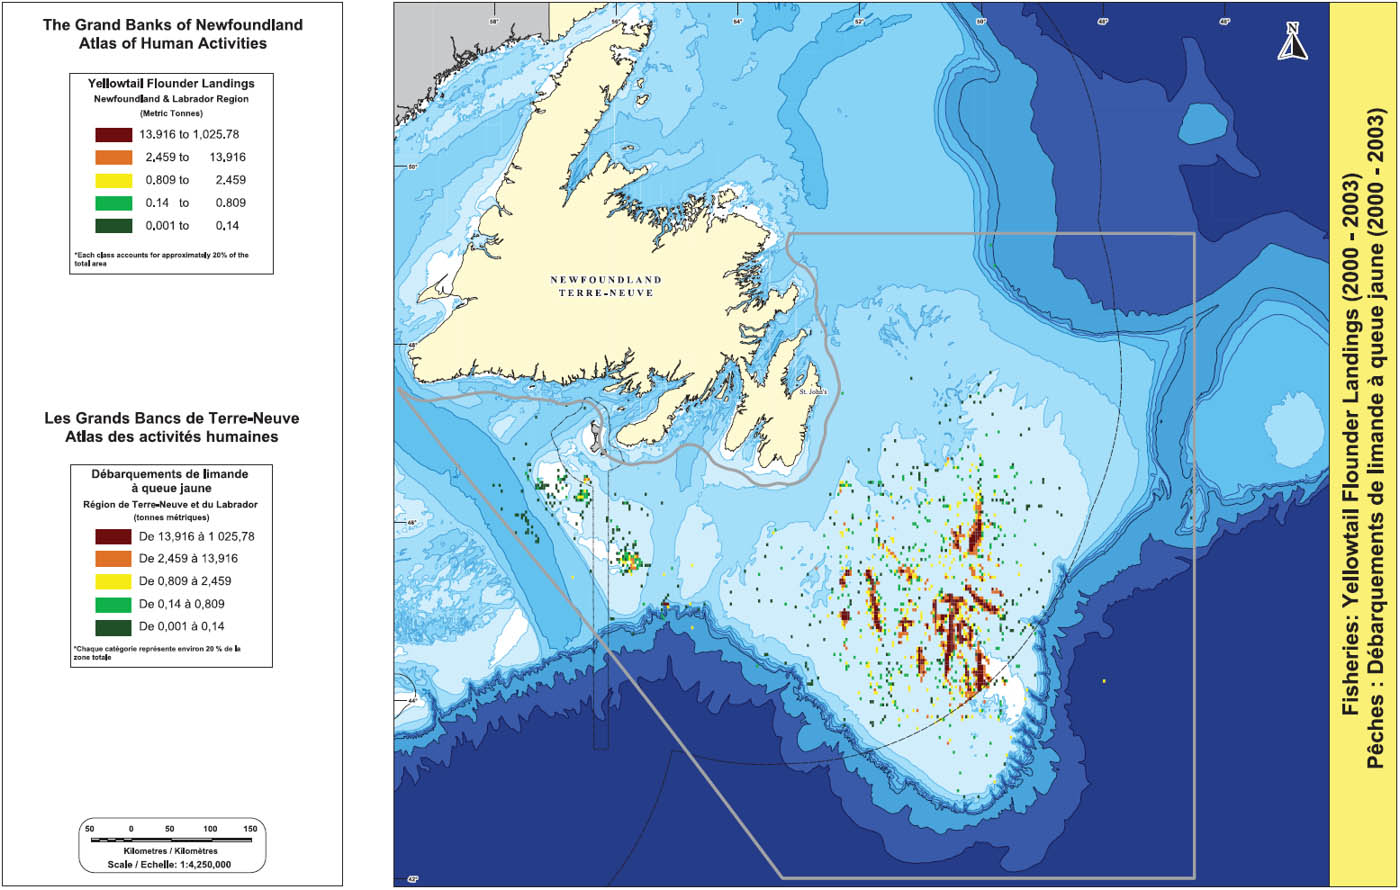
Map of Yellowtail Flounder Landings (2000 – 2003)
The yellowtail flounder fishery in division 3LNO began in the early 1960s following a drastic decline in haddock stocks (Brodie et al. 2004). Until 1994, yellowtail flounder was targeted as part of a mixed fishery along with cod and American plaice. The directed fishery for yellowtail flounder was closed from 1994 to 1998 following stock decline. The stock recovered and the fishery reopened in 1998 with careful consideration of reducing by-catches of cod and American plaice for which fisheries remain closed. Canada is allocated 97.5 percent of the 3LNO yellowtail flounder quota of which Fishery Products International (FPI) receives 90 percent (Brodie et al. 2004). The total allowable catch (TAC) was set at 10,000t in 2000, 13,000t in 2001 and 2002, and 14,500t in 2003.
The fishery is located on the Grand Bank in water depths between 50 and 70 metres (Kulka 2002). According to logbook data, the majority of catches came from north and west of the Southeast Shoal in 3N as well as an area in 3O just east of 52oW longitude. Division 3LNO landings from 2000 – 2003 averaged approximately 11,000t per year. A high of 12,740t was landed in 2003 and a low of 9,550t was landed in 2000 which corresponded to TAC levels. In addition to 3LNO landings, by-catches of yellowtail flounder were taken from the St. Pierre Bank and Laurentian and Halibut Channels in 3Ps.
Otter trawl is the dominant gear associated with this fishery and some small catches are taken by seine. Most fishing effort has occurred in April, May, October and November (Kulka 2002), but catches are landed in all months of the year. Peak landings have occurred in October (Brodie et al. 2004).
Conservation measures implemented in association with the yellowtail flounder fishery include: minimum mesh size, by-catch protocols, use of sorter grates, minimum fish size, 100 percent observer coverage, dockside monitoring, and spawning period closures (Brodie et al. 2004).
Brodie, W.B., D.W. Kulka and D. Power. 2004. The Canadian Fishery for Yellowtail Flounder in NAFO Divisions 3LNO in 2002 and 2003. NAFO SCR Doc. 04/41. Northwest Atlantic Fisheries Organization.
Kulka, D.W.. 2002. Description of the 2001 Yellowtail Flounder Fishery on the Grand Banks with a Comparison to Past Years. NAFO SCR Doc. 02/73. Northwest Atlantic Fisheries Organization.
Redfish Landings in the Newfoundland and Labrador Region (2000 – 2003)

Map of Redfish Landings (2000 – 2003)
Redfish fisheries target deep sea redfish and Acadian redfish which share very similar characteristics. Foreign vessels from Portugal, Spain and Russia have traditionally dominated the fisheries in Divisions 3LNO.
The relationship between redfish stocks in Divisions 3LNO is complicated and unclear, but the stocks are managed as separate 3LN and 3O stocks (Vaskov 2004). Since 1993 redfish in 3Ps and 3Pn have been managed as part of redfish management Unit 2 that also includes subdivisions 4Vs and 4Vn (DFO 2004).
The fishery in Division 3LN has been closed since 1998, but by-catch of redfish occurs mainly in the Greenland halibut fishery on the slope area near the 3K/3L boundary. Greatly exceeded total allowable catches (TAC) of redfish in the mid 1980s to mid 1990s preceded a period of declining catches and the eventual moratorium on this species (Power 2003a).
A directed fishery targets 3O redfish and Canadian landings are minimal compared to those taken by foreign vessels. From 2000 – 2003 the Canadian fishery was prosecuted under a TAC of 10,000t. Landings have been far lower than the TAC in recent years and have ranged from 880t in 2000 to 4,550t in 2001. Canadian fisheries have also implemented a small fish protocol and fish less than 22 centimetres in length cannot be retained.
The main period for the fishery is from May to October and otter bottom trawl is the dominant gear employed by Newfoundland and Labrador vessels (Power 2003b). Landings were primarily taken from the southwest slope of the Grand Bank and Whale Bank.
Based on logbook data, redfish landings from 3Ps were taken primarily from the slope area south of the Halibut Channel, Haddock Channel and St. Pierre Bank as well as the Laurentian Channel, Burgeo Bank, St. Pierre Bank and Hermitage Channel. Total landings from 3Ps from 2000 – 2003 were approximately 9,900t and 3Pn landings from the same period were approximately 84t. Landings from 3Ps averaged approximately 2,475t per year with a high of 3,580t in 2000 and a low of 1,660t in 2001. By-catch of cod has been noted in the 3Ps redfish fishery with the highest by-catch rates in the winter and the lowest in summer (Chen 2004). Total Unit 2 landings in 2003 were primarily comprised of the 1980, 1988 and 1994 year classes.
Chen, N.Y.. 2004. Estimates of 3Ps by-catch of cod in otter trawl fishery. Can. Sci. Advis. Sec. Research Doc. 2004/035.
DFO. 2004. Unit 2 Redfish. Can. Sci. Advis. Sec. Stock Status Report 2004/016.
Power, D.. 2003a. An Assessment of the Status of the Redfish in NAFO Divisions 3LN. NAFO SCR Doc. 03/55.
Power, D.. 2003b. An Assessment of the Status of the Redfish in NAFO Division 3O. NAFO SCR Doc. 03/63.
Vaskov, A.A.. 2004. On the issue of Redfish Management in Division 3O. NAFO SCR Doc. 04/8. Northwest Atlantic Fisheries Organization.
Atlantic Cod Landings in the Newfoundland and Labrador Region (2000 – 2003)
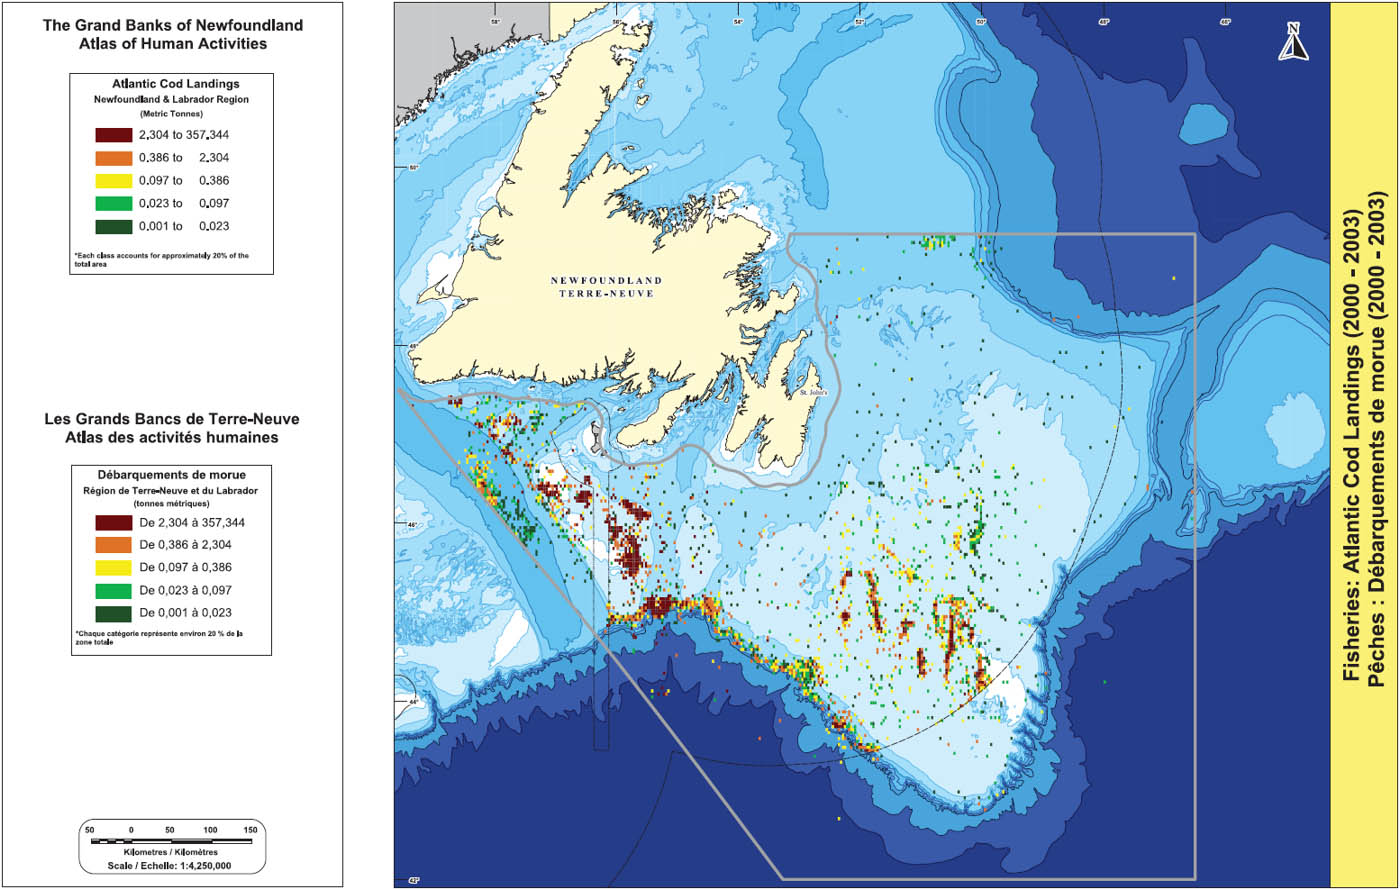
Map of Atlantic Cod Landings (2000 – 2003)
Four Atlantic cod stocks are located within the study area: 2J3KL “northern cod”, 3NO “Grand Banks cod”, 3Ps “south coast cod” and 3Pn portion of 3Pn/4Rs “northern gulf” cod.
Following stock decline, the 2J3KL cod fishery closed in 1992, but a limited inshore fishery opened in 1998 to target stronger inshore components of the stock. This fishery was closed again in 2003. In 2003, the majority of by-catch of this stock occurred inshore in gillnet fisheries targeting winter flounder in Bonavista and Trinity Bays and offshore by-catch from Canadian trawlers was 3t. Estimated by-catch by foreign trawlers from 2000 - 2002 was 50 – 80t annually (DFO 2004a).
Due to extremely low stock levels the 3NO cod fishery was closed in 1994. Despite the moratorium, total by-catch levels have increased from 170t in 1995 up to over 2000t in 2002. Despite efforts to reduce cod by-catch in Canadian fisheries such as those for yellowtail flounder, Canadian by-catches have ranged from approximately 170t in 2000 to 710t in 2003 and were taken from north and west of the Southeast Shoal and along the southwest slope of the Grand Bank and Whale Bank. By-catch levels are now considered to be impeding stock recovery (Healey et al. 2003).
The 3Ps cod fishery was closed in 1993 and re-opened in 1997 (DFO 2004b). The total allowable catch (TAC) was established at 20,000t in 2000 and 15,000t annually from 2001 – 2003. The quota is split between Canada and France (St. Pierre and Miquelon) with Canada receiving the largest portion. Fixed gear catches are higher than those from mobile gear (i.e. 76.5 percent from fixed in 2003) in the Canadian fishery. According to logbook data, landings from 2000 – 2003 averaged approximately 4,570t per year with a high of 6,780t in 2000 and a low of 3,590t in 2002. Atlantic cod landings from 3Ps were taken mainly from the southern portions of the Halibut Channel and Green Bank, the St. Pierre Bank, Burgeo Bank and the Laurentian and Hermitage Channels. Highest landings were taken mainly from the southern portion of the Halibut Channel and the eastern portion of St. Pierre Bank. Landings in 2003 were comprised largely of the 1997 and 1998 year classes and these are likely to dominate the fishery in the coming years.
Concerns associated with the fishery include potential under-reporting due to the establishment of trip limits and individual quotas, as well as the discarding of small fish in the hook and line fishery. A complex series of time and area closures has been introduced to address concerns about stock mixing and disruption of spawning (DFO 2004b).
Cod landings from 3Pn averaged less than 200t. The cod fishery was closed in 3Pn in 2003.
DFO. 2004a. Northern (2J+3KL) Cod. Can. Sci. Advis. Sec. Stock Status Report. 2004/011.
DFO. 2004b. Subdivision 3Ps Cod. Can. Sci. Advis. Sec. Stock Status Report. 2004/039.
Healey, B. P., E.F. Murphy, D.E. Stansbury and J. Brattey. 2003. An Assessment of the Cod Stcok in NAFO Divisions 3NO. NAFO SCR Doc. No. 03/59.
Skate Landings in the Newfoundland and Labrador Region (2000 – 2003)
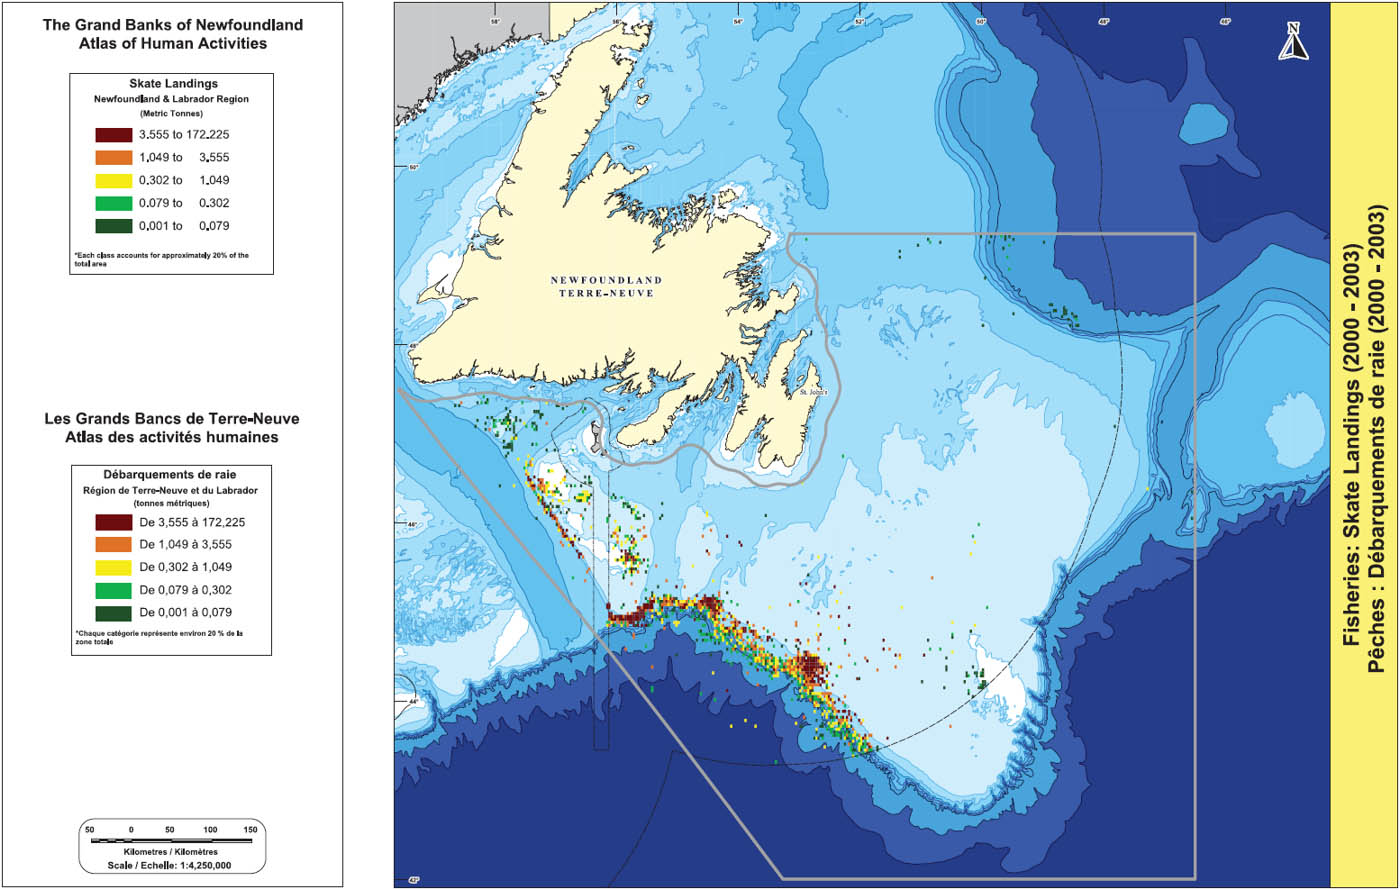
Map of Skate Landings (2000 – 2003)
Skate fisheries in the study area primarily target thorny skate for which the stock management area covers Divisions 3LNO and subdivision 3Ps. Prior to 1993, skate was only taken as by-catch in Canadian fisheries and they comprised the most common by-catch in offshore trawler catches (DFO 2003). A limited directed skate fishery was only established by Canada following the decline in stocks of other groundfish. The fishery has been prosecuted on the southwest slope of the Grand Bank, Whale Bank and St. Pierre Bank (DFO 2004). Landings in 2000 – 2003 were also taken from the Burgeo Bank and Southeast Shoal area on the Grand Bank. A total allowable catch (TAC) was established for the first time in 1995 (DFO 2003).
Skate landings have increased in recent years as fisheries targeted increasingly more aggregated skate concentrations. While historically skate were more widely distributed over the Grand Bank, currently 90 percent of the biomass is concentrated in 20 percent of their former range (near the edge of the southwest Grand Banks) (DFO 2003). According to logbook data, 2000 – 2003 landings averaged approximately 1,620t with a high of 2,040t in 2002 and a low of 1,100t in 2000. Highest landings were taken from the southern St. Pierre Bank. Low value and limited markets result in the TAC not being completely taken. The fishery is prosecuted with longline, gillnet and otter trawl.
DFO. 2003. Thorny Skate in Divisions 3L, 3N, 3O, and Subdivision 3Ps. DFO Can. Sci. Advis. Sec. Stock Status rep. 2003/023.
DFO. 2004. Thorny skate (Amblyraja radiata Donovan, 1808) on the Grand Banks of Newfoundland. NAFO SCR. Doc. 04/35. Northwest Atlantic Fisheries Organization.
Witch Flounder Landings in the Newfoundland and Labrador Region (2000 – 2003)

Map of Witch Flounder Landings (2000 – 2003)
Witch flounder within the study area are comprised of the 2J3KL, 3NO and 3Ps stocks. Fisheries for witch flounder began in the 1960s and were primarily prosecuted by Canada, USSR/Russia and European nations (Maddock Parsons 2004a; 2004b).
Due to poor stock conditions, directed fisheries for witch flounder in 2J3KL and 3NO have been under moratorium since 1994. Despite the moratorium, witch flounder are taken as by-catch in fisheries such as those for Greenland halibut (Brodie and Power 2004). By-catch in 3L corresponds with the area of highest Greenland halibut landings and 3NO landings correspond with the main location of yellowtail flounder fisheries. Additional landings were taken from the southwest slope of the Grand Bank and Whale Bank. Canadian 2J3KL by-catch ranged from 85t in 2000 to 166t in 2002. Canadian 3NO by-catch ranged from 12t in 2000 to 62t in 2003. In contrast, foreign by-catch has reached over 600t per year in 2J3KL and over 1,400t per year in 3NO (Maddock Parsons 2004a; 2004b).
The witch flounder fishery in 3Ps has operated under a total allowable catch (TAC) of 650t per year from 1998 – 2003 and catches have been mostly over 550t (DFO 2003). According to logbook data, the main area for 3Ps landings had focused on the slope at the southern end of Halibut and Haddock Channels as well as the Laurentian and Hermitage Channels. Highest landings were taken from the southern portion of Halibut Channel. Otter trawl is the main gear used in the fishery.
Recruitment has been stable over 20 years and fishing at current levels should not be harmful to the stock (DFO 2003).
Brodie, W.B. and D. Power. 2004. The Canadian Fishery for Greenland Halibut in Subarea 2 + Divisions 3KLMNO, with Emphasis on 2003. NAFO SCR Doc. 04/33. Northwest Atlantic Fisheries Organization.
DFO. 2003. Newfoundland and Labrador Region Groundfish Stock Updates. Can. Sci. Advis. Sec. Stock Status Report. 2003/049.
Maddock Parsons, D., 2004a. An update of Witch Flounder Population Trends in NAFO Divisions 2J, 3K, and 3L. NAFO SCR Doc. 04/42. Northwest Atlantic Fisheries Organization.
Maddock Parsons, D., 2004b. Witch Flounder in NAFO Divisions 3NO. NAFO SCR Doc. 04/43. Northwest Atlantic Fisheries Organization.
Atlantic Halibut Landings In The Newfoundland And Labrador Region (2000 – 2003)
The management unit for Atlantic halibut includes Divisions and subdivisions 4VWX3NOPs and the bulk of the fishery takes place on the eastern Scotian Shelf (in 4Vs and 4W) (Zwanenburg et al. 2003). Halibut are generally landed along with a suite of species including cusk, cod and white hake and longline is the dominant gear type. The total allowable catch (TAC) for the entire halibut management area was set at 1,000t in 2000 and was raised to 1,150t from 2001 – 2002 and 1,300t in 2003. Total Canadian catch from Divisions 3NOP averaged approximately 440t from 2000 – 2002 with a high of 520t in 2001 and a low of 350t in 2000 (Zwanenburg et al. 2003).
Logbook data indicates 2000 – 2003 Newfoundland and Labrador Atlantic halibut landings from 3NOP averaged approximately 230t. An additional 30t was taken from 3L outside the 200 nautical mile limit on the Nose of the Grand Bank. Landings were taken from the Grand Bank north and west of Southeast Shoal, the southwest slope of the Grand Bank and Whale Bank, south of Halibut and Haddock Channels, St. Pierre Bank, the Laurentian Channel, Burgeo Bank and the Hermitage Channel.
Zwanenburg, K., S. Wilson, R. Branton and P. Brien. 2003. Halibut on the Scotian Shelf and Southern Grand Banks – Current Estimates of Population Status. CSAS Res Doc. 2003/046. Canadian Science Advisory Secretariat.

Map of Atlantic Halibut Landings (2000 – 2003)
American Plaice Landings In The Newfoundland And Labrador Region (2000 – 2003)
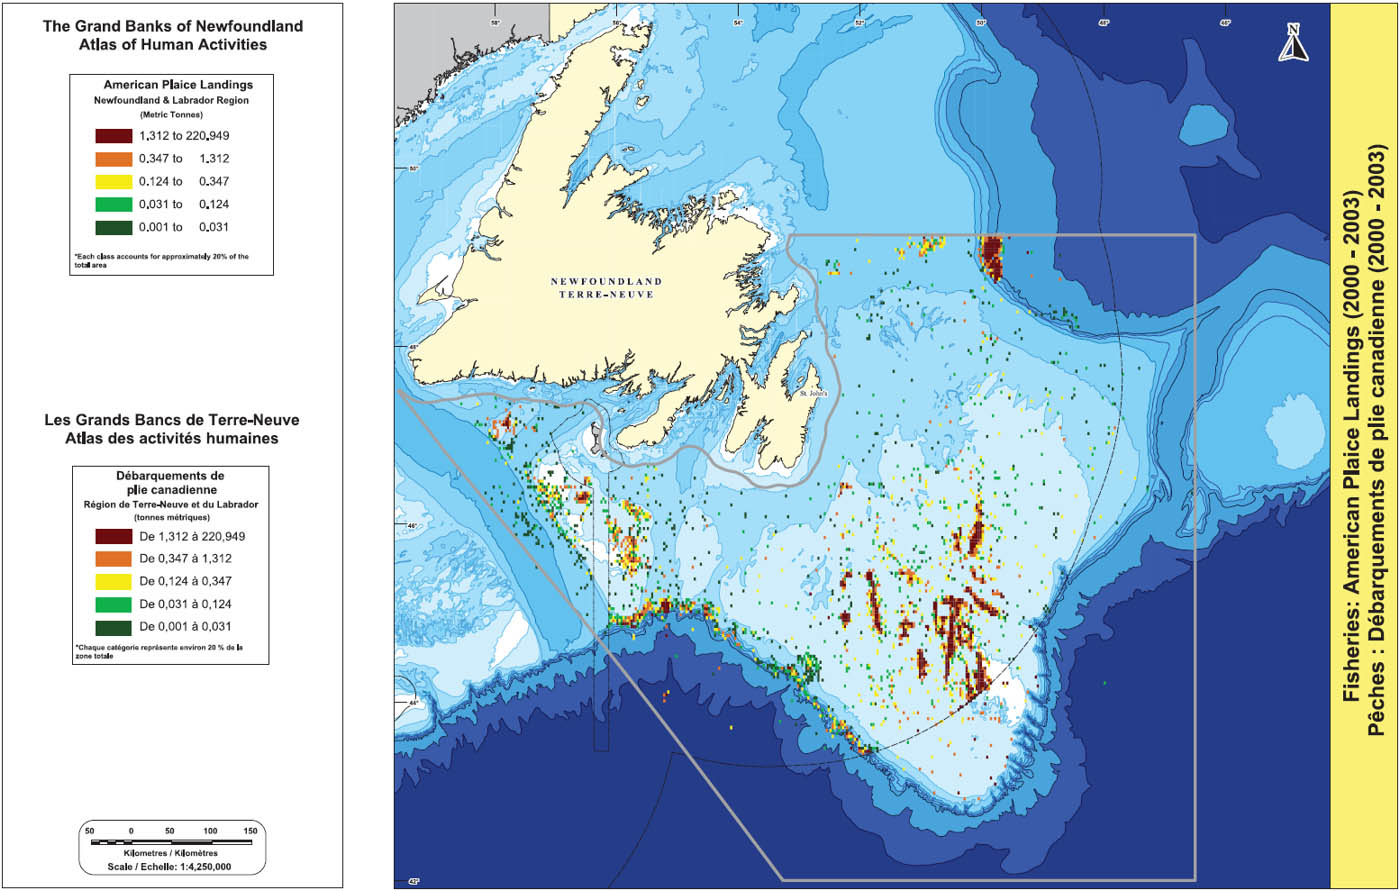
Map of American Plaice Landings (2000 – 2003)
The two American plaice stocks associated with the study area are the 3LNO stock and the 3Ps stock. 3LNO American plaice were historically targeted in a mixed fishery with cod and yellowtail flounder and landings averaged 40,000 – 50,000t per year throughout the 1970s and 1980s (Dwyer and Morgan 2004). Stock declines in the early 1990s resulted in low catches and eventual moratoria on fisheries that have lasted since 1993.
Despite the moratorium, American plaice is still taken as by-catch primarily in the Canadian yellowtail flounder fishery on the Grand Bank as well as in foreign fisheries for skate and Greenland halibut in the NAFO Regulatory Area (Dwyer and Morgan 2004). Logbook data also indicates by-catch taken from northern 3L in the area of the highest Canadian landings of Greenland halibut as well as the Grand Bank area corresponding to the yellowtail flounder fishery. Canadian by-catch averaged almost 1,300t from 2000 – 2003 with a high of approximately 1,600t in 2001 and a low of 620t in 2000 (Dwyer and Morgan 2004). In comparison, foreign vessels from Spain, Portugal and Russia landed an average of approximately 1,800t over the same period.
The 3Ps stock has also been under moratorium since 1993 and the stock condition is quite poor. The stock continues to be taken as by-catch in fisheries for cod and witch flounder. By-catches have totalled approximately 650t in 2000 and 2003 and reached over 1000t in 2001 and 2002 (DFO 2003). By-catch levels are extremely high in the witch flounder fishery. There appears to be little prospect of stock recovery in the short to medium term (Dwyer and Morgan 2004).
DFO. 2003. Newfoundland and Labrador Region Groundfish Stock Updates. Can. Sci. Advis. Sec. Stock Status Report. 2003/049.
Dwyer, K.S. and M.J. Morgan. 2004. A stock status update on American Plaice in NAFO Divisions 3LNO. NAFO SCR. Doc. 04/47.
White Hake Landings in the Newfoundland and Labrador Region (2000 – 2003)
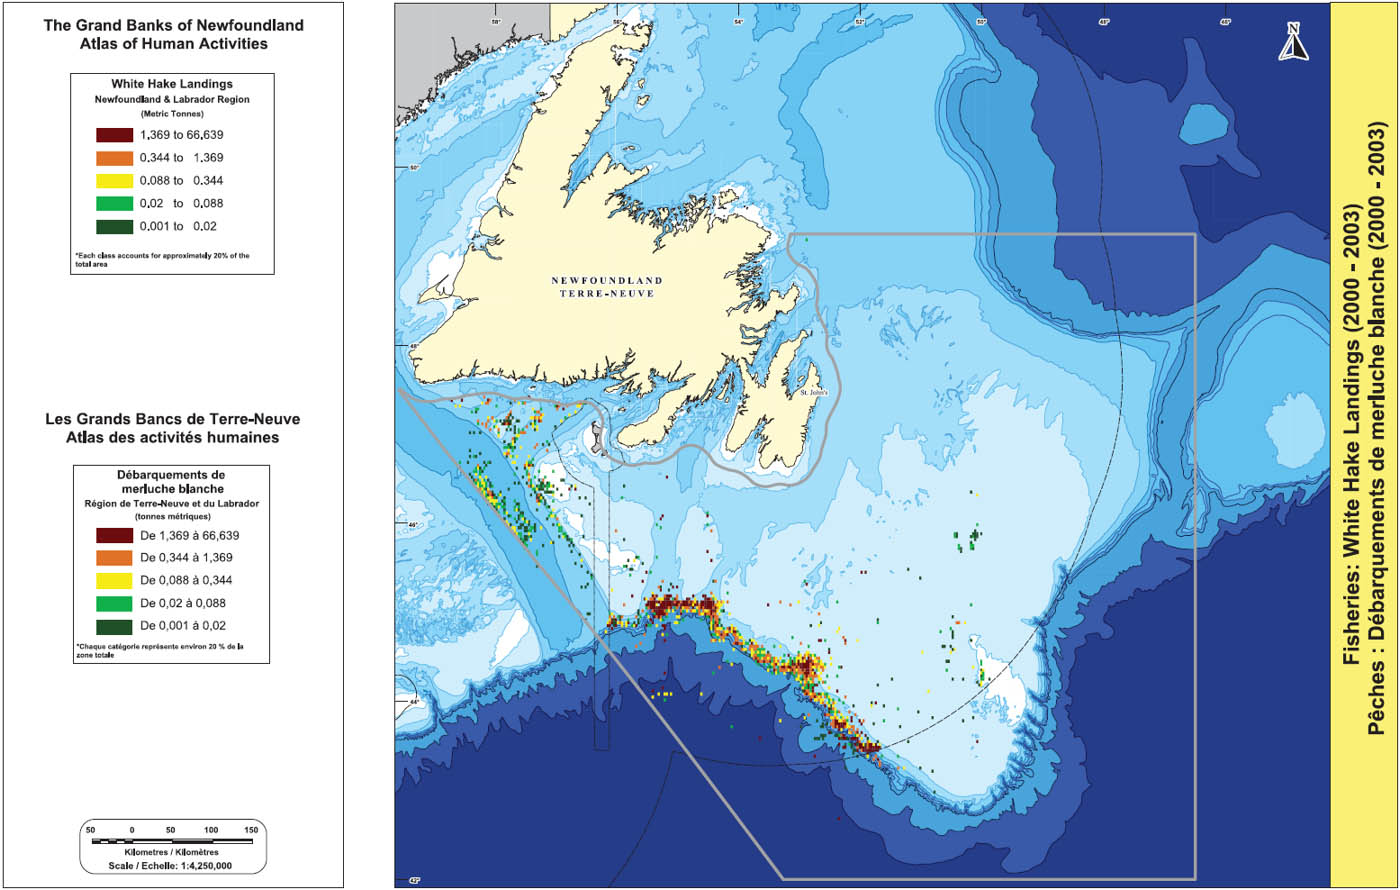
Map of White Hake Landings (2000 – 2003)
Directed Canadian fisheries for white hake were historically focused in the Gulf of St. Lawrence, on the Scotian Shelf and Georges Bank. With the decline of traditionally targeted groundfish stocks on the Grand Banks, an experimental trawl fishery was initiated for white hake in 1993 (Kulka et al. 2004). These were found in abundance in 3LNO and 3Ps and a directed fishery began in 1994. This is a mixed fishery with hake being taken in conjunction with cod, monkfish and skate. During this period, there was no quota established for the hake fishery and effort was only regulated by closures due to excessive by-catch of other species (Kulka et al. 2004).
According to logbook data, 2000 – 2003 landings from the study area averaged approximately 800t per year with a high of 927t in 2002 and a low of 719t in 2003. Landings from 2000 – 2003 were mainly taken from the southwest slope of the Grand Bank and Whale Bank, as well as the southern portions of Halibut and Haddock Channels. This corresponds with the warm water-influenced hake distribution in that area. Landings were also taken from the Laurentian Channel, St. Pierre and Burgeo Banks, the western slope of St. Pierre Bank, and the Hermitage Channel. Gillnet and longline are the predominant gear types used in the fishery. Monkfish was the most common by-catch in gillnet fisheries; of species under moratoria, cod was the most common by-catch in longline fisheries (Kulka et al. 2004). There is concern about overlap between distributions of white hake, cod and American plaice that makes the potential for cod and plaice by-catch significant. White hake are taken as by-catch in Canadian redfish, monkfish and halibut fisheries, and to a lesser extent in Canadian skate and Greenland halibut fisheries.
Kulka, D.W., K. Sosobee, C.M. Miri and M. Simpson. 2004. The Status of White Hake (
Monkfish Landings in the Newfoundland and Labrador Region (2000 – 2003)
The stock structure of monkfish is unknown, but on the Grand Banks the distribution tends to be restricted to the southwest slope of the Grand Bank as well as the adjacent Laurentian Channel (DFO 2003). Historically monkfish was only taken as by-catch, but experimental trawl (1991) and gillnet (1993 – 1994) fisheries led to the development of a limited directed fishery prosecuted primarily by gillnet. Landings have been quite low as indicated by catches of only 125t in 2000. However, improved market conditions led to increased landings of 2,400t in 2002 and 2,800t in 2003 (DFO 2003). There is no quota established for this fishery. True to distributions, main landings have come from the southwest slope of the Grand Bank and Whale Bank as well as the southern and western slopes of St. Pierre Bank. Monkfish are a common by-catch in white hake fisheries using gillnet and white hake are taken as by-catch in monkfish fisheries as well (Kulka et al. 2004).
DFO. 2003. Monkfish in Divisions 3L, 3N, 3O and subdivision 3Ps. DFO Can. Sci. Advis. Sec. Stock Status Report.2003/045.
Kulka, D.W., K. Sosobee, C.M. Miri and M. Simpson. 2004. The Status of White Hake (Urophycis tenuis), in NAFO Divisions 3L, 3N, 3O, and Subdivision 3Ps. NAFO SCR Doc. 04/57. Northwest Atlantic Fisheries Organization.

Map of Monkfish Landings (2000 – 2003)
Pollock Landings in the Newfoundland and Labrador Region (2000 – 2003)
Pollock in southern Newfoundland waters are at the northern extent of their range and have not been a significant target for commercial fisheries (DFO 2003). The species has been regulated as by-catch only since 1993 and catches are mainly taken from 3Ps. Most landings occur as by-catch by Canadian and French (St. Pierre and Miquelon) vessels targeting cod with otter trawl and gillnets. Landings averaged 5,500t in the 1950s, but logbook data indicates 2000 – 2003 landings have ranged from approximately 30 – 390t. Highest 2000 – 2003 landings came from the southern portion of the Halibut Channel.
DFO. 2003. Newfoundland and Labrador Region Groundfish Stock Updates. Can. Sci. Advis. Sec. Stock Status Report. 2003/049.

Map of Pollock Landings (2000 – 2003)
Haddock Landings in the Newfoundland and Labrador Region (2000 – 2003)
Historically, haddock had the highest biomass of any groundfish species on the Grand Banks (Casey 2000), but abundance has been low since the 1970s with a slight increase in the mid to late 1980s (FRCC 2001). Heavy fishing pressure from the 1940s to the 1960s and high juvenile discard rates negatively impacted stocks. Fishing pressure in the 1980s in response to increased abundance again reduced stocks to low levels. The FRCC (2001) stated, “The Council noted in 1995 that there had been no signs of improved recruitment and there were no prospects for (3LNO) stock improvement in the near future.”
Due to poor stock conditions there are no directed fisheries for haddock in Divisions 3LNOP. However, the species is reportedly taken as by-catch in cod (3Ps) and yellowtail flounder (3NO) fisheries (DFO 2003) as well as longline fisheries for species such as skate, white hake and Atlantic halibut.
Logbook data indicates 2000 - 2003 by-catch landings of haddock averaged approximately 180t.
Casey, J.M. 2000. Fish community changes in an exploited marine ecosystem: Newfoundland southern Grand Bank and St. Pierre Bank, 1951 – 1995. MSc. Thesis. Memorial University of Newfoundland. St. John’s, Newfoundland.
DFO. 2003. Newfoundland and Labrador Region Groundfish Stock Updates. Can. Sci. Advis. Sec. Stock Status Report. 2003/049.
FRCC. 2001. 2001 Conservation Requirements for Groundfish Stocks in Sub-Areas 0, 2 + 3. Report to the Minister of Fisheries and Oceans. Fisheries Resource Conservation Council. Ottawa, On.

Map of Haddock Landings (2000 – 2003)
Wolffish Landings in the Newfoundland and Labrador Region (2000 – 2003)
In 2001, northern and spotted wolffish were listed as threatened by the Committee on the Status of Endangered Wildlife in Canada (COSEWIC) and the striped wolffish was listed as special concern. According to DFO (2003) there is no directed fishery for these species and special recovery measures were to come into force in June 2004.
Logbook data indicates by-catch of wolffish (species not indicated) occurred primarily in areas corresponding to the yellowtail flounder fishery (Southeast Shoal area), the Greenland halibut fishery (slope just south of the 3K/3L boundary) and the 3Ps Atlantic cod fishery (St. Pierre Bank and Burgeo Bank). Wolffish 2000 - 2003 by-catch averaged approximately 120t per year with a high of 275t in 2002 and a low of 20t in 2003. Particularly high landings were taken from the Southeast Shoal area as well as the slope just south of the 3K/3L boundary.
DFO. 2003. Newfoundland and Labrador Region Groundfish Stock Updates. Can. Sci. Advis. Sec. Stock Status Report. 2003/049.

Map of Wolffish Landings (2000 – 2003)
Roughhead Grenadier Landings in the Newfoundland and Labrador Region (2000 – 2003)
Logbook data indicated greatest by-catch of roughhead grenadier occurred primarily in areas corresponding to the Greenland halibut fishery (slope area north of Grand Bank). Lesser by-catch was recorded along the southwest slope of the Grand Bank and Whale Bank and was most likely associated with Greenland halibut or redfish fisheries in that area. 2000 - 2003 by-catches averaged approximately 80t per year with a high of 96t in 2002 and a low of 70t in 2001.

Map of Roughhead Grenadier Landings (2000 – 2003)
Shellfish Landings in the Newfoundland and Labrador Region (2000 – 2003)
Shellfish landed in the Newfoundland and Labrador Region by Canadian vessels (2000 – 2003) from the study area were associated with directed (quota) fisheries for 3LNOP snow crab, 3L northern shrimp, 3N Stimpsons surf clam, 3Ps Iceland scallop, 3Ps sea scallop and 3Ps whelk. In addition to landings of directed species, propeller clam and quahogs were the main species taken as by-catch in shellfish fisheries.
Based on logbook data, shellfish landings were distributed throughout shelf areas of the study area. Total shellfish landings (directed and by-catch) in each of the four years are as follows:
- 2000 – 33,050t
- 2001 – 36,740t
- 2002 – 39,050t
- 2003 – 48,480t
Of these landings, a total of approximately 6,550t was reported as by-catch.
The majority of logbook entries indicated landings using pots followed by dredge (boat), shrimp trawl and shrimp beam trawl. Approximate annual average landings by gear type from 2000 – 2003 include: pot – 27,650t, dredge (boat) – 5,900t, shrimp trawl – 5,770t and shrimp beam trawl – 2t.

Map of Shellfish Landings (2000 – 2003)
Snow Crab Landings in the Newfoundland and Labrador Region (2000 – 2003)
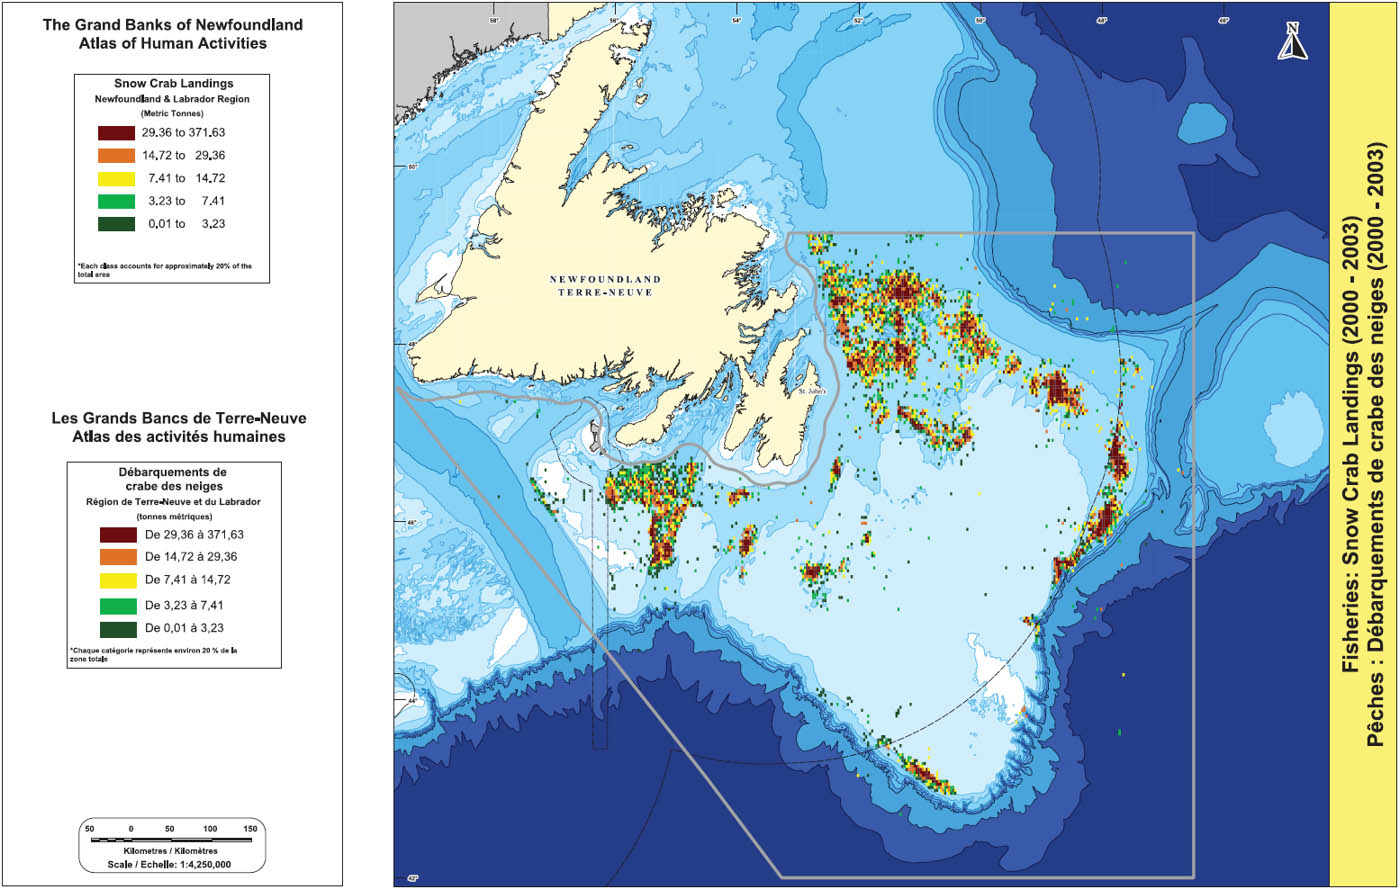
Map of Snow Crab Landings (2000 – 2003)
The Newfoundland and Labrador snow crab fishery began in 1968 and was limited to NAFO divisions 3KL until the mid 1980s, but has since expanded throughout 2J3KLNOP4R (DFO 2003). Since the collapse of the groundfish fishery in the early 1990s, the snow crab fishery has become the most valuable fishery in the province. While the crab fishery was prosecuted by 50 vessels in the early 1980s, today about 3,300 license holders from several fleet sectors participate in the fishery (DFO 2005). The fishery is prosecuted using conical baited pots set in longlines and only males over 95 millimetre carapace width are targeted.
According to logbook data, the majority of 2000 – 2003 Newfoundland and Labrador snow crab landings from the study area were taken from division 3L in depths of 101 - 200 metres on the northern portion of the Grand Bank. Other locations of snow crab landings included the St. Pierre Bank, Halibut Channel, Haddock Channel, the Whale Deep area, the southwest portion of the Grand Bank, the Lilly and Carson Canyon areas and the Nose of the Grand Bank. Logbook data indicated landings from the study area averaged 27,620t per year with a high of 28,450t in 2003 and a low of 26,820t in 2001.
In recent years the Newfoundland and Labrador snow crab resource and fishery has been marked by declines in catch per unit effort (CPUE), exploitable biomass and recruitment (DFO 2005). Indirect effects of fishing, handling mortality of undersized crabs and bitter crab disease have also been identified as important management considerations (DFO 2005).
DFO. 2003. Newfoundland and Labrador Snow Crab. DFO Science Stock Status Report 2003/021. Newfoundland and Labrador Region.
DFO. 2005. Stock Assessment Report on Newfoundland and Labrador Snow Crab. DFO Can. Sci. Advis. Sec. Sci. Advis. Rep. 2005/017.
Northern Shrimp Landings in the Newfoundland and Labrador Region (2000 – 2003)

Map of Northern Shrimp Landings (2000 – 2003)
The northern shrimp fishery in Newfoundland and Labrador waters began in 1977 and was mainly focused in divisions 2GHJ and 3K for many years. The regulated fishery commenced in 3LNO in 2000 with a 6,000t total allowable catch (TAC) restricted to 3L in water depths greater than 200 metres (Bowering and Orr 2004). The 6,000t TAC was enacted from 2000 - 2002 with Canada receiving 5,000t and foreign fleets in the NAFO Regulatory Area (NRA) receiving the remaining 1,000t. Biomass increases led to an increased TAC of 13,000t in 2003. The Canadian northern shrimp fleet consists of approximately 300 small vessels and 12 large vessels (Bowering and Orr 2004) that use shrimp trawl and shrimp beam trawl gear with small mesh (40 millimetres). Sixteen NAFO contracting nations have fished northern shrimp in the NRA since 1999 (Orr et al. 2004).
According to logbook data, the majority of 2000 – 2003 Newfoundland and Labrador northern shrimp landings from the study area were taken from division 3L in depths of 201 - 400 metres north of the Grand Bank. The slope area north of the Grand Bank inside the Canadian 200 nautical mile limit was an area of particularly high landings. Logbook data indicated landings from the study area averaged 5,770t per year with a high of 9,880t in 2003 and a low of 3,890t in 2000. These totals reflect the increased TAC for 2003.
The use of small mesh gear in the northern shrimp fishery and overlap between northern shrimp and juvenile Greenland halibut distribution results in a relatively high risk of by-catch of young fish (Bowering and Orr 2004). In order to address this issue, all vessels in 3L must use sorting grates with a minimum bar spacing of 22 millimetres to reduce by-catches. Despite use of sorting grates, many Greenland halibut are caught in most years with the bulk of catches being comprised of 1 - 3 year old fish (Bowering and Orr 2004). In addition, there is 100 percent mandatory observer coverage of large vessels and less than 10 percent coverage of the small vessels (Orr et al. 2004).
Orr et al. (2004) indicated that the shrimp resource in division 3LNO is currently healthy with high abundances of males and females.
Bowering, W.R. and D.C. Orr. 2004. By-catch of Greenland Halibut (Reinhardtius hippoglossoides, Walbum) in the Canadian Fishery for Northern Shrimp (Pandalus boralis, Koyer) in NAFO Subarea 2 and Divisions 3KL. NAFO SACR Doc. 04/67. Serial No. N5028.
Orr, D.C., P.J. Veitch and D.J. Sullivan. 2004. An Update of Information Pertaining to Northern Shrimp (Pandalus borealis, Kroyer) and Groundfish in NAFO Divisions 3LNO. NAFO SCR Doc. 04/86. Ser No. N5056.
Stimpsons Surf Clam Landings in the Newfoundland and Labrador Region (2000 – 2003)
Stimpsons surf clam fisheries have been prosecuted on the Grand Bank since 1989 and have involved a limited number (three) of licence holders (DFO 1998). It is a valuable fishery as indicated by a landed value of $1.2 million (for 1,500t) in 1999. The fishery is prosecuted using hydraulic dredges.
According to logbook data, the majority of 2000 – 2003 Newfoundland and Labrador Stimpsons surf clam landings from the study area were taken from division 3N in depths of 51 - 100 metres on the eastern portion of the Grand Bank. Particularly high landings were taken from an area to the northwest of Carson Canyon. Logbook data indicated landings from the study area averaged 3,800t per year with a high of approximately 5,960t in 2003 and a low of 860t in 2000. Landings have been well below the total allowable catch levels (TAC) set for the fishery.
By-catch of propeller clams and quahogs are associated with the Stimpsons surf clam fishery and a total by-catch of almost 6,000t of these species was reported in logbooks for the 2000 - 2003 period.
DFO. 1998. Offshore Surf Clam Integrated Management Plan. Maritimes and Newfoundland Regions 1998-2002. Communications Directorate. Fisheries and Oceans Canada. Ottawa, On.
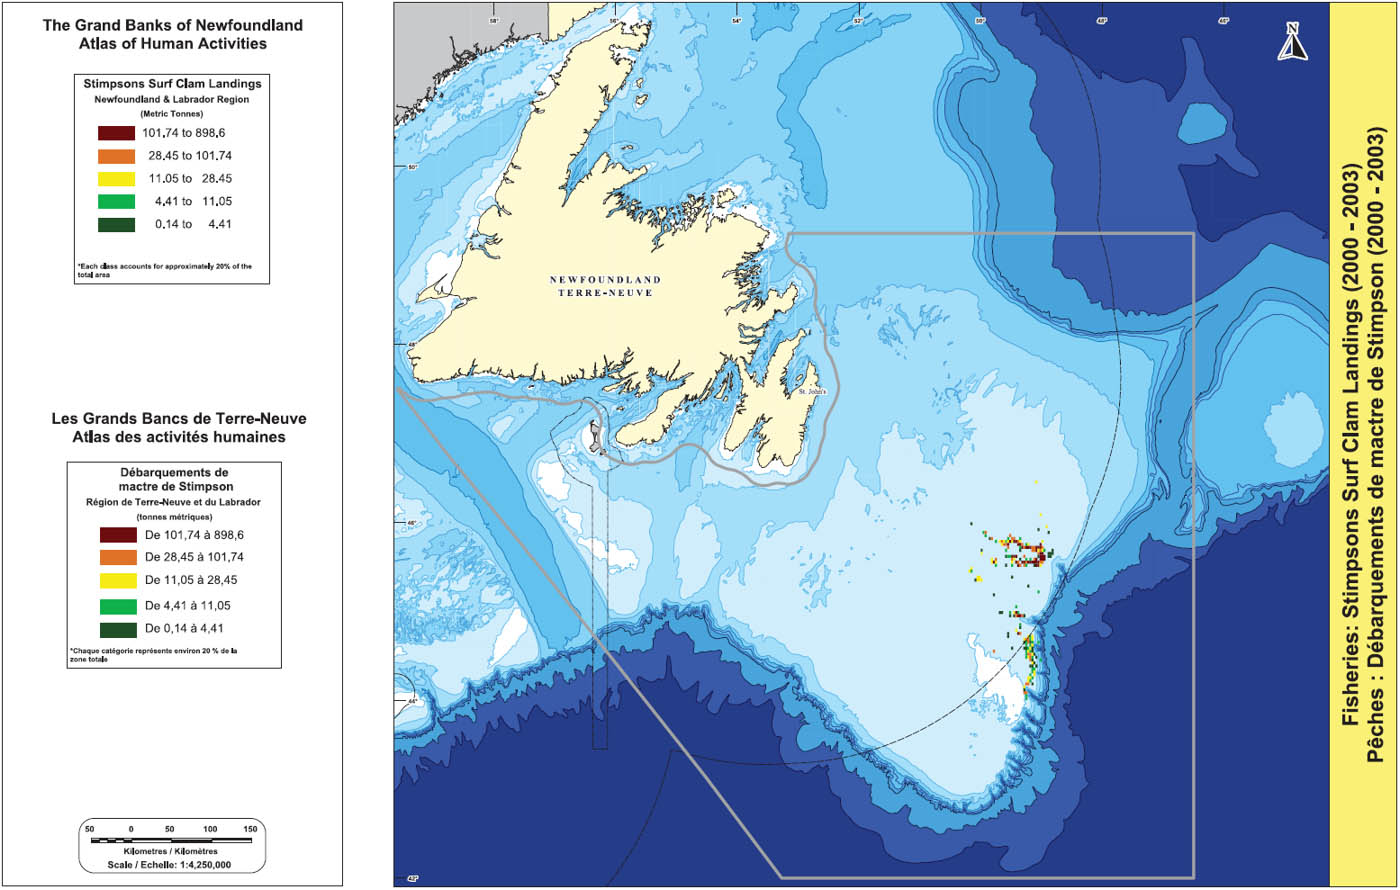
Map of Stimpsons Surf Clam Landings (2000 – 2003)
Iceland Scallop Landings in the Newfoundland and Labrador Region (2000 – 2003)

Map of Iceland Scallop Landings (2000 – 2003)
The Iceland scallop fishery has been prosecuted since 1992 in Divisions 3LNO and since 1989 in subdivision 3Ps (Richards 2004). Fisheries in Divisions 3LNO began on the eastern Grand Bank in 3L and the fishery subsequently focused in the Lilly and Carson Canyon area (3N). Stocks in that area were rapidly fished down and landings have since declined due to declining availability of scallops and due to diversion of effort towards shrimp and crab. Total 2000 nominal catch of Iceland scallop in Newfoundland and Labrador was one quarter of levels in 1996 (Naidu et al. 2001). There was no directed fishery in the Lilly and Carson Canyon areas in 2002 and 2003 and there has been no commercial activity throughout the rest of 3LN since 2000 (Richards 2004).
The 3Ps fishery originally focused on the trans-boundary stock along the northern edge of the St. Pierre Bank and the quota was split between France (70 percent) and Canada (30 percent). Effort has moved to other areas on the bank since 1998 (Richards 2004) and the trans-boundary area is now plagued by predatory starfish (Naidu et al. 2001).
The Iceland scallop fishery is prosecuted using hydraulic dredge and the number of active Iceland scallop licences in 3LNOPs ranged from 40 in 2000 to 2 in 2003 (pers. comm. Frank Cahill, DFO Science).
According to logbook data, the majority of 2000 – 2003 Newfoundland and Labrador Iceland scallop landings from the study area were taken from subdivision 3Ps in depths from less than 50 – 100 metres on the St. Pierre Bank. Lesser landings were taken from the Lilly Canyon area. According to logbook data, landings from the study area averaged 450t per year with a high of approximately 810t in 2000 and a low of 70t in 2003. These landing levels are reflective of fishing effort in those years. Sea scallop and Iceland scallop distributions overlap on the St. Pierre Bank and Newfoundland vessels targeting Iceland scallop sometimes catch and retain sea scallop (Naidu et al. 2001). In such cases, up to 10 percent of total catch may be comprised of sea scallop.
Naidu et al. (1998) described the 3LNO Iceland scallop fishery as being “under siege” due to high exploitation rates and low annual production.
Naidu, K.S. F.M. Cahill and E.M. Seward. 1998. The Iceland scallop: A fishery under siege in Newfoundland. Canadian Stock Assessment Secretariat Research Doc. 98/149.
Naidu, K.S. F.M. Cahill and E.M. Seward. 2001. The scallop fishery in Newfoundland and Labrador becomes beleaguered. Canadian Science Advisory Secretariat Research Doc. 2001/64.
Richards, D. 2004. Canadian Research Report for 2003. NAFO SCS Doc. 04/8. Serial No. N4960. Northwest Atlantic Fisheries Organization.
Cahill, Frank. Senior Research Technician. DFO Science Branch (Shellfish). NL Region.
Sea Scallop Landings In The Newfoundland And Labrador Region (2000 – 2003)
The sea scallop fishery is prosecuted using hydraulic dredge. According to logbook data, 2000 - 2003 Newfoundland and Labrador sea scallop landings from the study area were taken from subdivision 3Ps in depths of less than 50 metres on the St. Pierre Bank. According to logbook data, landings from the study area averaged 190t per year with a high of approximately 590t in 2003 and no recorded landings in 2000 and 2002. Sea scallop and Iceland scallop distributions overlap on the St. Pierre Bank and Newfoundland vessels targeting Iceland scallop sometimes catch and retain sea scallop (Naidu et al. 2001). In such cases, up to 10 percent of total catch may be comprised of sea scallop.
Naidu, K.S. F.M. Cahill and E.M. Seward. 2001. The scallop fishery in Newfoundland and Labrador becomes beleaguered. Canadian Science Advisory Secretariat Research Doc. 2001/64.

Map of Sea Scallop Landings (2000 – 2003)
Whelk Landings in the Newfoundland and Labrador Region (2000 – 2003)
After an initial unsuccessful attempt to initiate a whelk fishery in 1987, pilot projects regarding whelk fisheries began in 1996 following the collapse of traditionally fished groundfish stocks and improved international markets (DFA 2003). At that time it was discovered that commercially viable whelk fisheries could be prosecuted in near shore areas of Bonavista Bay and on St. Pierre Bank. However, attempts to establish a whelk fishery have generally been challenged by fisher preference to engage in more traditional and lucrative fisheries, resulting in impediments to processing development and fluctuating prices (DFA 2003). Despite these challenges a small-scale unregulated fishery is prosecuted using pots or modified buckets.
According to logbook data, the majority of 2000 – 2003 Newfoundland and Labrador whelk landings from the study area were taken from subdivision 3Ps in depths from less than 50 - 100 metres on the St. Pierre Bank. According to logbook data, landings from the study area averaged 37t per year with a high of approximately 117t in 2002 and no recorded landings in 2000 and 2001.
DFA. 2003. Whelk (Buccinum undatum). Emerging Species Profile. Department of Fisheries and Aquaculture. St. John’s, NL

Map of Whelk Landings (2000 – 2003)
Large Pelagic Landings in the Newfoundland and Labrador Region (2000 – 2003)
Large pelagics landed in Newfoundland and Labrador by Canadian vessels (2000 – 2003) from the study area were associated with directed fisheries for bluefin tuna, bigeye tuna and swordfish. In addition to landings of directed species, sharks and albacore tuna were the main species reported as by-catch.
Based on logbook data, pelagic landings were primarily taken from the following areas: the shelf-break on the southern and southwest area of the Grand Bank and off shelf and deep water locations to the southeast of the Grand Bank. Other pelagic landings were taken from the Virgin Rocks area, St. Pierre Bank, Burgeo Bank, Hermitage Channel and the southern portions of Halibut and Haddock Channels. Total pelagic landings (directed and by-catch) in each of the four years are as follows:
- 2000 – 200t
- 2001 – 250t
- 2002 – 105t
- 2003 – 45t
Of these landings a total of approximately 60t was reported as by-catch.
Approximate annual average landings by gear type from 2000 – 2003 include: longline – 95t and tended line – 54t.
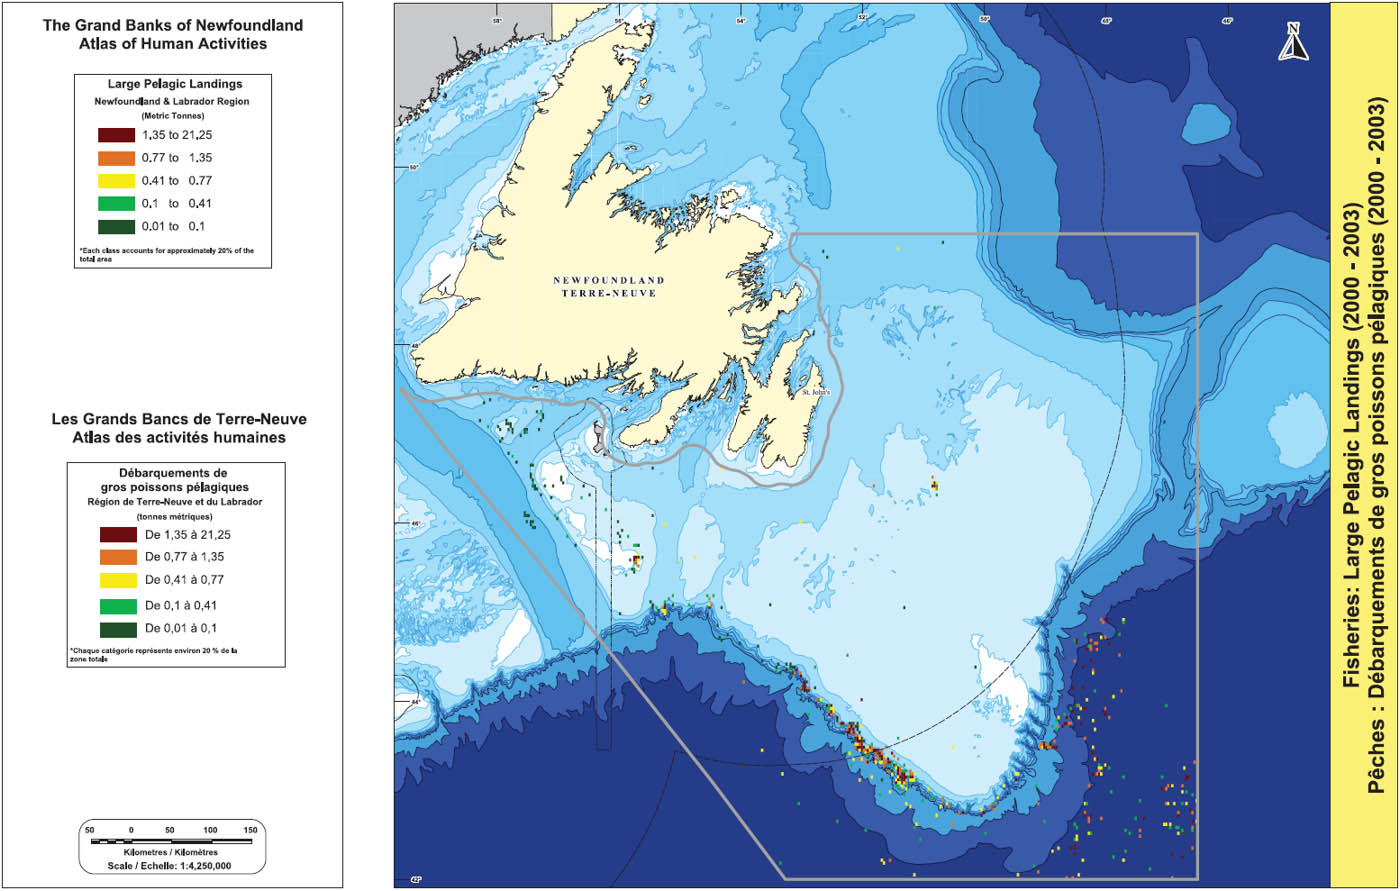
Map of Large Pelagic Landings (2000 – 2003)
Bluefin Tuna Landings In The Newfoundland And Labrador Region (2000 – 2003)
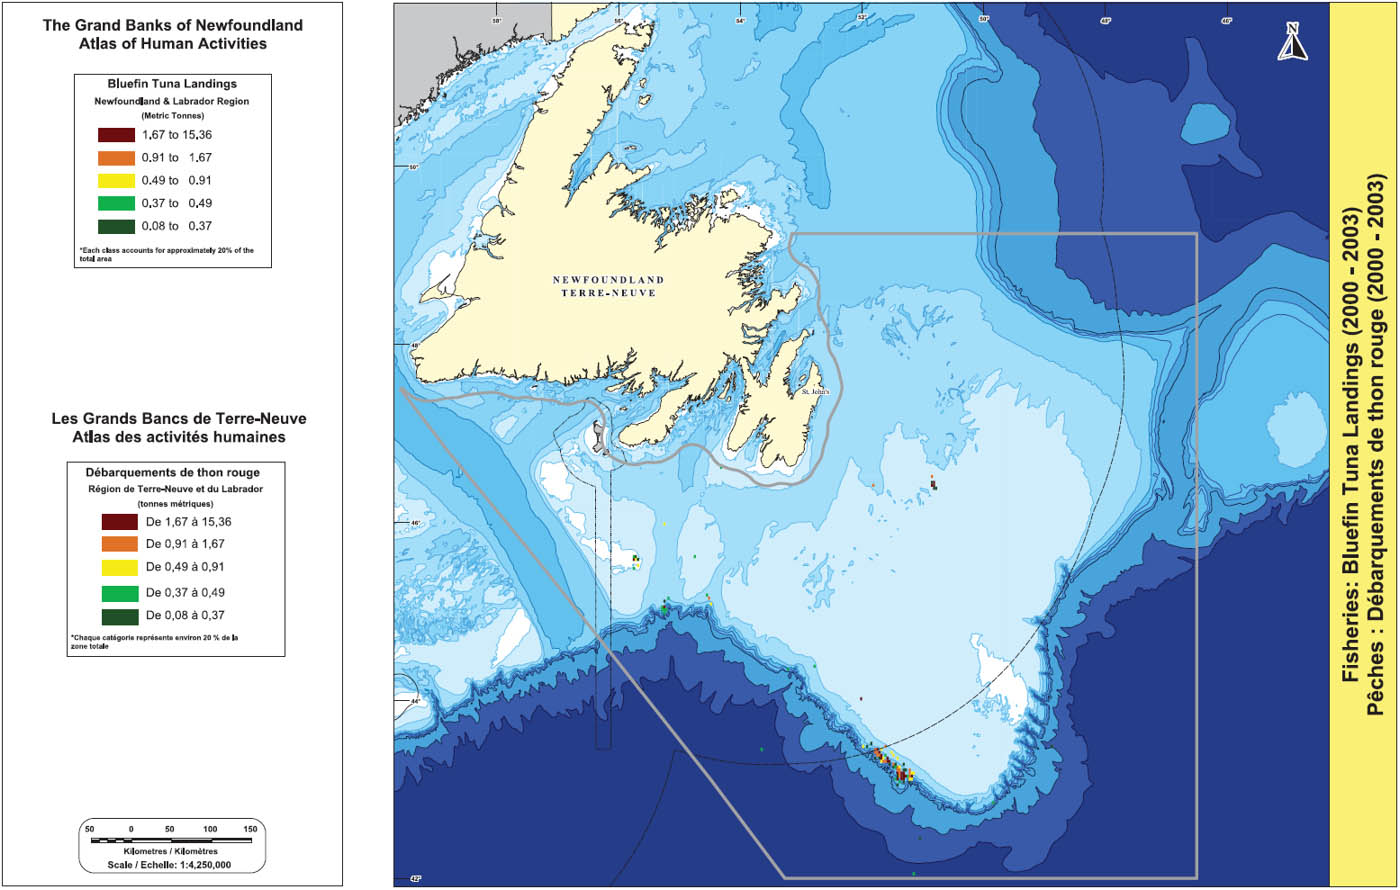
Map of Bluefin Tuna Landings (2000 – 2003)
The International Commission for the Conservation of Atlantic Tunas (ICCAT) establishes allocations and oversees management of tuna stocks due to their migratory nature. DFO management efforts are intended to ensure Canadian fisheries comply with ICCAT stipulations. The Newfoundland and Labrador bluefin tuna fishery began in 1957 in Conception Bay. Currently there are 55 bluefin tuna licences held by Newfoundland and Labrador fishers. Some of these licences are “Atlantic wide” while others are restricted to Divisions 3LNO. In Newfoundland, fishers are eligible to prosecute the fishery using tended lines (one hook per line), rod and reel and electric harpoon (DFO 2002).
According to logbook data, the majority of 2000 – 2003 Newfoundland and Labrador bluefin tuna landings from the study area were taken from the shelf break on the southwest Grand Bank outside the Canadian 200 nautical mile limit. Landings were also taken from the Virgin Rocks area, St. Pierre Bank and the southern portions of Halibut and Haddock Channels. The shelf break on the southwest Grand Bank was an area of particularly high landings. Logbook data indicated landings from the study area averaged 53t per year with a high of 67t in 2000 and a low of 29t in 2003.
Usually the bluefin tuna fishery begins in late July and can run through to late November if quota is available.
There has been a large reduction in spawning stock abundance since the mid-1970s and the current estimate of fishing mortality is higher than target levels (DFO 1999).
DFO. 1999. 1999 – 2000 Integrated Fisheries Management Plan: Atlantic Bluefin Tuna. Communications Directorate Fisheries and Oceans Canada. Ottawa, ON.
DFO. 2002. Integrated Fisheries Management Plan Atlantic Bluefin Tuna (Effective 2002). Fisheries and Oceans Canada.
Swordfish Landings in the Newfoundland and Labrador Region (2000 – 2003)

Map of Swordfish Landings (2000 – 2003)
The Atlantic swordfish fishery began in the late 1880s as a harpoon fishery while the current longline fishery commenced in the 1960s. Out of a total of 77 Canadian swordfish longline licences, only eight are held in Newfoundland (DFO 2002). However, few Newfoundland licenced vessels have been active in recent years due to directing for other species. Only 140 of 1,428 Atlantic-wide harpoon licences were active in 1999. All but eight of the vessels conducting longline fisheries are less than 65 feet in length with the remainder between 65 feet and 100 feet. The International Commission for the Conservation of Atlantic Tunas (ICCAT) also recommends quotas for swordfish and DFO manages the quota to ensure landings are kept within quota limits.
According to logbook data, the majority of 2000 – 2003 Newfoundland and Labrador swordfish landings from the study area were taken from the shelf break on the southern and southwest area of the Grand Bank and off shelf and deep water locations to the southeast of the Grand Bank. Logbook data indicated landings from the study area averaged 77t per year with a high of 159t in 2001 and a low of 5t in 2003.
The Atlantic swordfish longline season operates from May to November and the harpoon season runs from June to late August.
Swordfish are taken as by-catch in tuna and shark fisheries and tunas and shark are taken as by-catch in the swordfish fishery. A twenty-year decline in the north Atlantic swordfish stock was apparent between the late 1970s and the late 1990s. Population biomass is still considered to be overfished (DFO 2002).
DFO. 2002. The Canadian Atlantic Swordfish (Xiphias gladius) Fishery. 2000-2002 Integrated Management Plan. Fisheries and Oceans Canada.
Bigeye and Albacore Tuna Landings in the Newfoundland and Labrador Region (2000 – 2003)

Map of Bigeye and Albacore Tuna Landings (2000 – 2003)
Fisheries for “other (than bluefin) tunas” have occurred along the east coast of Canada since the 1860s (DFO 1998). The International Commission for the Conservation of Atlantic Tunas (ICCAT) oversees management of these tuna stocks. “Other tunas” include bigeye, albacore and yellowfin tunas. In recent years the fishery has been prosecuted by one permanent licence holder for “other tunas” as well as those holding swordfish longline licences (77). Holders of bluefin tuna licences in Atlantic Canada are not authorized to use long line gear and are not authorized to direct for “other tuna” species. However, they are allowed to retain an incidental by-catch of “other tuna” (pers. comm. Len Knight, Fisheries and Oceans Canada).
According to logbook data, the majority of 2000 – 2003 Newfoundland and Labrador “other tuna” landings from the study area were taken in deep water areas off the southwest and southeast Grand Bank. Landings were comprised primarily of bigeye tuna with lesser amounts of albacore. Highest landings were taken from deep water locations off the southeast Grand Bank. Logbook data indicated “other tuna” landings from the study area averaged 14t per year with a high of approximately 31t in 2001 and a low of 7t in 2000 and 2002.
DFO (1998) indicated that although landings of “other tunas” tend to be relatively low these stocks should not be considered underutilized. In fact, all three species are being fished at or beyond maximum sustainable yield estimates.
DFO. 1998. Canadian Atlantic Integrated Fishery Management Plan Bigeye (Thunnus obesus) Yellowfin (Thunnus albacares) Albacore (Thunnus alalunga) Tunas 1998-1999. Fisheries and Oceans Canada.
Knight, Len. Area Chief Resource Management. Fisheries and Oceans Canada. Mount Pearl, Newfoundland and Labrador.
Groundfish Landings in the Scotia-Fundy Region (2000 – 2003)
Groundfish landed in the Scotia-Fundy Region by Canadian vessels (2000 – 2003) from the study area were mainly associated with directed (quota) fisheries for NAFO Division 3KLMN Greenland halibut, 3O and 3Ps redfish, 3Ps Atlantic cod, 3LNO skate and 4VWX3NOPs Atlantic halibut. In addition to landings of species under quota, the following were either taken as by-catch or as part of non-quota fisheries: American plaice, wolffish (unspecified), cusk, witch flounder, haddock, roundnose grenadier, and yellowtail flounder.
Based on logbook data, groundfish landings were primarily taken from the following areas: the Laurentian Channel, the St. Pierre Bank, south of St. Pierre Bank, Halibut Channel, Haddock Channel and Hermitage Channel, the southwest slope of the Grand Bank and Whale Bank, Burgeo Bank, northwest of the Southeast Shoal and the slope area to the north of the Grand Bank. Total groundfish landings (directed and by-catch) in each of the four years are as follows:
- 2000 – 7,270t
- 2001 – 3,970t
- 2002 – 2,630t
- 2003 – 3,220t

Map of Groundfish Landings (2000 – 2003)
Redfish Landings in the Scotia-Fundy Region (2000 – 2003)
Logbook data indicates 2000 – 2003 Scotia-Fundy redfish landings from the study area came from 3O and 3Ps. Landings were taken primarily from the Laurentian Channel, the Hermitage Channel, the southern slope and shelf areas of Burgeo and St. Pierre Banks, the southern portion of Halibut and Haddock Channels, and the southwest slope of the Grand Bank and Whale Bank. Total landings were approximately 9,620t. Landings averaged approximately 2,400t per year with a high of 5,600t in 2000 and a low of 825t in 2002. By-catch of cod has been noted in the 3Ps redfish fishery with the highest by-catch rates in the winter and the lowest in summer (Chen 2004).
Chen, N.Y.. 2004. Estimates of 3Ps by-catch of cod in otter trawl fishery. Can. Sci. Advis. Sec. Research Doc. 2004/035.

Map of Redfish Landings (2000 – 2003)
Atlantic Cod Landings in the Scotia-Fundy Region (2000 – 2003)
Logbook data indicates 2000 – 2003 Scotia-Fundy Atlantic cod landings from the study area came from 3NO and 3Ps. Landings from 3NO were taken as by-catch and corresponded to locations of directed fisheries for Atlantic halibut, monkfish, skate and white hake (Southeast Shoal area and southwest slope of the Grand Bank and Whale Bank). Directed fisheries were prosecuted in 3Ps and landings were derived from the slope area south of Halibut and Haddock Channels, Green Bank and St. Pierre Bank as well as on the St. Pierre Bank, Hermitage Channel and the Laurentian Channel.
Total Atlantic cod landings were approximately 3,040t. Landings averaged approximately 760t per year with a high of 910t in 2001 and a low of 520t in 2002.

Map of Atlantic Cod Landings (2000 – 2003)
White Hake Landings in the Scotia-Fundy Region (2000 – 2003)
The white hake fishery is generally a mixed fishery with hake being taken in conjunction with cod, monkfish and skate. There is no quota established for the hake fishery and effort is only regulated by closures due to excessive by-catch of other species (Kulka et al. 2004).
Landings from 2000 – 2003 were mainly taken from the southern slope of the Grand Banks corresponding to the warm water-influenced hake distribution in that area. Landings came from west of the Southeast Shoal, the St. Pierre Bank, the Laurentian Channel and Hermitage Channel. Logbook data indicates highest landings from just inside the Canadian 200 nautical mile limit as well as the southern portions of Halibut and Haddock Channels.
Total white hake landings from 2000 – 2003 were approximately 1,650t. Landings averaged approximately 415t per year with a high of 730t in 2002 and a low of 270t in 2001.
Kulka, D.W., K. Sosobee, C.M. Miri and M. Simpson. 2004. The Status of White Hake (Urophycis tenuis), in NAFO Divisions 3L, 3N, 3O, and Subdivision 3Ps. NAFO SCR Doc. 04/57. Northwest Atlantic Fisheries Organization.

Map of White Hake Landings (2000 – 2003)
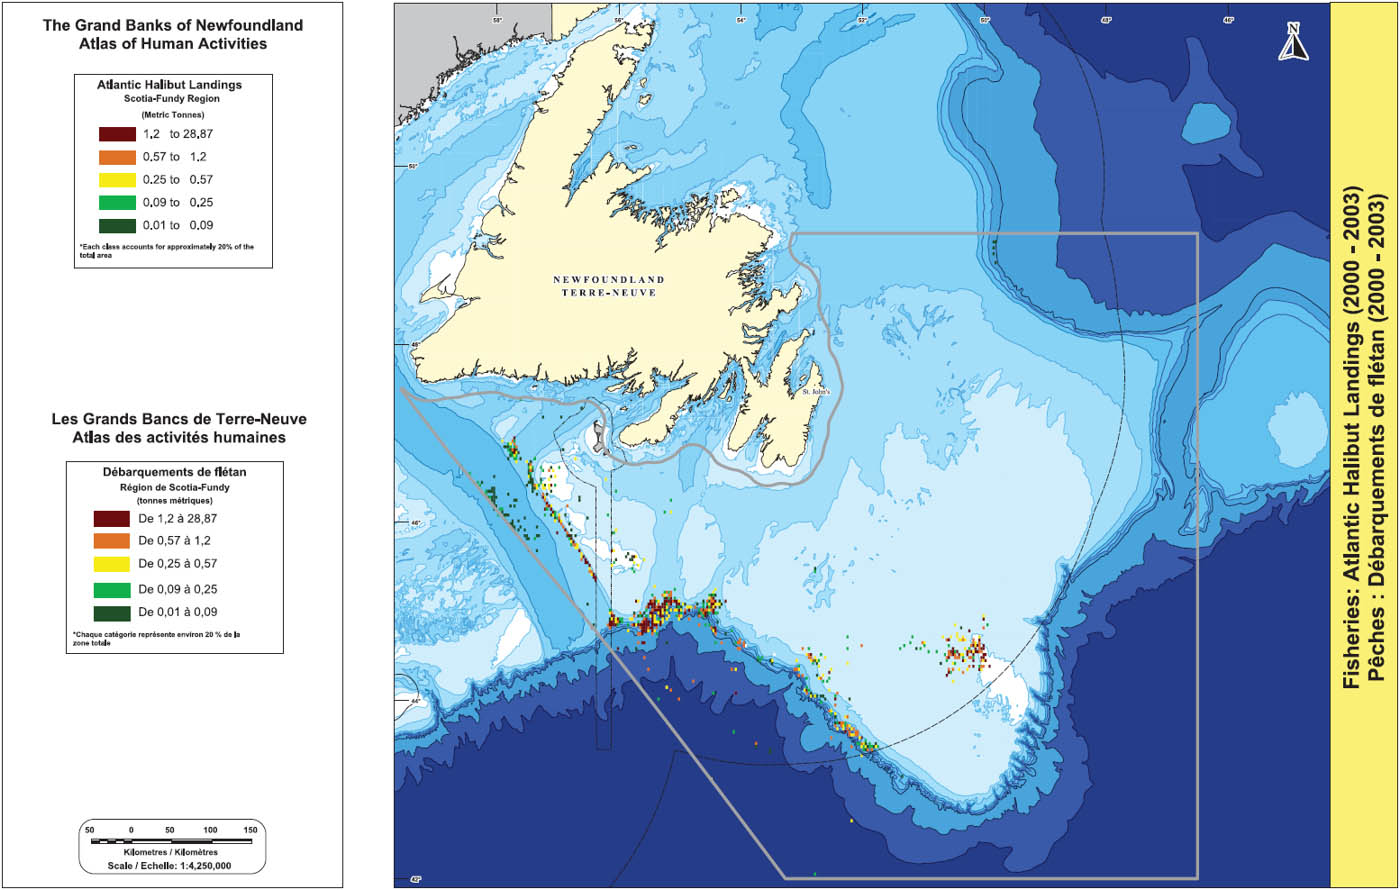
Atlantic Halibut Landings in the Scotia-Fundy Region (2000 – 2003)
Total Canadian Atlantic halibut catch from Divisions 3NOP averaged 442t from 2000 – 2002 with a high of 518t in 2001 and a low of 356t in 2000 (Zwanenburg et al. 2003).
Logbook data indicates 2000 – 2003 Scotia-Fundy halibut landings from the study area came from the southern shelf break areas of the Grand Banks, the Southeast Shoal area, St. Pierre Bank, the western slope of St. Pierre Bank, the Laurentian Channel and the Hermitage Channel. The slope area south of Halibut Channel was an area of particularly high landings.
Total Atlantic halibut landings were approximately 850t. Landings averaged approximately 210t per year with a high of 265t in 2003 and a low of 165t in 2000.
Zwanenburg, K., S. Wilson, R. Branton and P. Brien. 2003. Halibut on the Scotian Shelf and Southern Grand Banks – Current Estimates of Population Status. CSAS Res Doc. 2003/046. Canadian Science Advisory Secretariat.
Map of Atlantic Halibut Landings (2000 – 2003)
Skate Landings in the Scotia-Fundy Region (2000 – 2003)
Logbook data indicates 2000 - 2003 Scotia-Fundy skate landings from the study area came from the southwest shelf area of the Grand Bank, southern portions of Halibut and Haddock Channels and the shelf and slope area of St. Pierre Bank.
Landings averaged approximately 165t per year with a high of 285t in 2003 and a low of 80t in 2000. Low value and limited markets resulted in the total allowable catch (TAC) not being completely taken. The fishery is prosecuted with longline, gillnet and otter trawl.

Map of Skate Landings (2000 – 2003)
Monkfish Landings in the Scotia-Fundy Region (2000 – 2003)
Logbook data indicates 2000 – 2003 Scotia-Fundy monkfish landings from the study area primarily came from the shelf and slope area of St. Pierre Bank, Halibut Channel the southwest slope of the Grand Bank and Whale Bank, and the Laurentian and Hermitage Channels.
Landings averaged approximately 90t per year with a high of 215t in 2003 and a low of 3t in 2000.

Map of Monkfish Landings (2000 – 2003)
Pollock Landings in the Scotia-Fundy Region (2000 – 2003)
Pollock in southern Newfoundland waters are at the northern extent of their range and have not been a significant target for commercial fisheries (DFO 2003). The species has been regulated as by-catch only since 1993 and catches are mainly taken from 3Ps. Most pollock landings occur as by-catch by Canadian and French (St. Pierre and Miquelon) vessels targeting cod with otter trawl and gillnets.
Logbook data indicates 2000 – 2003 Scotia-Fundy Pollock landings from the study area averaged approximately 60t per year with a high of 115t in 2000 and a low of 15t in 2001.
DFO. 2003. Newfoundland and Labrador Region Groundfish Stock Updates. Can. Sci. Advis. Sec. Stock Status Report. 2003/049.

Map of Pollock Landings (2000 – 2003)
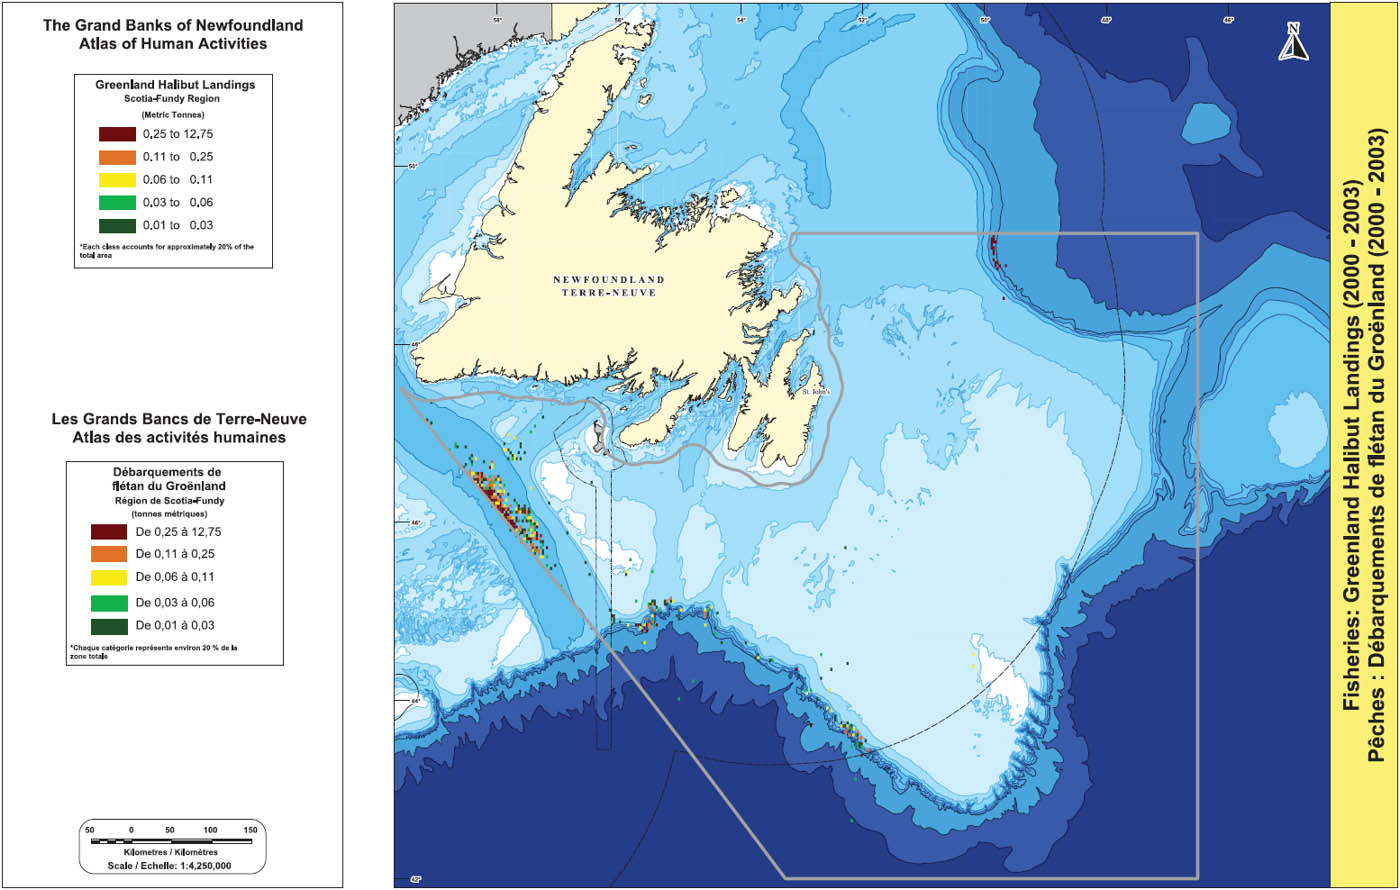
Greenland Halibut Landings in the Scotia-Fundy Region (2000 – 2003)
Scotia-Fundy Greenland halibut landings in 2000 – 2003 from the study area primarily came from the slope area to the north of the Grand Bank, the Laurentian Channel, Hermitage Channel, and the shelf break areas on the southern portion of the Grand Banks.
Total Scotia-Fundy landings from the study area averaged 45t per year with a high of 115t in 2001 and a low of 5t in 2002.
Map of Greenland Halibut Landings (2000 – 2003)
Shellfish Landings in the Scotia-Fundy Region (2000 – 2003)
Shellfish landed in the Scotia-Fundy Region by Canadian vessels (2000 – 2003) from the study area were associated with directed (quota) fisheries for 3LN Stimpsons surf clam, 3L northern shrimp, 3LNOPs snow crab, and 3Ps sea scallop. In addition to landings of directed species, unspecified mollusks, propeller clam and quahogs were the main species taken as by-catch in shellfish fisheries.
Based on logbook data, 2000 - 2003 shellfish landings were primarily taken from the southeast Grand Bank, the slope north of the Grand Bank and shelf and slope areas of St. Pierre Bank. The area east of the Southeast Shoal was noteworthy as an area of particularly high landings due to high catch levels of Stimpsons surf clam. Total shellfish landings (directed and by-catch) in each of the four years are as follows:
- 2000 – 3,175t
- 2001 – 5,170t
- 2002 – 5,960t
- 2003 – 6,600t

Map of Shellfish Landings (2000 – 2003)
Stimpsons Surf Clam Landings in the Scotia-Fundy Region (2000 – 2003)
According to logbook data, the majority of 2000 – 2003 Stimpsons surf clam landings from the study area were taken from division 3N in depths of 51 – 100 metres on the eastern portion of the Grand Bank. Particularly high landings were taken from areas to the northwest of Carson Canyon and near Lilly Canyon. Logbook data indicated landings from the study area averaged approximately 3,440t per year with a high of approximately 4,300t in 2003 and a low of approximately 2,380t in 2000.
By-catch of “unspecified mollusks”, propeller clams and quahogs are associated with the Stimpsons surf clam fishery and a total by-catch of almost 5,500t of these species was reported in logbooks for the 2000 – 2003 period.

Map of Stimpsons Surf Clam Landings (2000 – 2003)
Northern Shrimp Landings in the Scotia-Fundy Region (2000 – 2003)
According to logbook data, the majority of 2000 – 2003 Scotia-Fundy northern shrimp landings from the study area were taken from division 3L in depths of 201 - 400 metres to the north of the Grand Bank. Logbook data indicated landings from the study area averaged approximately 360t per year with a high of 570t in 2002 and a low of 0t in 2003.
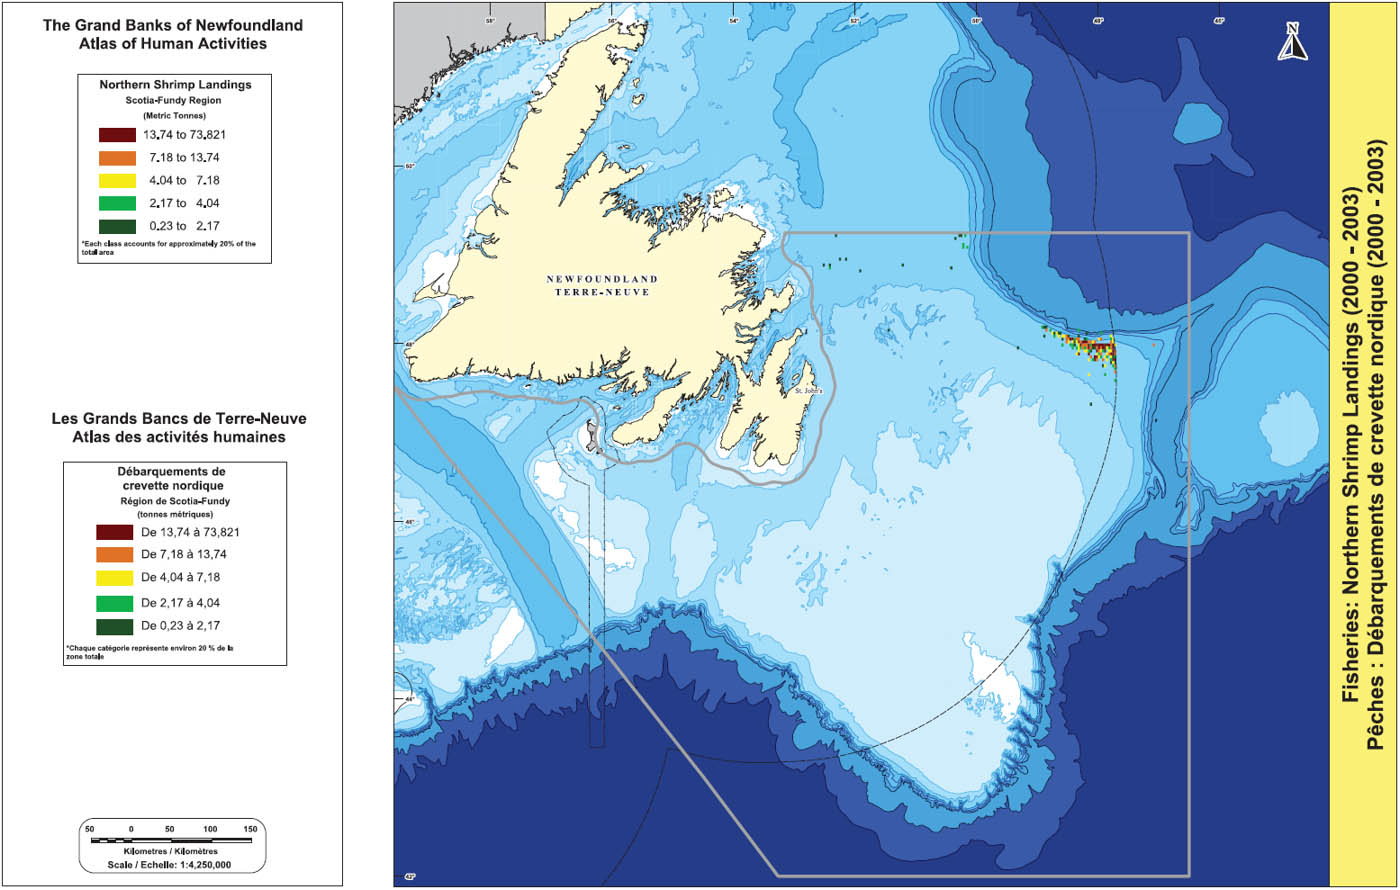
Map of Northern Shrimp Landings (2000 – 2003)
Snow Crab Landings in the Scotia-Fundy Region (2000 – 2003)
According to logbook data from Scotia-Fundy region, the majority of 2000 – 2003 snow crab landings from the study area were taken from the eastern slope of St. Pierre Bank and the Halibut Channel, as well as an area to the north of St. Pierre Bank. Logbook data indicated landings from the study area averaged approximately 40t per year with a high of 80t in 2003 and a low of 0t in 2000.

Map of Snow Crab Landings (2000 – 2003)
Sea Scallop Landings in the Scotia-Fundy Region (2000 – 2003)
From 2000 – 2003 a very limited sea scallop fishery was conducted in the study area by Canadian vessels landing in the Scotia-Fundy Region. According to logbook data, a fishery was only conducted in 2000 when a total of 34t was landed from shallow areas (less than 50 metres) of the northwest St. Pierre Bank.

Map of Sea Scallop Landings (2000 – 2003)
Large Pelagic Landings in the Scotia-Fundy Region (2000 – 2003)
Large pelagics landed in the Scotia-Fundy Region by Canadian vessels (2000 – 2003) from the study area were associated with directed fisheries for swordfish, bigeye tuna, albacore tuna and porbeagle/mako shark. In addition to landings of directed species, blue sharks, mahi mahi (dolphin fish) and bluefin tuna were the main species reported as by-catch.
Based on logbook data, large pelagic landings were primarily taken from the following areas: the shelf break of the southwest Grand Bank, deep water locations to the southeast and southwest of the Grand Bank, south of St. Pierre Bank and on the St. Pierre, Green, Whale and Grand Banks. Total pelagic landings (directed and by-catch) in each of the four years are as follows:
- 2000 – 350t
- 2001 – 100t
- 2002 – 160t
- 2003 – 0t
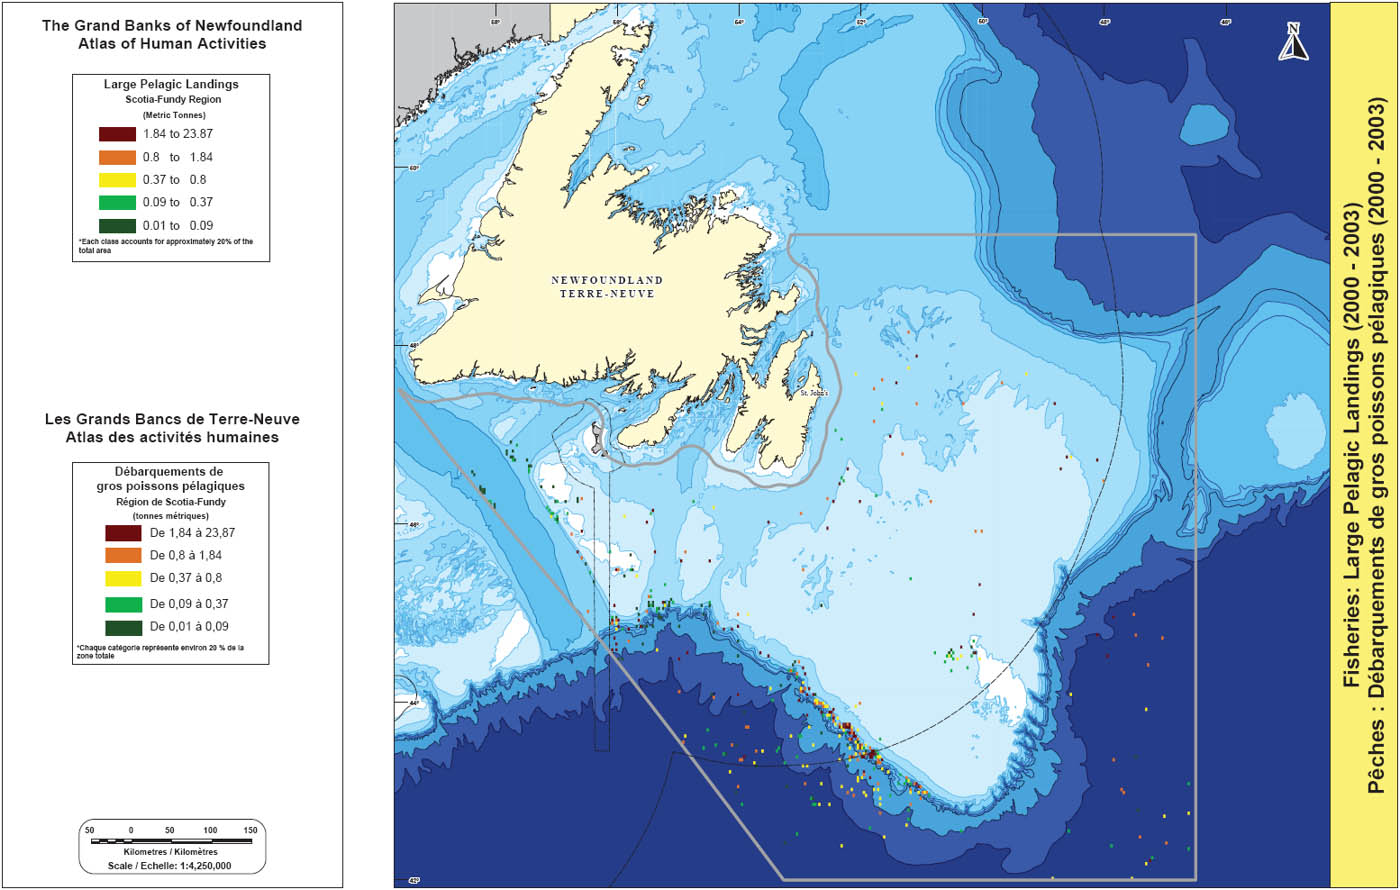
Map of Large Pelagic Landings (2000 – 2003)
Swordfish Landings in the Scotia-Fundy Region (2000 – 2003)

Map of Swordfish Landings (2000 – 2003)
The Atlantic swordfish fishery began in the late 1880s as a harpoon fishery while the current longline fishery commenced in the 1960s. Out of a total of 77 Canadian swordfish longline licences, 69 are held in the Scotia-Fundy sector of the Maritimes Region (DFO 2002). Only 140 of 1,428 Atlantic-wide harpoon licences were active in 1999. All but eight of the vessels conducting longline fisheries are less than 65 feet in length with the remainder between 65 feet and 100 feet. The International Commission for the Conservation of Atlantic Tunas (ICCAT) also recommends quotas for swordfish and DFO manages quotas to ensure landings are kept within quota limits.
According to logbook data, the majority of 2000 – 2003 swordfish landings from the study area were taken from the shelf break on the southwest area of the Grand Bank and off shelf and deep water locations to the southeast and southwest of the Grand Bank. The shelf break area of the southwest Grand Bank (both outside and inside the Canadian 200 nautical mile limit) was an area of particularly high landings. Logbook data indicated landings from the study area averaged 46t per year with a high of 90t in 2002 and a low of 0t in 2003.
The Atlantic swordfish longline season operates from May to November and the harpoon season runs from June to late August.
Swordfish are taken as by-catch in tuna and shark fisheries and tunas and shark are taken as by-catch in the swordfish fishery. A twenty-year decline in the north Atlantic swordfish stock was apparent between the late 1970s and the late 1990s. Population biomass is still considered to be overfished (DFO 2002).
DFO. 2002. The Canadian Atlantic Swordfish (Xiphias gladius) Fishery. 2000-2002 Integrated Management Plan. Fisheries and Oceans Canada.
Porbeagle Shark Landings in the Scotia-Fundy Region (2000 – 2003)
Atlantic shark fisheries were initiated in 1961 by Norway, and Canadian participation began in 1991 (DFO 2002). The fishery primarily targets porbeagle sharks with mako and blue sharks commonly taken as by-catch. Sharks also appear as by-catch in pelagic longline fisheries for swordfish and tunas. Currently there are 25 Atlantic-wide porbeagle/blue shark licences down from 58 initial licences in 1995 (DFO 2002). The fishery is prosecuted by longline, hand line and rod and reel.
According to logbook data, 2000 – 2003 Scotia-Fundy porbeagle shark landings from the study area were distributed across the Grand Bank, Whale Bank, Green Bank and St. Pierre Bank. Landings were also taken from off-shelf areas to the southwest of the Grand Bank and south of St. Pierre Bank. Logbook data indicated landings from the study area averaged almost 80t per year with a high of 254t in 2000 and a low of 0t in 2003. Mako shark landings totalled 20t and blue shark landings totalled 8t from 2000 - 2003.
The porbeagle shark fishery is prosecuted during the fall on the Grand Banks.
DFO (2002) indicated the current porbeagle shark population is seriously depleted and greatly reduced fishing mortality is required if the population is to recover. As a result, there has been no directed fishing for this species since 2002.
DFO. 2002. Canadian Atlantic Pelagic Shark Integrated Fisheries Management Plan (2002-2007). Fisheries and Oceans Canada.

Map of Porbeagle Shark Landings (2000 – 2003)
Bigeye and Albacore Tuna Landings in the Scotia-Fundy Region (2000 – 2003)
Fisheries for “other (than bluefin) tunas” have occurred along the east coast of Canada since the 1860s (DFO 1998). The International Commission for the Conservation of Atlantic Tunas (ICCAT) oversees management of these tuna stocks. “Other tunas” include bigeye, albacore and yellowfin tunas. In recent years, the fishery has been prosecuted by one permanent licence holder for “other tunas” as well as those holding swordfish longline licences (77) and bluefin tuna licences. Only bluefin tuna fishers operating on the Scotia Shelf or Grand Banks using tended line or rod and reel may retain “other tunas”.
According to logbook data, the majority of 2000 – 2003 Scotia-Fundy “other tuna” landings from the study area were taken in shelf break and deep water areas off the southwest Grand Bank and deep water areas east and southeast of the Grand Bank. Landings were comprised primarily of bigeye and albacore tuna. Albacore landings were reported only from off the southwest Grand Bank. Logbook data indicated “other tuna” landings from the study area averaged 15t per year with a high of approximately 30t in 2000 and a low of 0t in 2003. The majority of “other tuna” landings were comprised of bigeye tuna.
DFO (1998) indicated that although landings of “other tunas” tends to be relatively low these stocks should not be considered underutilized. In fact, all three species are being fished at or beyond maximum sustainable yield estimates.
DFO. 1998. Canadian Atlantic Integrated Fishery Management Plan Bigeye (Thunnus obesus) Yellowfin (Thunnus albacares) Albacore (Thunnus alalunga) Tunas 1998-1999. Fisheries and Oceans Canada.

Map of Bigeye and Albacore Tuna Landings (2000 – 2003)
Oil and Gas: Production Licences and Facilities
As of August 2005, Canada-Newfoundland and Labrador Offshore Petroleum Board (CNLOPB) (2005) indicated there were six Production Licences (PLs) on the Grand Banks. They are all located on the northeastern Grand Bank in the Jeanne d’ Arc Basin within the study area. Two PLs are associated with the Hibernia field, three PLs are associated with the Terra Nova field and one PL is associated with the White Rose field. The PLs encompass a total area of over 40,000 ha.
Regarding production facilities, the Hibernia project uses a Gravity-Based Structure (GBS) for drilling and production operations. The GBS is located 315 kilometres east of St. John’s in water depth of 80 metres and began production in 1997. The Terra Nova project uses a Floating Production, Storage and Offloading (FPSO) vessel that is located 35 kilometres to the southeast of the Hibernia GBS. It operates in water depths of 95 metres and began production at the Terra Nova field in 2002.
CNLOPB. 2005. Canada-Newfoundland and Labrador Offshore Petroleum Board. St. John’s, NL. Date accessed: December 2006.
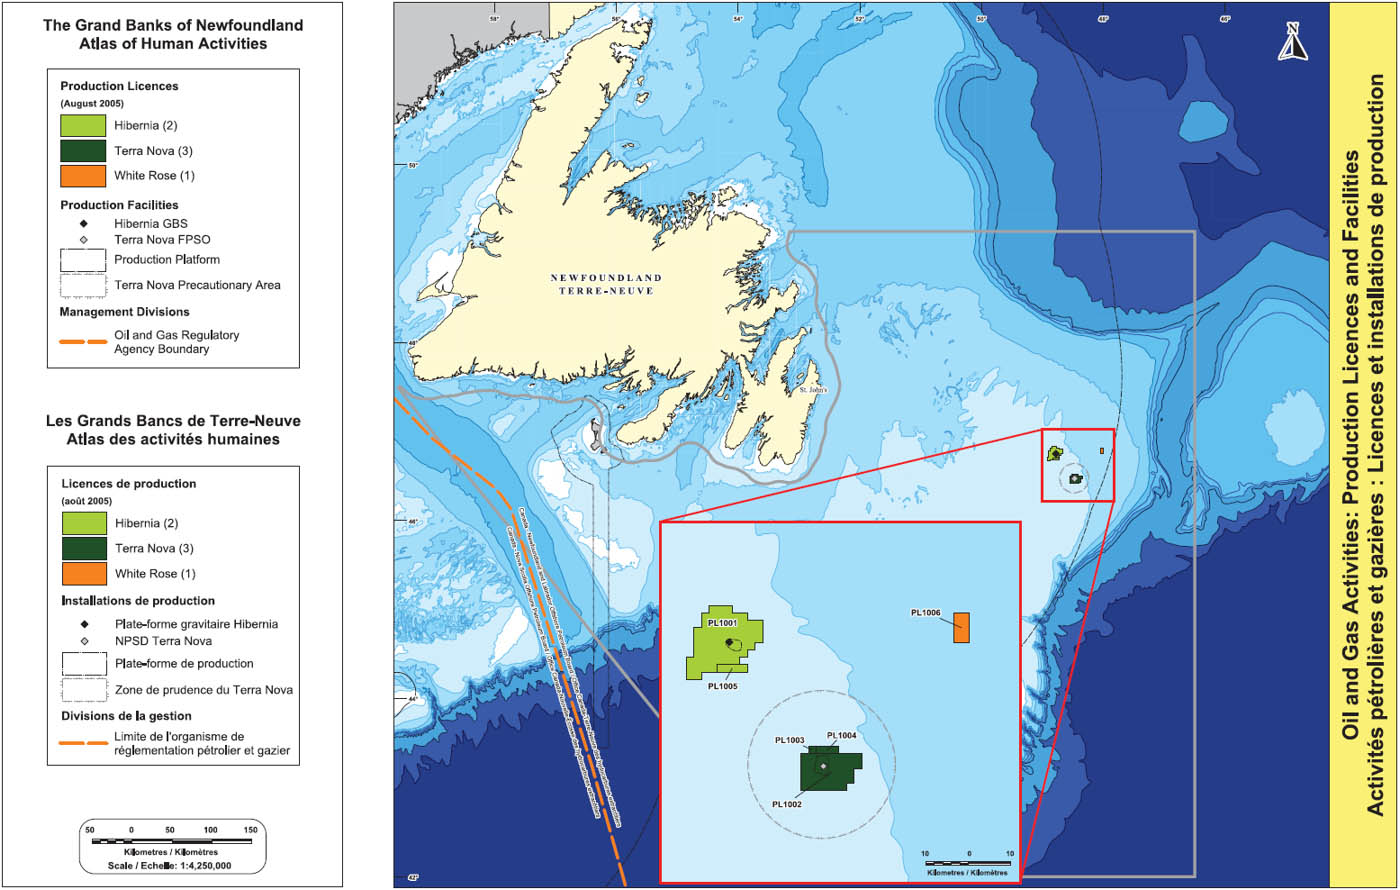
Map depicting Production Licences and Facilities
Oil and Gas: Development Wells (2000 – 2005)
Development wells have been drilled as part of the Hibernia, Terra Nova and White Rose Projects. CNLOPB (2005) indicates 53 development wells were completed, suspended or abandoned as part of the Hibernia project from 2000 - 2005. Of this total, nine wells were abandoned or suspended primarily due to operational problems. An additional four wells were in the process of being drilled. Development wells include oil producers, water injectors and gas injectors.
CNLOPB (2005) indicates 39 development wells were completed or abandoned as part of the Terra Nova project from 2000 - 2005. Of this total, ten wells were abandoned primarily due to operational problems. As with the Hibernia project, Terra Nova development wells include oil producers, water and gas injectors.
The White Rose project is the oil and gas industry’s most recent development project on the Grand Banks. Since 2003, 14 development wells have been completed or suspended as part of the project. Of this total, half (seven) of the wells have been suspended. As with the Hibernia and Terra Nova projects, development wells for White Rose include oil producers, water and gas injectors.
CNLOPB. 2005. Canada-Newfoundland and Labrador Offshore Petroleum Board. St. John’s, NL. Date accessed: December 2006.
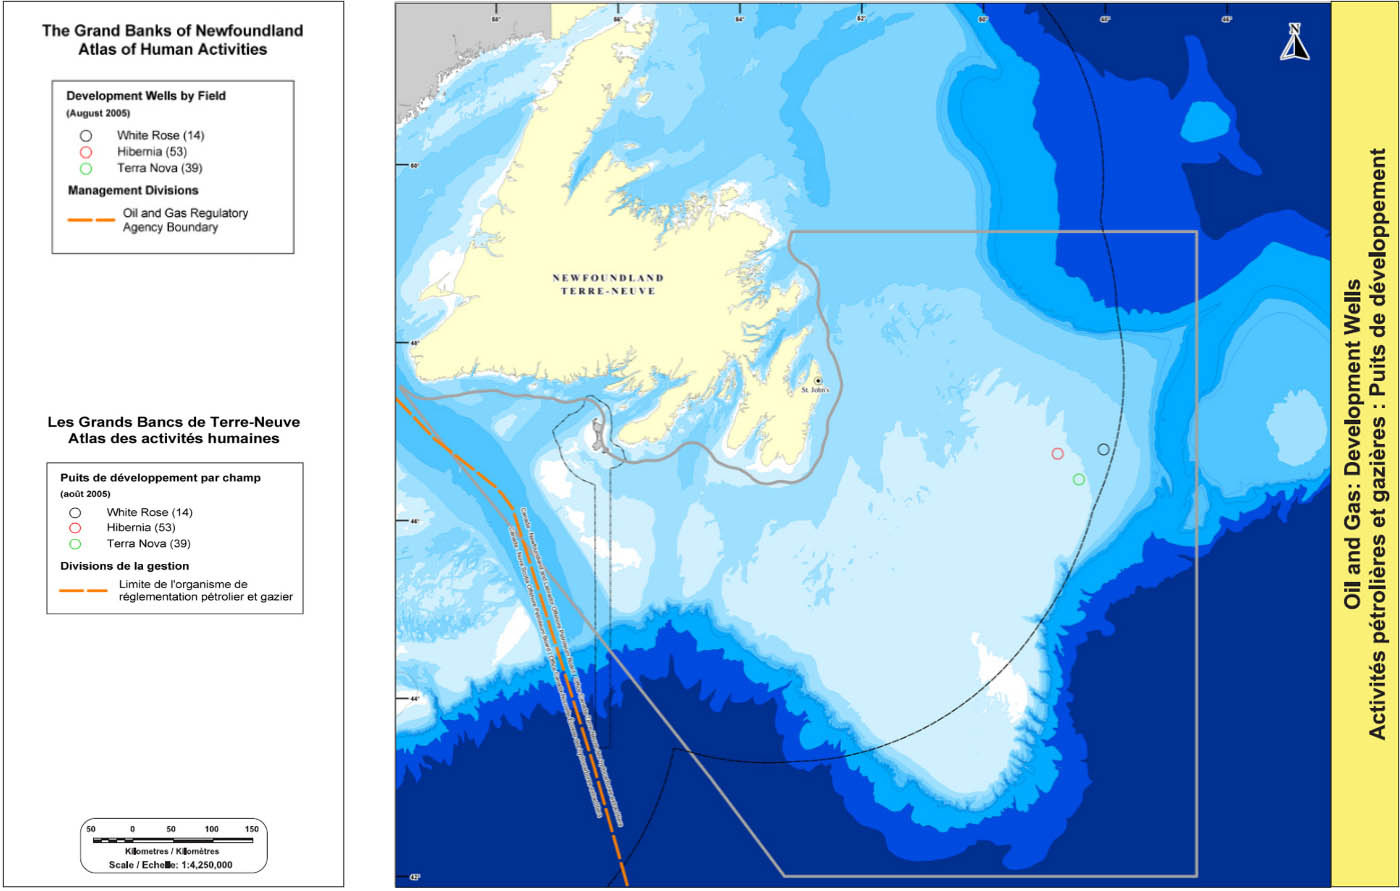
Map depicting Development Wells (2000 – 2005)
Oil and Gas: Significant Discovery and Exploration Licences
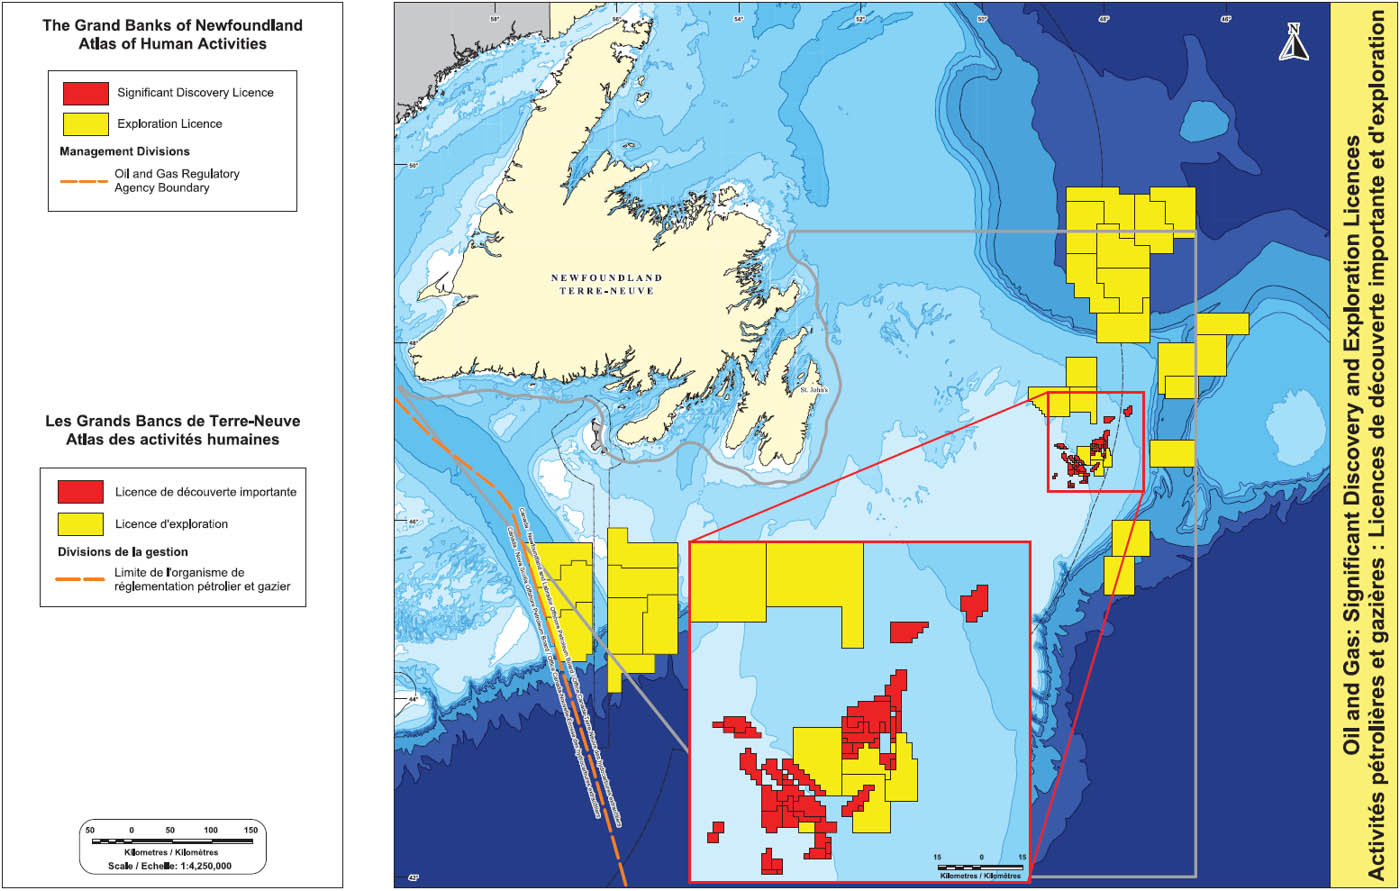
Map depicting Significant Discovery and Exploration Licences
As of August 2005, the Canada Newfoundland and Labrador Offshore Petroleum Board (CNLOPB) (2005) indicated there were 44 current Significant Discovery Licenses (SDLs) on the Grand Banks. The SDLs are located on the northeastern Grand Bank and are associated with the Terra Nova, White Rose, Hebron, Ben Nevis, West Ben Nevis, North Ben Nevis, Trave, Mara, South Mara, Nautilus, East Rankin, Springdale, West Bonne Bay, Fortune, King’s Cove, South Tempest and North Dana fields. The SDLs encompass an area of over 135,000 ha and the majority of fields contain oil with lesser numbers containing gas. Petroleum reserves and resources on the Grand Banks are estimated at over 2 billion barrels of oil, 5.4 trillion cubic feet of natural gas and 313 million barrels of natural gas liquids (CNLOPB 2005).
As of August 2005, CNLOPB (2005) indicated there were 37 current Exploration Licences (ELs) on the Grand Banks. The ELs are distributed throughout the study area in locations such as the Laurentian Channel and St. Pierre Bank area (Laurentian Sub-basin), the southwest Grand Bank (South Whale Sub-basin), the northeast Grand Bank (Jeanne d’Arc Basin), the northeast portion of the study area (Orphan Basin), along the eastern boundary of the study area (Flemish Pass Basin) and deep water locations off the Nose of the Grand Bank (Flemish Basin). The ELs cover an area of over 7 million ha.
From 2000 – 2004, 27 ELs were issued on the Grand Banks through calls for bids covering an area of approximately 4.8 million ha. The break down of issued ELs by area is as follows (CNLOPB 2005):
- Orphan Basin – 8 ELs (2,124,990 ha)
- South Whale Basin – 6 ELs (1,251,630 ha)
- Jeanne d’Arc Basin – 10 ELs (756,343 ha)
- Carson Bonnition Basin – 2 ELs (404,295 ha)
- Flemish Pass Basin – 1 EL (237,645 ha)
An additional eight ELs on the Laurentian Sub-basin were converted from exploratory permits in 2003 (CNOPB 2004). These ELs cover a total area of approximately 2.1 million ha.
The eight ELs in the Orphan Basin were issued in the 2003 Call for Bids. The Orphan Basin was the only area in which parcels were offered that year. CNOPB (2004) indicated the Orphan Basin is the next focus area for detailed resource assessment by the CNLOPB and the Geological Survey of Canada (CNOPB 2004). This assessment is expected to take several years.
CNOPB. 2004. Annual Report 2003-2004. Canada-Newfoundland and Labrador Offshore Petroleum Board. St. John’s, NL.
CNLOPB. 2005. Canada-Newfoundland and Labrador Offshore Petroleum Board. St. John’s, NL. Date accessed: december 2006.
Oil and Gas: Historic Drilling Activity
A total of 149 wells were spudded within the study area from January 1, 1965 to December 31 1999; of that total, 97 were exploratory wells, 26 were delineation wells and 21 were development wells (pers. comm. Dave Hawkins, CNLOPB). Five additional sidetrack wells (development) were also included in that total. All of the wells drilled on the “south Grand Banks”, as well as the wells located in the northwest portion of the study area were exploratory and abandoned with only one (on the southwest Grand Bank) designated as an “oil show”. The remaining wells were drilled on the “north Grand Banks” which corresponds with significant discoveries and the main area of oil and gas development activity.
CNLOPB. 2005. Canada-Newfoundland and Labrador Offshore Petroleum Board . St. John’s, NL. Date accessed: August 2005.
Hawkins, Dave. Exploration Manager. Canada-Newfoundland and Labrador Offshore Petroleum Board. St. John’s, NL
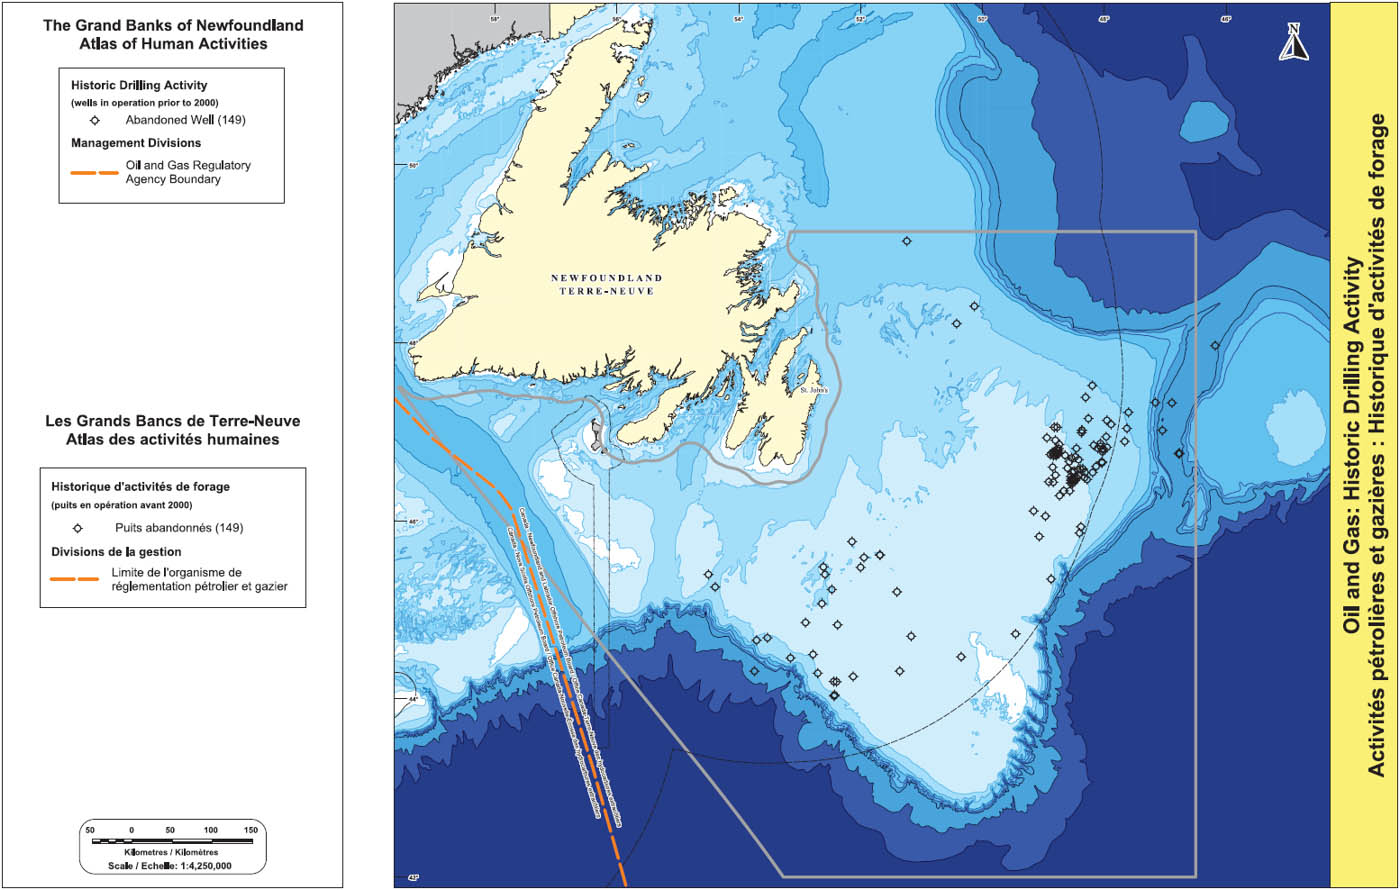
Map depicting the Historic Drilling Activity
Commercial Seismic Surveying (1995 - 1999)
Seismic surveying is conducted in the exploration phase of oil and gas development as a method to determine the sub-surface location of potential petroleum deposits. In marine environments, seismic survey vessels tow air-gun arrays and a series of hydrophones behind the vessel. The air-guns emit energy pulses to the seabed and the reflected sound waves from the subsurface rock layers are recorded by the hydrophones. Analyses of the returning sound waves enable scientists to determine the geological characteristics of the seabed and underlying rock layers and help to predict the presence of petroleum deposits.
Surveys are conducted using either 2-D or 3-D technology. 2-D surveys provide a two dimensional cross section of the substrate while 3-D surveys allow a more detailed three dimensional examination. In general, most initial surveys are conducted using 2-D technology and further investigation of an area with petroleum potential is conducted with 3-D prior to drilling activity.
2-D seismic activity for the study area and adjacent areas from 1995 - 1999 is depicted in the map. Each shaded cell (approximately 38 km2) on the map shows seismic acquisition effort as the sum of estimated trackline kilometres shot in that cell. The map only shows seismic programs conducted by industry and not those conducted by government or other researchers. It should be noted that only seismic data surveys conducted from 1995 – 1999 are shown because it has passed its privileged date.
The Nose of the Grand Bank and the Laurentian Basin south of St. Pierre Bank were centres of extensive seismic survey activity from 1995 - 1999.
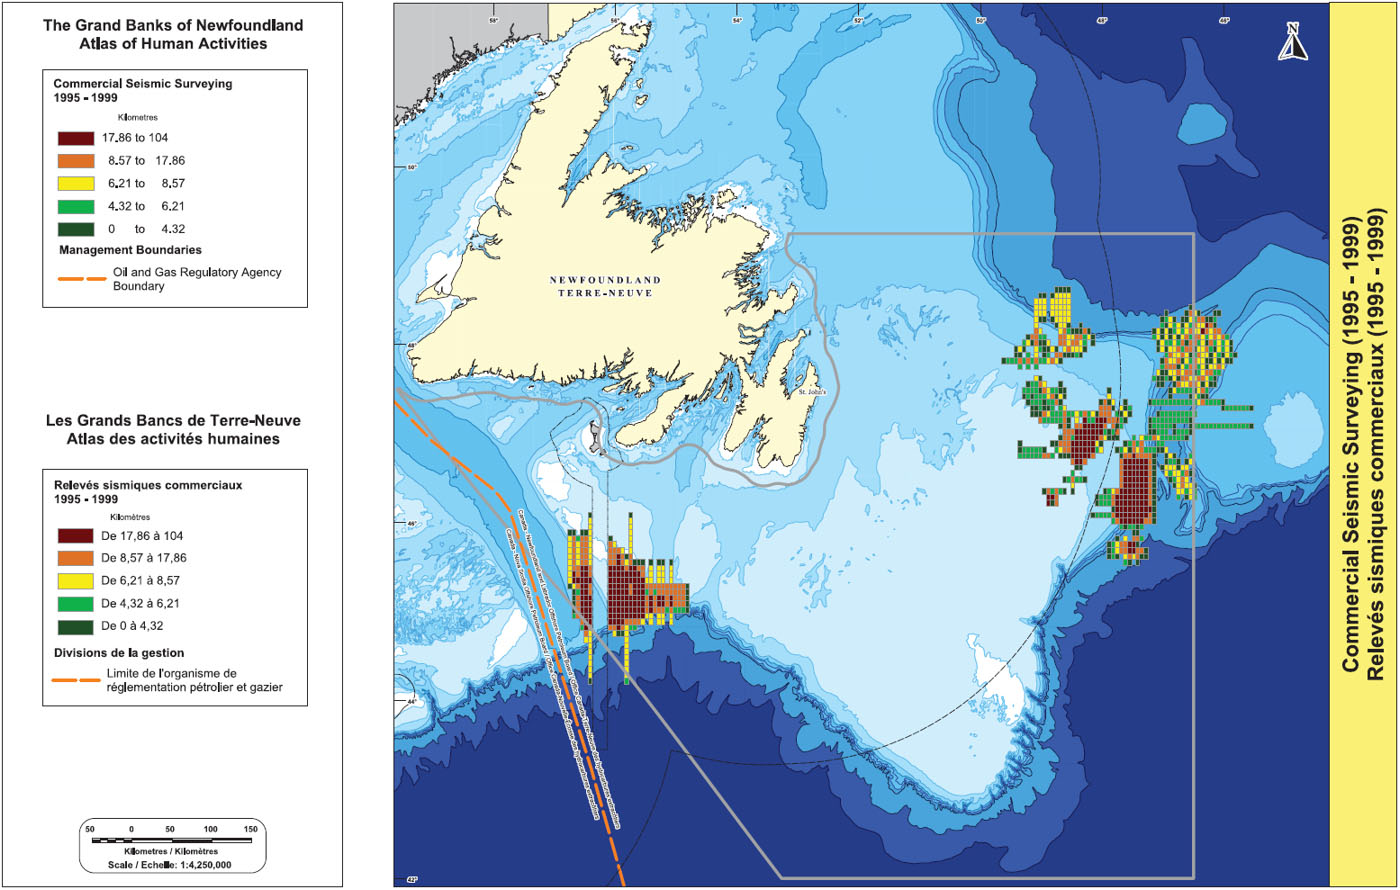
Map depicting Commercial Seismic Surveying (1995 – 1999)
Commercial Shipping: Great Circle Routes

Map of Great Circle Routes
In 2002, Fisheries and Oceans Canada (DFO), Maritimes Region and Environment Canada/Canadian Wildlife Service (Newfoundland and Labrador) commissioned a report by Geocentric Mapping Consulting entitled Marine Commercial Vessel Traffic Activity in Atlantic Canada (Geocentric Mapping Consulting 2002). As part of that report, mapping of the Great Circle Routes between Canada and Europe and North America and Europe was undertaken.
Geocentric Mapping Consultants (2002) noted the British Admiralty’s Great Circle Route maps (North America - Europe and Caribbean - Atlantic Region) in Ocean Passages for the World were examined for common Great Circle Route destination points and rhumblines to port destinations in Atlantic Canada. The Great Circle Route digital layers were developed from a database of endpoints (ports of call) provided in Ocean Passages for the World. The plottable coordinates were read from charts (2.50) Routes Canada - Europe, (2.63) Routes North America - Europe and (2.102).
Convergence of Great Circle Routes occurs in the study area on the Grand Bank west of Carson Canyon and south of the Grand Bank. Additional routes through the northern portion of the planning area converge southeast of Cape Race. This convergence point lies outside the proposed planning area boundary. Geocentric Mapping Consultants (2002) stated the convergence of Great Circle Routes to these (and other Atlantic Canada) points distinguished six dominant arrow paths into Atlantic Canada from seven international departure point groupings.
Geocentric Mapping Consulting. 2002. Marine Commercial Vessel Traffic Activity in Atlantic Canada. Fisheries and Oceans Canada (Dartmouth, NS) and Environment Canada
Canadian Wildlife Service - Wildlife Enforcement (St. John’s, NF)
Commercial Shipping: Traffic Density (2000)

Map depicting the Commercial Shipping: Traffic Density (2000)
This map depicts commercial shipping density for a representative year (2000) of inbound traffic through the study area. The primary source of commercial vessel data for Canadian waters is the Canadian Coast Guard’s Eastern Canada Vessel Traffic Services Zone (ECAREG) system. This is a mandatory reporting system for all commercial vessels over 500 gross registered tons (GRT) transiting within Canada’s 12 nautical mile territorial sea. Vessel trip records include information on vessel size, class, cargo and departure/destination points. The ECAREG system also provides geo-referenced information (latitude/longitude) for chronological movement reports made during individual vessel trips.
This map does not show all international shipping through the study area for the year 2000 for several reasons. The map includes only inbound traffic; however, other analyses have indicated that the density pattern of departing vessels is much the same as the inbound traffic pattern. In addition, the ECAREG system does not include information on vessels transiting through Canada’s Exclusive Economic Zone (EEZ) if they are not departing or entering the territorial sea or inland waters.
The vessel tracks depicted on the map were generated by plotting vessel movements as straight lines between reported vessel locations in the ECAREG data set. Subsequently, the number of ship tracks passing through each cell of a two-minute grid was counted. A thematic map using custom ranges of a various color scheme based on the number of ship tracks in each grid cell was created. These ranges were used to determine relative densities of the vessel tracks and routes. The resulting traffic density map corresponds to the known and expected shipping patterns in the study area, with the highest density of traffic passing to the south of the island towards the Cabot Strait. This ship traffic is associated with trans-Atlantic traffic from Europe as well as oil and gas related shipments to the transhipment facility and refinery in Placentia Bay.
Ferry Routes: South Coast And Placentia Bay
The ferry routes to note for the study area are the Marine Atlantic services from North Sydney, Nova Scotia to Argentia, Newfoundland and Labrador; and from North Sydney, Nova Scotia to Port aux Basques, Newfoundland and Labrador. Marine Atlantic operates the 280 nautical mile Argentia route three times per weekFootnote 3 from June to September for a total of 40 round trips (Marine Atlantic 2005). This route traverses the western portion of the planning area. The 96 nautical mile Port aux Basques route operates daily year round. One to three crossings per day are undertaken from early-September to mid-June and three to four crossings per day are undertaken in the busier summer months (mid-June to early September). The North Sydney to Port aux Basques route traverses the extreme northwest corner of the study area.
Smaller south coast ferries and the Fortune to St. Pierre ferry operate outside the study area.
Marine Atlantic. 2005. Marine Atlantic website. Accessed September 19, 2005.
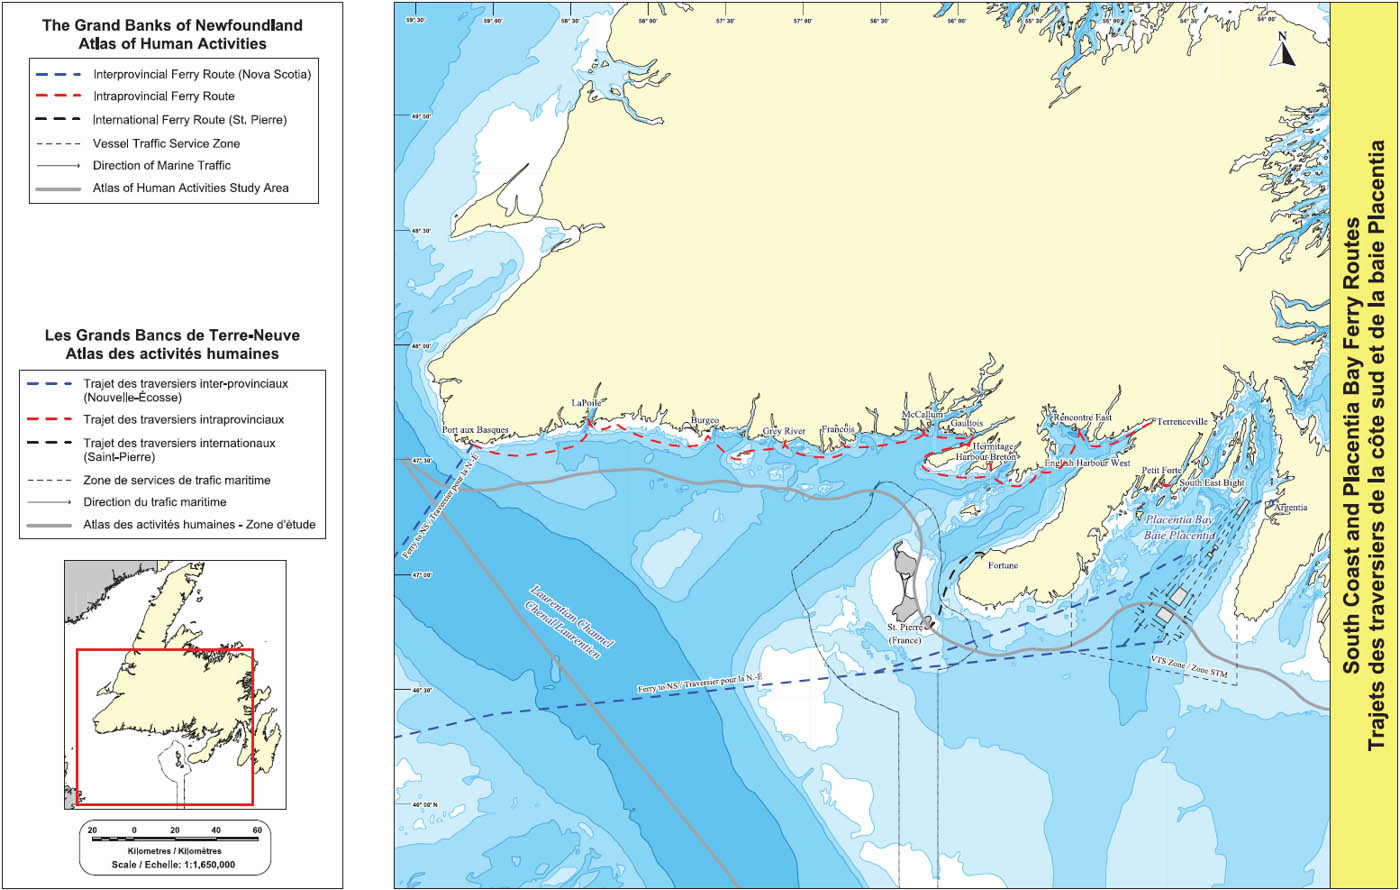
Map of Ferry Routes: South Coast and Placentia Bay
Aerial Surveillance: Vessel Sightings (2002)

Map depicting the Aerial Surveillance: Vessel Sightings (2002)
Provincial Airlines Limited (PAL) has been contracted by the Government of Canada to provide fisheries air surveillance services (PAL 2004). Surveillance operations are conducted mainly on (but not limited to) the east coast using three modified Beechcraft King Air B200 aircraft. These aircraft are equipped with sophisticated and integrated surveillance and data management equipment effective both day and night (DFO 1999). The aircraft provides support to the department and acts as a deterrent to illegal activity. They also assist in the documentation of violations.
During a flight, a variety of information is recorded in relation to vessels observed. This includes position, platform type, platform name, NAFO Division, port code, port name, jurisdiction, inside or outside 200 nautical miles, bathymetry and activity (fishing, steaming, jogging etc.).
This map depicts the locations of vessels sighted by surveillance aircraft throughout a representative year (2002). Sightings include all vessel types including commercial shipping vessels, Canadian and international fishing vessels, etc. It is evident that vessel sightings were distributed on shelf and slope areas throughout the study area. Particularly high concentrations of vessels were located on the Tail of the Grand Bank as well as the slope area northwest of the Grand Bank outside the Canadian 200 nautical mile exclusive economic zone (EEZ). This is reflective of a high concentration of dedicated air surveillance patrol that tends to focus on these areas outside the Canadian 200 nautical mile EEZ where foreign fishing vessels concentrate their activity in the NAFO Regulatory Area. (pers. comm. Morley Knight, Fisheries and Aquaculture Management).
DFO. 1999. Five Year Air Surveillance Contract Awarded to Provincial Airlines Ltd. News Release January 15, 1999.
PAL. 2004. Provincial Airlines Successful in Bid for Five-Year DFO Aerial Surveillance Contract. News Release. March 16, 2004.
Knight, Morley. Director of Conservation and Protection, Fisheries and Aquaculture Management. Fisheries and Oceans Canada. Newfoundland and Labrador Region. St. John’s, NL.
Canadian Coast Guard Search And Rescue

Map depicting Canadian Coast Guard: Search and Rescue
This map depicts the number and location of search and rescue incidents within the study area from 2000 – 2004. The data is based on unpublished statistics provided by the Canadian Coast Guard (CCG) (pers. comm. Brian Stone, Canadian Coast Guard). CCG maintains several primary search and rescue units throughout the region that are capable of offshore response. An inshore patrol vessel operates seasonally (spring, summer and fall) out of St. Anthony with a range of 120 nautical miles to seaward and up to one week of endurance. Two 47 foot MLB lifeboats with a range of 80 nautical miles operate seasonally (spring, summer and fall) out of Port au Choix and Lark Harbour; however, these are replaced with an Icebreaker which services the West Coast during the ice navigation season (pers. comm. Neil Peet, Canadian Coast Guard). The South Coast is covered by two AURN lifeboats located in Burgeo and Burin. These stations have the capability to respond to incidents within a range of 100 nautical miles (out and back) year-round. One offshore SAR patrol vessel and two offshore Fisheries patrol vessels operate out of St. John’s and are enlisted (as needed) for search and rescue response on the East Coast. The Northeast Coast is covered seasonally (spring, summer and fall) by an offshore patrol vessel; however, during winter, due to ice conditions, this vessel is replaced with an ice-capable vessel (pers. comm. Neil Peet, Canadian Coast Guard). There were a total of 641 search and rescue incidents distributed throughout the planning area from 2000 – 2004. Areas of high concentrations of incidents are found along the slope area in the north of the study area, the northern Grand Bank and on the Southeast Shoal.
Stone, Brian. Superintendent of Maritime Search and Rescue. Canadian Coast Guard. Newfoundland and Labrador Region. St. John’s, NL.
Peet, Neil. Supervisor of Marine Search and Rescue Programs. Canadian Coast Guard. Newfoundland and Labrador Region. St. John’s, NL.
Research: Oceanographic Moorings and Weather Buoys
This map depicts the location of oceanographic moorings and weather buoys deployed in the study area for the purposes of atmospheric and oceanographic data collection. Environment Canada maintains two surface weather buoys in the study area on the southwest Grand Bank that collect data such as sea level pressure, wind speed and direction, air temperature and sea surface temperature (NOAA 2005). An additional two Environment Canada surface weather buoys are located to the north of the study area on Burgeo Bank and Nickerson Bank (south of the Avalon Peninsula).
The Bedford Institute of Oceanography has established six oceanographic sub-surface moorings within the study area: two in the Flemish Pass and four in the northeast portion of the study area (Orphan Basin area) (NAFO 2005). These sub-surface moorings consist of a line attached to a train wheel on the bottom and a subsurface float on the top. Current meters are attached to the line at different depths. The depth of sub-surface floats ranges from 90 metres to over 2200 metres below the surface and moorings are accompanied by surface guard buoys with radar reflectors. NAFO (2005) indicated these moorings were scheduled to be deployed until the summer of 2005.
NAFO. 2005. Caution! Subsurface Moorings in Flemish Pass. Date accessed: September 20, 2005.
NOAA. 2005. National Data Buoy Center. National Oceanic and Atmospheric Administration. Date accessed: September 20, 2005.

Map depicting research: Oceanographic Moorings and Weather Buoys
Research: Oceanographic and Multi-Species Surveys

Map depicting research: Oceanographic and Multi-species Surveys
This map depicts oceanographic and multi-species trawl survey locations for a representative year (2002) within the study area. A suite of standard oceanographic monitoring stations along sections of the northwest Atlantic Ocean were adopted in 1976 by the International Commission for the Northwest Atlantic Fisheries (ICNAF) (ICNAF 1978). These monitoring stations extend from Cape Cod (USA) to Egedesminde (West Greenland) and three sections are located within the study area; the Bonavista section (off the Bonavista Peninsula), the Flemish Cap section (crossing the Grand Bank at 47º N continuing eastward to the Flemish Cap) and the Southeast Grand Bank section. Sampling of these sections is incorporated in the Atlantic Zone Monitoring Program (AZMP) through which temperature, salinity, nutrients, oxygen, chlorophyll and plankton are monitored. Annual sampling is conducted two (spring and fall) to three (spring, summer and fall) times per year. In 2002, in addition to the standard sections, the Station 27 section off St. John’s, as well as locations on the Grand Bank and deep water off the southeast Grand Bank were sampled as well.
Fisheries and Oceans Canada has conducted annual stratified random trawl surveys during autumn (fall) in the Newfoundland and Labrador Region since 1977 (Brodie 2005). From 1990 onward the fall survey has covered the offshore areas of Divisions 2J, 3K, and 3LNO and since 1995 have been scheduled to run from late September to mid-December. Brodie (2005) stated “the main objectives are to determine the distribution and abundance of various groundfish and shellfish species and to collect biological samples…the survey design is stratified random, with the allocation of sets proportional to stratum area within a division, and a minimum of two sets in each strata.”
Spring (April – June) random stratified surveys have been carried out on the Grand Bank (3LNO) each year from 1971 to 2004 with the exception of 1983 (Dwyer et al. 2005). Winter-spring random stratified surveys have been conducted by Canada in offshore areas of subdivision 3Ps since 1972 (Brattey et al. 2004). Survey timing has varied over the years with surveys conducted in February, March and April.
Winter, spring and fall surveys have been conducted by research vessels using a variety of sampling equipment. Various trawls (Yankee 36, Engel 145 and Campleon 1800) have been used at different periods of time and conversions exist for comparisons of data between Yankee-Engel and Engel-Campelon sampling (Dwyer et al. 2005).
Brattey, J., N.G. Cadigan, B.P. Healey, G.R. Lilly, E.F. Murphy, P.A. Shelton and J.C. Mahe. Assessment of the cod (Gadus morhua) stock in NAFO Subdivision 3Ps in October 2004. CSAS Research Doc. 2004/083. Canadian Science Advisory Secretariat.
Brodie, W.B. 2005. A Description of the Autumn Multispecies Surveys in SA2 + Divisions 3KLMNO from 1995-2004. NAFO SCR Doc. 05/8. Serial No. N5083. Northwest Atlantic Fisheries Organization.
Dwyer, K.S., M.J. Morgan, D. Maddock-Parsons, W.B. Brodie, B.P. Healey, P.A. Shelton and H. Murua. 2005. An Assessment of American Plaice in NAFO Divisions 3LNO. NAFO SCR Doc. 05/61. Serial No. N5147. Northwest Atlantic Fisheries Organization.
ICNAF. 1978. List of ICNAF Standard Oceanographic Sections and Stations. ICNAF selected papers #3. International Commission for the Northwest Atlantic Fisheries.
Submarine CablesFootnote 4

Map depicting Submarine Cables
The submarine cable data depicted on this map is derived from the Atlantic Submarine Cable and Pipeline Database that has been compiled by the Canadian Hydrographic Service (CHS) in conjunction with International Telecom. The positions have been compiled from archival CHS records as well as information provided by cable companies (CHS 2005). Additional information was accessed through Notices to Mariners (DFO 2005) and the International Submarine Cable Protection Committee (ISCPC 2005). It is recognized that some cables are depicted as having end points in the open ocean. This is how that data is presented on CHS (2005) and may reflect incomplete data.
The study area contains several abandoned submarine cables many of which date back to the days of telegraph communications (19th century). The majority of these cables are located in the northern and western portions of the study area. Currently, the only active submarine cables in the area are found in deep water off the south and southeast portion of the Grand Bank. Hibernia Atlantic operates a modern fiber-optic cable that runs from the UK and Ireland to the United States, and Teleglobe Canada operates a cable that runs from Pennant Point, Nova Scotia to Iceland (pers. comm. Andrew Smith, Canadian Hydrographic Service).
DFO. 2005. Notice to Mariners website. Fisheries and Oceans Canada. Date accessed September 14, 2005.
CHS. 2005. Canadian Hydrographic Service. Fisheries and Oceans Canada. Date accessed September 14, 2005.
ISCPC. 2005. International Submarine Cable Committee.
Smith, Andrew. MD Hydrographer. Canadian Hydrographic Service. Dartmouth Nova Scotia.
Ocean Disposal: Potential Warfare Agent Disposal Sites
The Warfare Agent Disposal (WAD) project was initiated by the Department of National Defence (DND) in the early 1990s to address the ocean dumping and burial of weapons and chemicals that occurred after the Second World War (DND 2005). DND (2005) stated “the main objective of the WAD project is to identify and assess all warfare agent disposal sites across Canada and in Canadian waters and to prioritize these sites according to the risks they may pose to human health and the environment.”
This map depicts the location of warfare agent disposal sites within the study area based on navigational charts and Notices to Mariners (CHS 1999a; 1999b, DFO 2004). There are two known disposal sites for explosives in the study area; one due east of St. John’s and the other on the slope area south of Whale Bank. Please note the symbol for the more northerly site does not depict the exclusion area because it is too small to display at this scale. Another site, in deep water due south of the Halibut Channel, contains both explosives and chemicals.
CHS. 1999a. Navigational Chart 4047: St. Pierre Bank to Whale Bank. 1:400,000. Canadian Hydrographic Service.
CHS. 1999b. Navigational Chart 4049: Grand Bank Northern Portion to Flemish Pass. 1:400,000. Canadian Hydrographic Service.
DFO. 2004. Notice to Mariners June 25, 2004. Fisheries and Oceans Canada.
DND. 2005. Backgrounder: Warfare Agent Disposal Project. Department of National Defence . Date accessed September 21, 2005.
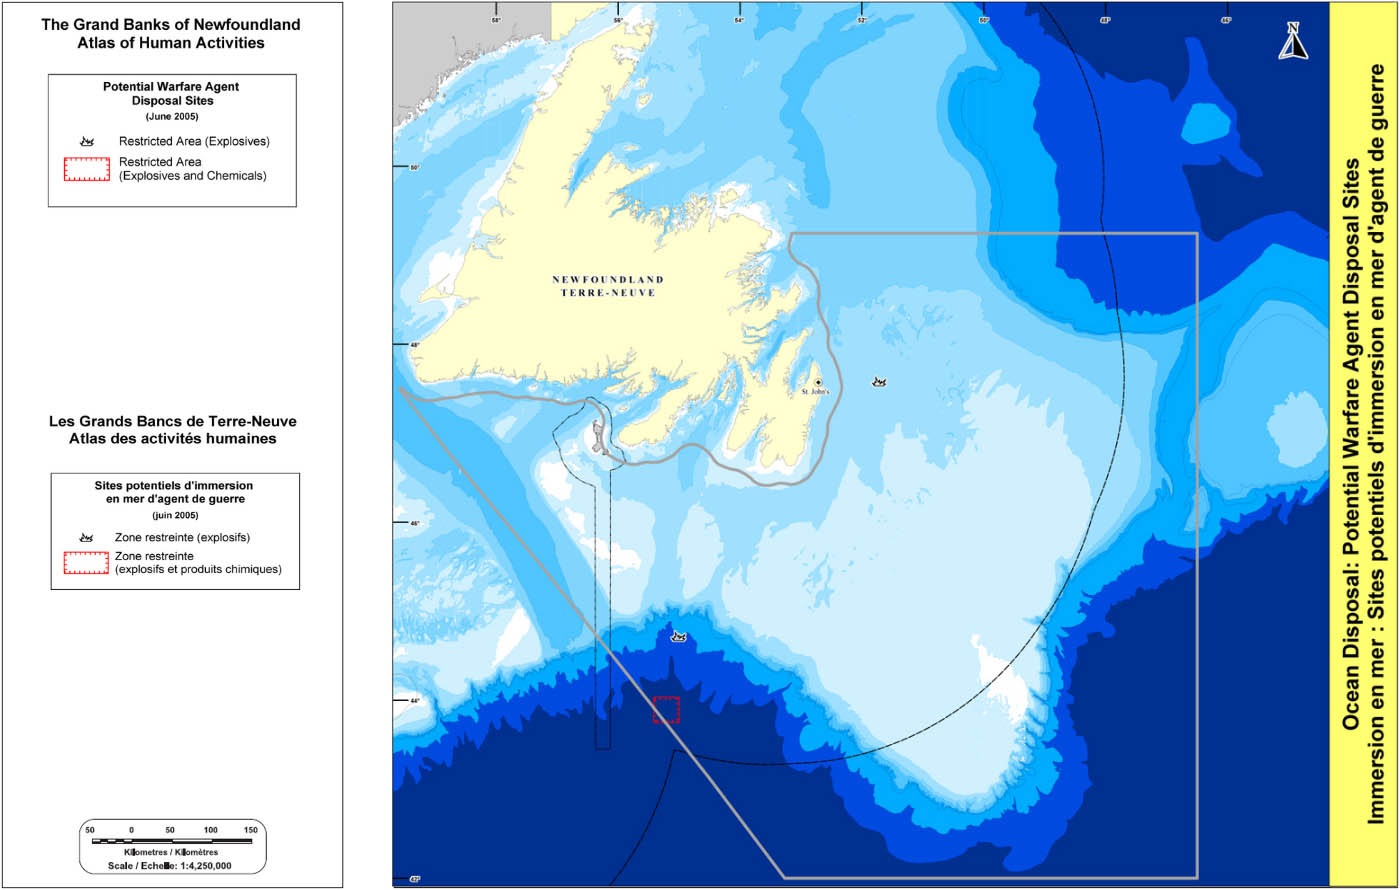
Map depicting the Ocean Disposal: Potential Warfare Agent Disposal
- Date modified: