
Canadian Extreme Water Level Adaptation Tool (CAN-EWLAT)
Extreme water levels along coastlines can result from a combination of storm surges, tides and ocean waves. Projections of climate change effects in the marine environment show that global sea level rise and declining sea ice will increase extreme water level events in the future. This will directly impact Canada's coastlines and coastal infrastructure. Understanding these changes is essential for developing adaptation strategies to minimize the negative effects to coastal infrastructure.
On this page
About this tool
The Canadian Extreme Water Level Adaptation Tool (CAN-EWLAT) is a science-based adaptation planning tool that provides sea level rise projections for Canada's coastlines over the coming century, and advice on how much higher to build coastal infrastructure to accommodate the projected rise. The tool, developed for small craft harbour locations, is also useful for planners dealing with infrastructure along Canada's ocean coastlines.
Disclaimer
The maps and data contained in this application have been made available for information purposes only.
Fisheries and Oceans Canada does not warrant the reliability, currency, positional or thematic accuracy of any data or information published in these maps. Misalignment of some datasets may occur due to the methods used to produce the original product. Fisheries and Oceans Canada assumes no responsibility for errors in the content of the provided information.
Under no circumstances will Fisheries and Oceans Canada be liable to any person or entity for any direct, indirect, special, incidental, consequential or other damages resulting from the use of data or information contained in these maps. This includes, without limitation, any lost profits or business interruption.
Use of data or information obtained from the Government of Canada's Open Data portal is subject to the Open Government Licence. For more information, visit Open Government Licence - Canada.
When accessing data or information, users may be directed to a non-government web service location. Data or information obtained from other web services may be subject to the particular source's licence requirements and permissions.
Glossary
- Allowance
-
Allowances are the recommended vertical distance that coastal infrastructure need to be raised to prevent the risk of flooding from sea level rise. These estimates are based on a combination of 2 factors:
- The projections of future relative sea level change along with the uncertainties in those projections.
- Historical water level records, including both tides and storm surge (referred to as storm tides) at tide gauge sites. At small craft harbour sites with no tide gauge data available, storm-surge models are used to simulate historical storm tides. CAN-EWLAT does not incorporate predicted changes in storm tides over the coming century because the current state of knowledge of future projections of storminess is limited.
- Any infrastructure raised by this allowance would account for the possibility of flooding in the future due to sea level rise. It is important to note that the allowances only relate to flooding and not erosion of soft shorelines nor impacts associated with this erosion.
- AR5
- This stands for the Fifth Assessment Report of the Intergovernmental Panel on Climate Change.
- AR6
- This stands for the Sixth Assessment Report of the Intergovernmental Panel on Climate Change.
- CurWaveSummer
- Maximum wave height during the summer in the current climate
- CurWaveWinter
- Maximum wave height during the winter in the current climate
- Fetch
- The distance along open water over which the wind blows
- GIA
- Glacial Isostatic Adjustment is caused by the rebound of the Earth from the several kilometer thick ice sheets that covered much of North America and Europe around 20,000 years ago. Mantle material is still moving from under the oceans into previously glaciated regions on land.
- GPS
- In the CAN-EWLAT application, Global Positioning System (GPS) is used to measure the vertical movement (up and down in millimetres per year) of the Earth's crust over time.
- IPCC
- The Intergovernmental Panel on Climate Change.
- MRSL projections
- Relative sea level (RSL) is defined as sea level measured with respect to land. Mean RSL is defined as RSL at a given location averaged over a period of 1 year. A projection is a potential future evolution of a quantity or set of quantities, often computed with the aid of a model. Unlike predictions, projections are conditional on assumptions concerning future socioeconomic and technological developments that may or may not be realized.
- ProjectedWaveSum
- Maximum wave height during the summer in the projected future climate
- ProjectedWaveWin
- Maximum wave height during the winter in the projected future climate
- RCPs
-
Representative Concentration Pathways (RCPs) are concentration pathways used in the IPCC AR5. They are prescribed pathways for greenhouse gas and aerosol concentrations, together with land use change, that are consistent with a set of broad climate outcomes used by the climate modelling community. The pathways are characterized by the radiative forcing produced by the end of the 21st century.
Radiative forcing is the extra heat the lower atmosphere will hold as a result of additional greenhouse gases, measured in Watts per square metre (W/m2).
Four RCPs scenarios have been designed for the AR5 and in CAN-EWLAT we are using 3 of these:
- RCP 2.6 (low)
- RCP 4.5 (intermediate)
- RCP 8.5 (high)
For more details, please refer to the AR5 report.
- Small craft harbour
- Fisheries and Oceans Canada owns, operates and maintains a national system of harbours found in local communities across Canada to provide commercial fish harvesters and other users with safe and accessible facilities. To learn more, visit Small craft harbours.
- SSPs
- Shared Socioeconomic Pathways (SSPs) are scenarios of projected socioeconomic global changes up to 2100. They are used to derive greenhouse gas emissions scenarios with different climate policies, and serve as the basis for IPCC AR6. In the SSP labels, the first number refers to the assumed shared socio-economic pathway, and the second refers to the approximate global effective radiative forcing in 2100.
- Storm surge
- The positive or negative difference in sea level from the predicted tide, due primarily to changes in air pressure and winds.
- Storm tide
- The combined effect of storm surge and tides.
- Tide
- The rise and fall of sea levels caused by the combined effects of the gravitational forces exerted by the Moon and the Sun and the rotation of the Earth.
- Tide gauge
- Tide gauges are installed by the Canadian Hydrographic Service to collect water levels against a vertical reference.
- Wave climate
- Wave climate is defines as the monthly average wave height for a specified time period.
Terms of use
The vertical allowances provided on CAN-EWLAT are with respect to Mean Water Level (MWL) epoch 2010 (Robin et al., 2016). In addition to the MWL epoch 2010, CAN-EWLAT also provides the following water level target heights:
- Lower Low Water Large Tide (LLWLT) epoch 2010
- Higher High Water Large Tide (HHWLT) epoch 2010
For definitions of these targets see: Definitions for content on tides and currents
All data are provided for each tide gauge and small craft harbour site relative to the known datum/reference levels:
- North American Datum of 1983 (Canadian Spatial Referencing System) {NAD83(CSRS)epoch 2010}
- Canadian Geodetic Vertical Datum of 1928 (CGVD28)
- Canadian gravimetric geoid model of 2013 (CGG2013)
Values relative to these references are provided using the following terminology, for example MWL_CGVD28, defining the height of MWL with respect to CGVD28. Positive values indicate that MWL is above CGVD28.
In the absence of additional tidal effects it may be assumed that all water level targets evolve vertically with relative sea level rise. Water level targets on the CAN-EWLAT site at tide gauge stations are derived from observations. Targets at small craft harbour sites are determined using a combination of both water level observations and modeled tides between observation sites. Potential average inaccuracies for both tide gauge and small craft harbour site water level target estimates can be approximately +/- 10 to 20 cm. Inaccuracies may be larger for areas with limited observations or where tidal behavior is either changing over time or has not been appropriately approximated by the modeling methods employed.
User guide
CAN-EWLAT is an interactive map used to explore sea level rise information and related climate change adaptation. It provides information at all DFO Small Craft Harbour and select Tide Gauge locations along Canada’s ocean coastline.

Full extent (view) of the CAN-EWLAT application.
| Widget | Image |
|---|---|
Location listThis widget is found on the right. It lists all of the locations with available information. This widget can be expanded by clicking on the circle that appears when you move your mouse cursor over the upper right corner of the panel. 
Symbol The panel can be reset to its original size by clicking on the same circle again. Click on an item in the Location List to zoom in on the map and display sea level rise information in the panel on the left. |

Small Craft Harbour location list that appears on the right panel of the application. |
Map panelThis panel is found in the center. It displays a map that shows DFO Small Craft Harbour locations and selected Tide Guage sites. The map can be expanded by clicking on the circle that appears when you move your mouse cursor over the upper right corner of the panel. The panel can be reset to its original size by clicking on the same circle again. The map panel has 2 tabs at the bottom:
|

Panel in the center of the application that displays a map with symbols for DFO Small Craft Harbour locations and selected tide gauge sites. |
ResetThis widget is found at the top right of the map. Click the button with home symbol to reset to the default map extent. |

Button to reset map extent to default. |
LegendThis widget is found at the top right of the map. Click the button with dots and lines. It displays a summary of the symbols displayed on the map. |
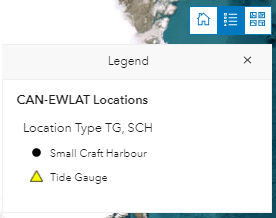
Legend button with drop-down panel displaying map symbols. |
BasemapsThis widget is found at the top right of the map. The default map is a satellite imagery basemap. Click the button with 4 squares. This widget will display options to change the basemap. Choose from several ocean-related basemaps that may provide additional information, such as harbour bathymetry. |

Button with drop-down list of basemap options. |
ZoomThis widget is found on the bottom right of the map. Click the plus sign (+) to zoom in on the map. Click the minus sign (-) to zoom out. By zooming in or out, the Location List panel will change to include the Small Craft Harbour and Tide Guage sites that are within the bounds of the map only. |
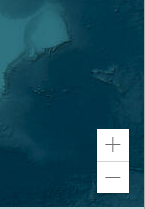
Widget to allow you to zoom in or out on the map. |
Panning the MapTo Pan the map, left click the mouse and hold then drag the map. |

Widget to allow you to reposition the map. |
Data panelThis widget is found in the panel on the left. It provides a summary of the data available for a site chosen from the Location List in the panel on the right. This widget can be expanded by clicking on the circle that appears when you move your mouse cursor over the upper right corner of the panel. The panel can be reset to its original size by clicking on the same circle again. You can naviate through the available data for the selected location by clicking on the arrows at the botton of the panel. The following site information is available:
|
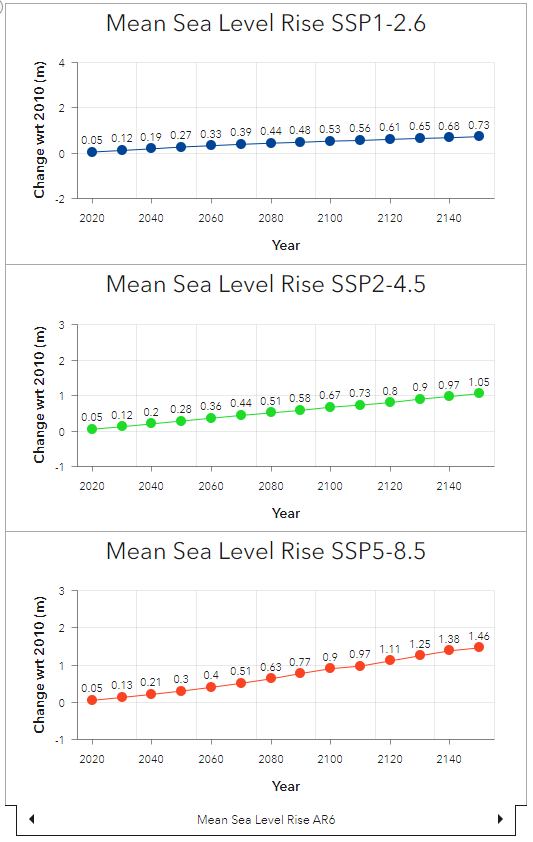
Sea level rise and wave climate data for the selected site. |
Disclaimer buttonThis widget is found in the top right. Click the white circle with the excamation mark (!). It contains the application disclaimers. |

Disclaimer button to make the application splash screen visible. |
Help buttonThis widget is found in the top right. Click the white circle with a question mark (?). It provides information on how to use the application. |

Help button to make the application help window visible. |
Data
The full data that was used to develop this application is available on the Government of Canada's open data portal.
Contact us
For more information or questions on CAN-EWLAT, contact Dr. Blair Greenan or Dr. Will Perrie.
- Date modified: