
Fisheries and Oceans Canada’s 2024-25 Departmental Results Report
Contents
- At a glance
- From the Minister
- Results – what we achieved
- Spending and human resources
- Supplementary information tables
- Federal tax expenditures
- Corporate information
- Definitions
Copyright information
© His Majesty the King in Right of Canada, as represented by the Minister of Fisheries, 2025
Catalogue Number: Fs1-84E-PDF
ISSN: 2561-0236
Aussi disponible en français sous le titre : Rapport sur les résultats ministériels 2024-2025
At a glance
This departmental results report details Fisheries and Oceans Canada’s actual accomplishments against the plans, priorities and expected results outlined in its 2024–25 Departmental Plan.
Key priorities
Fisheries and Oceans Canada identified the following key priorities for 2024-25.
Fisheries and Oceans Canada (DFO) and the Canadian Coast Guard (CCG) are responsible for a wide range of activities, including managing fish stocks efficiently and sustainably, supporting fishery workers and businesses, promoting habitat restoration and marine protection, and ensuring safe and accessible waterways, which are essential for trade and access to global markets. DFO and the CCG work with other federal departments, other levels of government, Indigenous Peoples, and stakeholders to grow Canada’s ocean and freshwater economy, support the long-term sustainable growth of Canada’s fish and seafood sector, and protect the safety of mariners in Canadian waters and Canada’s marine environment, ensuring Canada is positioned to succeed in the fast-growing global ocean sectors while advancing reconciliation, conservation, and climate objectives. Across all activities, DFO and the CCG continue to prioritize reconciliation with Indigenous Peoples and the recognition of rights related to fisheries, oceans, aquatic habitats, and marine waterways, including advancing the implementation of the United Nations Declaration on the Rights of Indigenous Peoples Act (UNDA) and its Action Plan.
Highlights for Fisheries and Oceans Canada in 2024-25
- Total actual spending (including internal services): $5,215,031,054
- Total full-time equivalent staff (including internal services): 14,880
For complete information on Fisheries and Oceans Canada’s total spending and human resources, read the Spending and human resources section of its full departmental results report.
Summary of results
The following provides a summary of the results the Department achieved in 2024-25 under its main areas of activity, called “core responsibilities.”
Core responsibility 1: Fisheries
Actual spending: $1,248,016,428
Actual full-time equivalent staff: 3,882
- worked with partner departments to publish the Blue Economy Regulatory Roadmap as part of the commitment to unlocking the strength and opportunity associated with Canada’s ocean economy
- continued to support the Canadian economy through the operation and maintenance (repairing, dredging, etc.) of a national network of small craft harbours, including by completing 218 of the 228 repair, renewal, and replacement projects planned under a $300 million investment through Budget 2021
- announced an investment in the construction of a new small craft harbour in Arctic Bay, Nunavut, in support of economic development, reconciliation, and Arctic sovereignty
- reinforced law enforcement by taking delivery of two 44-foot patrol vessels that will increase the capacity of fishery officers to monitor compliance with the Fisheries Act
- continued to take decisive steps to conserve and restore Pacific salmon and their ecosystems across B.C. and the Yukon, in collaboration with First Nations and other partners, for example through the signing of the Trilateral Accord to Address the Decline of Wild Pacific Salmon
For more information on Fisheries and Oceans Canada’s Fisheries core responsibility read the ‘Results – what we achieved” section of its departmental results report.
Core responsibility 2: Aquatic Ecosystems
Actual spending: $650,678,379
Actual full-time equivalent staff: 1,997
- took steps to identify areas of improvement in its regulatory process as directed by the Cabinet Directive on Regulatory and Permitting Efficiency for Clean Growth Projects to ensure clarity for project proponents, including for nation-building projects
- advanced the use of artificial intelligence (AI) and machine learning across several areas of scientific research, for example, to improve predictive ocean models
- continued to work in partnership with Indigenous groups on the establishment of large-scale, distinctions-based, Indigenous-led conservation initiatives supported through the innovative Project Finance for Permanence initiative
- built on its previous work to conserve 30 per cent of Canada’s oceans by 2030 by continuing its collaborative work on establishing new marine protected areas and areas recognized as other effective area-based conservation measures, as well as maintaining and renewing existing ones
For more information on Fisheries and Oceans Canada’s Aquatic Ecosystems core responsibility read the ‘Results – what we achieved” section of its departmental results report.
Core responsibility 3: Marine Navigation
Actual spending: $341,970,776
Actual full-time equivalent staff: 1,713
- advanced the Department’s digital transformation agenda by leveraging innovative technologies to modernize chart production and enhance navigational safety, for example by expanding the use of virtual Automatic Identification System (AIS) aids to navigation for whale and vessel monitoring, while supporting Canadian sovereignty
- through the departmental Arctic Region offices, collaborated with Inuit organizations on the best ways to implement and deliver programs in the north
For more information on Fisheries and Oceans Canada’s Marine Navigation core responsibility read the ‘Results – what we achieved” section of its departmental results report.
Core responsibility 4: Marine Operations and Response
Actual spending: $2,371,659,831
Actual full-time equivalent staff: 4,715
- to secure Canada’s Arctic, awarded two build contracts to Vancouver Shipyards and Chantier Davie to each build a Polar Icebreaker
- continued to expand work under the Oceans Protection Plan, including expanding Canada’s marine emergency prevention, preparedness, and response approaches
- worked to empower Indigenous coastal communities' ability to protect culturally important and sensitive sites through funding support under the Coastal Marine Response Network and Integrated Marine Response Planning
For more information on Fisheries and Oceans Canada’s Marine Operations and Response core responsibility read the ‘Results – what we achieved” section of its departmental results report.
Key risks
In 2024–25, Fisheries and Oceans Canada (DFO) took proactive steps to manage key risks that could affect its ability to serve Canadians. To mitigate the risk of declining global market competitiveness, DFO promoted sustainable Canadian seafood at international events and launched tools to monitor trade trends, reducing the potential impact of lost market share and strengthening Canada’s reputational standing. The Department also responded to the risk of non-compliance with international certification standards by introducing electronic logbooks in key fisheries and improving real-time data collection.
DFO continued to advance reconciliation by working closely with Indigenous communities on conservation and science initiatives, including collaborative salmon restoration projects in British Columbia and Yukon, helping to foster trust, strengthen relationships, and support inclusive approaches to environmental stewardship. To manage financial and operational pressures, the Department prioritized essential scientific work and upgraded data systems, to support better decision-making. The Canadian Coast Guard advanced fleet renewal projects and continued to upgrade existing vessels to maintain essential services across Canada’s vast waters.
From the Minister

On behalf of Fisheries and Oceans Canada and the Canadian Coast Guard, I am pleased to present the 2024-25 Departmental Results Report, which highlights some of our achievements over the last fiscal year.
As a lifelong resident of Newfoundland and Labrador, I know how important our oceans and freshwater are to Canadians from coast to coast to coast. Since taking on this role, I’ve been meeting with stakeholders across the country to learn about the challenges and opportunities people are facing, and discuss various ways that our government can help.
While my focus is forward-looking, I’m proud of the tremendous work that was accomplished last year. For example, working with our many partners, the Department continued to make progress in growing Canada’s fish and seafood sector; conserving and protecting aquatic species and habitat; keeping mariners safe; ensuring our waterways were accessible and navigable; and leveraging science, technology and innovation to further transform and modernize our blue economy.
Underpinning all of this work are several guiding principles, including:
- Ongoing and meaningful reconciliation with Indigenous Peoples. This is achieved through implementation of the United Nations Declaration on the Rights of Indigenous Peoples Act; fostering a collaborative approach to managing fisheries and oceans; improving fishing access and training for Indigenous communities; and collaborating with Indigenous partners in the Coast Guard’s operations on the water. The Department also continued to consider Indigenous knowledge to inform its decisions, most notably around fisheries management.
- Working in partnership for the protection and sustainable use of Canada’s oceans, freshwater and aquatic resources, which includes Indigenous-led conservation efforts. This involved working closely with, and learning from, other federal departments, provincial and territorial governments, Indigenous leaders, industry, coastal communities, environmental organizations, academia and many others.
- Prioritizing science, research and data collection as the foundation of our policy development, programming and evidence-based decision-making.
- Adhering to sound financial management and accountability to ensure the optimal use of taxpayers’ dollars. This included investing in partnerships, programs, infrastructure, technology and innovation in ways that were fiscally prudent and closely aligned with the Department’s strategic priorities and the government’s goals.
- Promoting employee wellness and well-being across the organization. Mental health and workplace wellness are important factors to ensuring the health, safety and well-being of employees at Fisheries and Oceans Canada and the Canadian Coast Guard. We continued to develop and implement practices and initiatives that promoted a culture of workplace safety, inclusion and respect.
As Minister, I am proud of the extraordinary public servants who, in their ongoing service to Canadians, contributed to economic prosperity in coastal, rural and Indigenous communities; ensured Canada’s oceans and freshwater remain healthy and bountiful for current and future generations; protected mariners and the marine environment; made our waterways safer and more navigable; and positioned Canada as a world leader among the global ocean community.
I invite all Canadians to review this report to learn more about our achievements and contributions over the last year.
The Honourable Joanne Thompson, P.C., M.P.
Minister of Fisheries
Results – what we achieved
Core responsibilities and internal services
Core responsibility 1: Fisheries
Description
Manage Canada’s fisheries, Indigenous fisheries programs, aquaculture activities, and support commercial fishing harbours while applying relevant legislation.
Quality of life impacts
Canada’s Quality of Life Framework contains five domains, which were selected based on evidence of the determinants of well-being to reflect what matters most for quality of life in Canada.
One example of the Department’s work to improve the quality of life in Canada is in the domain of Prosperity. Work under the Fisheries core responsibility supports a sustainable and innovative marine industry, Indigenous participation in the marine economy, and management of a national network of core small craft harbours. These efforts contribute to the subdomain of income and growth related to the quality of life indicators of “gross domestic product (GDP) per capita” and “firm dynamism.” These activities also improve the quality of life in Canada in the domain of the Environment. The Department considers climate change and environmental conditions in the management of small craft harbours, fisheries, and aquaculture, thereby contributing to the subdomain of ecological integrity and environmental stewardship as it relates to marine and coastal ecosystems.
Progress on resultsFootnote1
This section details the Department’s performance against its targets for each departmental result under core responsibility 1: Fisheries.
Table 1: Canadian fisheries are sustainably managedFootnote2
Table 1 shows the target, the date to achieve the target and the actual result for each indicator under “Canadian fisheries are sustainably managed” in the last three fiscal years.
| Departmental result indicatorsFootnote3 | Target | Date to achieve target | Actual results |
|---|---|---|---|
| Percentage of key fish stocks that have limit reference points and harvest control rulesFootnote4 | At least 52% | March 31, 2025 | 2022–23: 44% 2023–24: 45% 2024–25: 45% |
| Percentage of decisions for fisheries on key fish stocks where harvest control rules were followedFootnote5 | Exactly 100% | March 31, 2025 | 2022–23: 98% 2023–24: 97% 2024–25: 98% |
| Percentage of key fish stocks in the cautious and healthy zoneFootnote6 | At least 55% | March 31, 2026 | 2022–23: 48% 2023–24: 46% 2024–25: 47% |
Table 2: Canadian aquaculture is sustainably managed
Table 2 shows the target, the date to achieve the target and the actual result for each indicator under “Canadian aquaculture is sustainably managed” in the last three fiscal years.
| Departmental result indicators | Target | Date to achieve target | Actual results |
|---|---|---|---|
| Percentage of aquaculture farms that are compliant with the Fisheries Act regulations | At least 90% | March 31, 2025 | 2022–23: 96% 2023–24: 100% 2024–25: 100% |
| Level of Canadian aquaculture productionFootnote7 | At least 170,000 tonnes | December 31, 2024 | 2022–23: 191,249 tonnes 2023–24: 166,265 tonnes 2024–25: 145,985 tonnes |
Table 3: The commercial fishing industry has access to safe harbours
Table 3 shows the target, the date to achieve the target and the actual result for each indicator under “the commercial fishing industry has access to safe harbours” in the last three fiscal years.
| Departmental result indicators | Target | Date to achieve target | Actual results |
|---|---|---|---|
| Percentage of core harbours that are in fair or better condition | At least 87% | March 31, 2025 | 2022–23: 90% 2023–24: 89% 2024–25: 88.5%Footnote8 |
Table 4: Fisheries, oceans and other aquatic ecosystems are protected from unlawful exploitation and interference
Table 4 shows the target, the date to achieve the target and the actual result for each indicator under “fisheries, oceans and other aquatic ecosystems are protected from unlawful exploitation and interference” in the last three fiscal years.
| Departmental result indicators | Target | Date to achieve target | Actual results |
|---|---|---|---|
| Percentage of inspection activities that have resulted in compliance actionsFootnote9 | At most 60% | March 31, 2025 | 2022–23: 60% 2023–24: 63% 2024–25: 68.7% |
Table 5: Scientific information on fisheries resources is available to inform management decisions
Table 5 shows the target, the date to achieve the target and the actual result for each indicator under “scientific information on fisheries resources is available to inform management decisions” in the last three fiscal years.
| Departmental result indicators | Target | Date to achieve target | Actual results |
|---|---|---|---|
| Percentage of approved requests to the Canadian Science Advisory Secretariat (CSAS) for peer-reviewed science advice on fisheries completed each year | At least 90% | March 31, 2025 | 2022–23: 82%Footnote10 2023–24: 95%Footnote11 2024–25: 90% |
| Percentage of sustainable aquaculture research projects which provide information and/or advice to policy and decision-makersFootnote12 | At least 90% | March 31, 2025 | 2022–23: 79%Footnote13 2023–24: 100% 2024–25: 100% |
Table 6: Enhanced relationships with, involvement of, and outcomes for Indigenous people
Table 6 shows the target, the date to achieve the target and the actual result for each indicator under “enhanced relationships with, involvement of, and outcomes for Indigenous people” in the last three fiscal years.
| Departmental result indicators | Target | Date to achieve target | Actual results |
|---|---|---|---|
| Number of agreements / arrangements involving Indigenous groups | At least 491 | March 31, 2025 | 2022–23: 517 2023–24: 701 2024–25: 677 |
| Number of Indigenous people trained through agreements / arrangementsFootnote14 | At least 646 | March 31, 2025 | 2022–23: 1,310 2023–24: 1,924 2024–25: 1,218 |
| Number of Indigenous people employed through agreements / arrangementsFootnote15 | At least 5,024 | March 31, 2025 | 2022–23: 5,369 2023–24: 5,991 2024–25: 5,587 |
The Results section of the Infographic for Fisheries and Oceans Canada on GC Infobase page provides additional information on results and performance related to its program inventory.
Details on results
The following section describes the results for Fisheries in 2024–25 compared with the planned results set out in Fisheries and Oceans Canada’s Departmental Plan for the year.
Fisheries play a vital role in Canada’s economy and coastal communities. DFO helps build a strong Canadian blue economy by ensuring that fisheries, aquaculture, and the seafood industry are well-managed, informed by science, and supported by safe harbours. The Department contributes to building a united Canada by ensuring that the rights of Indigenous Peoples are respected and Indigenous interests are supported (including enhanced access in recognition of rights). Internationally, DFO collaborates with reliable trading partners and allies to diversify markets, promote the sustainable management of fisheries, and combat illegal, unreported, and unregulated fishing, a major contributor to declining fish stocks and the destruction of marine habitats. On top of these ongoing responsibilities, the following are some of the results the Department achieved for Canadians in 2024-25.
Canadian fisheries are sustainably managed
Results achieved
A prosperous and sustainable blue economy
Canada’s blue economy is an important part of how we will build the strongest economy in the G7. As part of its commitment to unlocking the strength and opportunity associated with Canada’s ocean economy, the Department worked with partner departments to publish the Blue Economy Regulatory Roadmap, which is designed to address regulatory and operational challenges and explore innovative approaches to seize emerging opportunities within the blue economy. Development of the roadmap was informed by consultations on how regulation affects ocean innovation, barriers to environmentally sustainable growth, and ways to develop agile regulations to address concerns of future-oriented ocean industries. The roadmap focuses on five main areas (marine renewable energy and environmental protection, marine spatial planning, maritime autonomous surface ships, ocean technology, and sustainable fishing gear and practices), and outlines actions the Government of Canada will take to support innovation and economic growth in Canada’s oceans. These actions will enhance the ability of communities and businesses that rely on the ocean economy to grow responsibly, resulting in benefits for all Canadians.
Canada’s fisheries are the backbone of many coastal and inland communities and a driving force of the economy. In 2024-25, the Department continued to support sustainable, prosperous fisheries and coastal communities through initiatives such as the following:
- after careful monitoring of an exploratory fishery for economic and biological sustainability, launching a new commercial whelk fishery in Nova Scotia - a prime example of how Canadian fish harvesters are at the forefront of innovation in their industry, developing new products and cultivating new markets
- working with First Nation partners to build, expand, or modernize hatcheries that incubate, rear and release Pacific salmon in order to provide harvest opportunities, create jobs, and restore their populations to a sustainable level for future generations
- opening an Atlantic mackerel bait fishery to help harvesters supply their other fisheries with bait without jeopardizing the ongoing rebuilding of the Atlantic mackerel stock
- implementing a limited pilot seal hunt in Eastern New Brunswick and Prince Edward Island and expanding the eligibility criteria for personal-use seal licences under the Marine Mammal Regulations
- for striped bass, an important source of food and socio-economic benefits to Indigenous and coastal communities, increasing the allocation to communal commercial fisheries in Indigenous communities and launching a pilot project that allows a small group of lobster harvesters to retain a limited amount of striped bass by-catch for personal use, including for use as bait, while collecting key data on this stock
- ending the Northern cod moratorium off the north and east coasts of Newfoundland and Labrador
- supporting increased capacity in Arctic communities to pursue commercial and redistributive fisheries activities through the Northern Integrated Commercial Fisheries Initiative (for example, by providing funding to upgrade fish processing equipment and implement a floating barge system to more efficiently bring products to market)
- supporting the development of northern fisheries economies through ongoing investment in northern harbours, such as those of Clyde River and Arctic Bay, Nunavut
The Department implemented the Possession and Export of Elvers Regulations (the Elvers Regulations) to support a safe and orderly 2025 elver fishery. The Elvers Regulations require a licence to possess elver, subject to certain exceptions, and a licence to export elver. The Department also launched the Elver Monitoring and Traceability application, which is an electronic reporting platform that collects reporting data from fishing and possession licence holders to track the movement of elvers from harvest to export. Finally, to support rights-based fishing in pursuit of a moderate livelihood, 50% of the total allowable catch (TAC) was redistributed to First Nations entering the fishery.
Wild Pacific salmon are a symbol of Canadian identity, socio-economically important for rural and coastal communities on the West Coast, and are an integral part of marine and terrestrial ecosystems. First Nations have strong cultural and spiritual ties with Pacific salmon. Through the Pacific Salmon Strategy Initiative (PSSI), the Department continued to take decisive steps to conserve and restore Pacific salmon and their ecosystems across B.C. and Yukon, in collaboration with First Nations and other partners. For example, DFO, the First Nations Fisheries Council of BC, and B.C.’s Ministry of Water, Land and Resource Stewardship signed the Trilateral Accord to Address the Decline of Wild Pacific Salmon, a transformative step that will help the signing partners develop long-term, comprehensive approaches and align resources to address the decline of wild Pacific salmon in a coordinated manner. Jointly-developed areas of focus include climate adaptation, ecosystem monitoring, habitat restoration, recovery or rebuilding plans, and watershed security. The signing of the Trilateral Salmon Accord demonstrates how PSSI is advancing collaborative conservation and restoration of wild salmon with First Nations in BC. The Accord is an important milestone in DFO’s commitment under the federal United Nations Declaration on the Rights of Indigenous Peoples Act (UNDA) Action Plan Measure 41, which relates specifically to collaborative implementation of the PSSI.
Atlantic salmon have also long been an integral part of Canada’s history and identity, and DFO remains committed to maintaining and restoring the species through management and conservation decisions that reflect the strong connections people have with salmon. In March 2025, the Government of Canada announced Canada’s national strategy to ensure the future of Atlantic salmon (2024-2036). Development of the strategy was informed by engagements with Indigenous organizations, provincial governments, and stakeholders. Four strategic outcomes have been identified to guide the future of Atlantic salmon activities for the next twelve years: collaborative place-based approaches to stewardship to ensure healthy, climate-resilient ecosystems that can support Atlantic salmon; Atlantic salmon-related processes and policies are aligned with the UNDA and its Action Plan; a vibrant, inclusive and knowledgeable Atlantic salmon community is positioned for success; and practices that support the management and protection of Atlantic salmon are transparent, well-informed, and responsive to the needs of salmon in a rapidly changing world.
DFO continued to implement the Fish Stocks provisions (FSP) of the modernized Fisheries Act, which require the Minister to put in place management measures to maintain prescribed major fish stocks at levels necessary to promote sustainability, or to develop and implement rebuilding plans if they become depleted. There are currently 30 fish stocks subject to the FSP, 15 of which require rebuilding plans. In 2024-25, twelve of the 15 rebuilding plans were approved, and development of the remaining three continued (these are due in 2025-26). DFO also worked to add a second, larger batch of stocks to the list of those subject to the FSP by prescribing these additional stocks in regulation. DFO is targeting 2025-26 for this regulation to come into effect. Preventing the decline of stocks and working to maintain or rebuild stocks to healthy levels by managing them sustainably preserves important ecosystem functions and improves economic outcomes for the fish and seafood sector in Canada. Because healthy fish stocks are necessary for fisheries to continue to provide economic and social benefits to Canadians, including livelihoods in remote Canadian communities, DFO is prioritizing prescribing stocks that are, or were previously, economically important, as well as some stocks that are important for cultural or ecosystem reasons.
The FSP require the consideration of environmental conditions in the development of management measures and rebuilding plans for prescribed stocks. In 2024-2025, DFO continued its efforts to advance an ecosystem approach to fisheries management that enabled the consideration of ecosystem information (e.g. temperature, oxygenation) in fisheries science advice and management recommendations to strengthen DFO’s fisheries management framework and promote sustainable fisheries.
As part of its work to modernize to operate more efficiently and deliver better results for Canadians, the Department continued work on the new cloud-based Canadian Fisheries Information System, which will consolidate and modernize more than 60 aging licensing, catch and effort, and quota monitoring systems. This work will improve access to data that is vital to the sustainable management of Canada’s fisheries.
For example, DFO significantly enhanced its digital capabilities and efficiency by implementing the mandatory use of Electronic logbooks (ELOG) for selected major fisheries on the East Coast. Harvesters in these fisheries must use the application to submit required data to comply with licence conditions. The goal of this change is to drastically reduce processing time while improving reporting capabilities. Additionally, the Department worked to develop new ELOG reporting capabilities to enable DFO staff to identify trends and make more timely decisions regarding commercial fisheries.
The fish and seafood sector has been undergoing rapid change, with new and innovative technologies being adopted to improve efficiency, seafood quality, and sustainability. DFO worked to strengthen trade and the Canadian economy by continuing to support innovation, sustainability, and the ability to meet the growing demands of a worldwide market in this important sector of the economy through the delivery of three funds that are cost-shared with the provinces: the Atlantic Fisheries Fund (AFF), the British Columbia Salmon Restoration and Innovation Fund (BCSRIF), and the Quebec Fisheries Fund (QFF). By supporting initiatives such as the examples below, these funds helped the Canadian fish and seafood sector transition to meet growing market demands, both at home and abroad, for products that are high quality, value-added, and sustainably sourced. The following are some examples of the initiatives these funds supported in 2024-25 to contribute to a strong, diversified Canadian economy that creates high-quality products and to positioning the Canadian fish and seafood sector as a global leader in innovation and sustainable production.
- BCSRIF supported the development of innovative shellfish handling technologies, environmental habitat restoration technologies, and capacity for a long-term brood stock selection program
- AFF supported work to identify mitigation strategies to address the Multinucleate Sphere Unknown X (MSX) disease and its impact on the oyster industry in Atlantic Canada
- QFF supported the acquisition of equipment to enable the production of innovative seafood sausages and to improve the efficiency of companies taking part in the redfish fishery
The Freshwater Fish Marketing Corporation (FFMC) is a federal crown corporation established in 1969 under the Freshwater Fish Marketing Act to market and trade freshwater fish in interprovincial and export markets. It is a critical market access point for fish harvesters who live in isolated communities. In 2011, Ontario withdrew from the Act in favour of an open market, followed by Saskatchewan in 2012, and Manitoba in 2017. In 2014, Alberta closed its commercial inland fishery. Following these significant changes to the FFMC’s operating environment and extensive engagement with harvesters and other stakeholders, the Government of Canada launched a two-step competitive process to transform the FFMC to help ensure it remains competitive in today’s open market and continues to meet the needs of commercial fish harvesters into the future. The first step was a solicitation of expressions of interest, followed by a request for proposals that launched on December 5, 2024. Among other considerations, bidding criteria were developed to promote continued market access for rural, remote, and isolated harvesters, and to promote economic reconciliation.
As part of its work to support collaboration with reliable trading partners and the Canadian fish and seafood sector’s access to international markets, DFO attended Seafood Expo North America, the largest trade exposition of its kind in North America. The Seafood Expo provided a global platform to promote Canada’s high-quality, sustainably sourced fish and seafood products.
To ensure sustainably managed fisheries and provide economic opportunities to Canadian harvesters, the Department has been active in the seven regional fisheries management organizations to which Canada is a party. The Department’s presence in these international organizations plays an important role to ensure the sustainability of shared stocks and maintain allocations of key species harvested by Canadian harvesters in Canadian and international waters. For example, in 2024 at the International Commission for the Conservation of Atlantic Tunas, DFO led the development of a new management procedure for North Atlantic swordfish and negotiated a 39% increase of the Canadian allocation. At the Northwest Atlantic Fisheries Organization (NAFO), the Department successfully negotiated management measures for the high-seas portion of the Canadian Northern cod stock that mirror Canada’s domestic management, thereby reinforcing Canada’s predominant role in managing this historically and culturally important stock, while also maintaining Canadian shares in NAFO-managed fisheries in the high seas.
Also in 2024-25, the Government of Canada announced new maternity and parental leave for fish harvesters in Atlantic Canada. Holders of fishing licences are now able to request that a substitute run their fishing business while they are either pregnant or new parents so that they can continue to earn a living while taking care of their young ones.
Through the Ghost Gear Program, DFO continued to demonstrate Canada’s leadership in addressing the issue of abandoned, lost, or discarded fishing gear, which is a major risk to our oceans, including endangered species such as North Atlantic Right Whales. For example, in February 2025, Canada hosted the second International Fishing Gear Innovation Summit, which brought together global experts, including Indigenous and non-Indigenous harvesters, to address fishing-gear loss and whale interactions through innovative solutions that support sustainable and prosperous fisheries and communities.
The Department also continued to protect endangered whales through the Whales Initiative. For example, for 2024-25, DFO continued comprehensive aerial and acoustic surveillance for North Atlantic right whales and implemented adaptive area closures to fisheries where and when they were detected to reduce entanglements. DFO also continued to work with the fishing industry and others to test innovative whalesafe fishing gear designed to prevent or reduce the severity of entanglements. In 2024-25, DFO shared its proposed five-year Whalesafe Gear Strategy with external partners and stakeholders, and expects to publish the Strategy in 2025-26.
As part of the Government of Canada’s commitment to longer-term protection for Southern Resident killer whales, DFO continued to work with Indigenous groups and stakeholders through national consultations on potential amendments to the Marine Mammal Regulations to consider adjustments to Pacific killer whale approach distances. The Department published a ‘What We Heard Report’ in 2024 25.
Measures such as adaptive fishing closures where necessary, innovative monitoring of whales and ocean noise using drone technology and AI, and support for the Marine Mammal Response Program helped DFO not only fulfill the Department’s role in addressing marine mammals in distress, but also demonstrate the sustainability of Canadian fisheries to seafood markets.
Canadian aquaculture is sustainably managed
Results achieved
Aquaculture plays an important role in Canada’s economy and food security and delivers significant socio-economic benefits, including well-paying, full-time jobs in rural and coastal communities. The federal government, provincial governments, and industry all play an active role in the responsible and sustainable management of aquaculture. DFO manages aquaculture activities to contribute to an environmentally, economically, and socially sustainable, science-based Canadian aquaculture sector.
Following the release of a Policy Statement on the future of open net-pen salmon farming in British Columbia in June 2024, DFO, along with Innovation, Science and Economic Development Canada, developed and published a draft Salmon Aquaculture Transition Plan for British Columbia in September 2024. The draft Plan provided a basis for engagement, resulting in over 110 meetings and roundtables with coastal communities, stakeholders, and First Nations. Work is underway on the next steps.
In 2024-25, the Government supported important ongoing work at international forums related to sustainable aquaculture, strengthening our collaboration with reliable trading partners and allies around the world, and enhancing our international partnerships. This work included efforts to increase the focus on aquaculture at the Organization for Economic Cooperation and Development (OECD)’s Committee on Fisheries, as well as Canada’s continued participation as a long-standing member of the Food and Agriculture Organization of the United Nations (FAO) Sub-committee on Aquaculture. Key focuses include supporting work on climate change resilience and adaptation in aquaculture, the circular economy, promoting sustainable approaches to aquaculture, and supporting the adoption of the FAO’s Guidelines for Sustainable Aquaculture.
The Department recently collaborated with provincial partners, the Standards Council of Canada (SCC), and a marine aquaculture engineering expert to review both international and domestic requirements and best practices in marine salmonid containment systems. The comprehensive report identified gaps in the current Canadian framework and recommends the development of a national marine salmonid containment standard. DFO continues to work with provinces and SCC to determine next steps.
In 2024-25, the Canadian Food Inspection Agency (CFIA) confirmed the presence of two oyster diseases on the East Coast: Multinucleate Sphere Unknown X (MSX) and Dermo. While MSX and Dermo are not food safety concerns, they pose serious threats to Canada’s oyster industry (both farmed and wild). DFO continued to regulate oyster movements within each province through the Introductions and Transfers program, in collaboration with provincial partners and in consultation with the CFIA. This helped prevent the potential spread of MSX and Dermo to areas where the diseases haven't been detected. The coordinated response and actions also helped ensure national consistency in disease management practices across the affected provinces.
The commercial fishing industry has access to safe harbours
Results achieved
As part of its work to support the sustainable growth of the Canadian economy, DFO operates and maintains (including repairing, replacing, and dredging) a national network of harbours that are not only critical to the success of the commercial fishing industry, but also support businesses involved in many other aspects of the blue economy, including fish processing, transportation, commercial recreational operations, aquaculture, and tourism. Through Budget 2021, DFO invested $300 million to build the Canadian economy by repairing, renewing, and replacing small craft harbours. By the end of 2024-25, 218 of the 228 projects planned under this investment had been completed. Examples of this work include the reconstruction and raising of the main wharf structure at Centreville (Trout Cove), Nova Scotia to ensure climate resiliency, reconstruction of retaining structures and upgrades to two wharves at Port Edward Harbour in British Columbia, and the demolition and removal of a degraded wharf and pier at Harbour Grace, Newfoundland and Labrador, followed by the construction of a new timber crib wharf.
Budget 2024 invested $463.3 million over three years in the repair and maintenance of small craft harbours across Canada. The fishing industry is central to many coastal communities across Canada, and harvesters need small craft harbours to be safe and reliable. With climate change causing more extreme weather events, it is critical to invest in infrastructure that is more resilient and, above all else, safe for harbour users. Examples of this important work can be found in these announcements of investments in small craft harbours in British Columbia, New Brunswick, Newfoundland and Labrador, Nova Scotia, Prince Edward Island, and Quebec.
DFO worked to ensure that modifications to small craft harbour assets, such as wharves and breakwaters, appropriately take into consideration the impacts of climate change and are designed and built using the best climate-resilience information available. In 2024–25, DFO advanced critical infrastructure repairs at Richibucto Harbour, New Brunswick, in response to damage from Hurricane Fiona in 2022. Through this $7.1 million major capital project, DFO is replacing aging harbour structures with modern, climate-resilient infrastructure designed to withstand rising sea levels and more frequent severe weather. These improvements will help ensure the harbour remains safe, functional, and accessible for local fish harvesters and coastal communities. The project also supports reconciliation by prioritizing contracts with Indigenous-owned businesses, fostering economic opportunities, and strengthening partnerships with Indigenous communities.
The Government of Canada also announced an investment in the construction of a small craft harbour in Arctic Bay, Nunavut. This five-year project (2025-26 to 2030-31) will build essential infrastructure such as a breakwater, fixed wharf, and float wharves. By delivering important socio-economic benefits, this investment will meaningfully contribute to the Government’s commitments to achieve equity and promote reconciliation between Inuit and all Canadians. Additionally, the presence of the proposed harbour infrastructure in Arctic Bay is a direct asset to support the operations of other departments and agencies with northern activities, such as the Canadian Rangers, by acting as a possible staging point for activities, a re-supply base, and a source of refuge in bad weather. By contributing to Canada’s activity and presence in the North through enhanced opportunities for northern communities, this investment will strengthen Canada’s exercise of sovereignty in the Arctic.
Fisheries, oceans and other aquatic ecosystems are protected from unlawful exploitation and interference
Results achieved
DFO recognizes the global challenge of illegal, unreported and unregulated (IUU) fishing, and is committed to working with partners to combat these harmful activities, which can threaten the sustainability of Canadian stocks and the livelihoods of legitimate fish harvesters. IUU fishing also damages the world’s marine resources and undermines efforts to conserve and protect marine ecosystems and biodiversity. The Department continued to combat IUU fishing globally through increased engagement in the Pacific as part of Canada’s Indo-Pacific Strategy under the Shared Ocean Fund. A three-pronged approach was developed to focus efforts: strengthening international governance, improving and leveraging Canada’s enforcement capabilities and expertise, and building international partnerships through capacity-building efforts.
The following are some examples of the Department’s work in 2024-25 to improve global fisheries governance by providing leadership at regional fisheries management organizations:
- to protect Canada’s Pacific salmon that are at risk of being intercepted in international waters, Canada successfully championed an enforceable ban on the retention of salmon and steelhead trout species on board vessels in the north Pacific Ocean
- to increase the oversight of transshipments (the transfer of fish or other goods at sea), which are often used to launder illegally caught fish, Canada helped usher through the adoption of a transshipment observer program by the North Pacific Fisheries Commission
To help enforce these measures, DFO fishery officers and CCG personnel carried out the second Canadian-led high seas mission to detect and deter IUU fishing in the North Pacific under Operation North Pacific Guard. While at sea, fishery officers conducted lawful inspections of 15 fishing vessels and found illegally harvested shark fins, evidence of unreported catch and fishing during a closed season, documented instances of marine pollution, as well as a number of vessels with their monitoring systems switched off (commonly referred to as “dark vessels”). Canada also collaborated with Japan and South Korea to conduct daily aerial surveillance patrols. During these patrols, officers reported shark finning, the targeted harvest of dolphins, pollution incidents, and vessel-marking violations. Canada is now working with the appropriate flag states to support further investigations and sanctions on offending vessels. This year’s mission included the first use of a blend of renewable diesel, biodiesel, and conventional diesel, marking a significant step toward a greener, low-carbon CCG fleet.
As part of the government’s work to strengthen collaboration with reliable trading partners and allies around the world, DFO continued to build international partnerships through capacity-building efforts. One example was the continued provision of Canada’s innovative Dark Vessels Detection (DVD) platform to partners such as the Philippines and 15 small Pacific Island Countries (PICs). Canada’s DVD platform supports the space-based monitoring of the Indo-Pacific region’s offshore fisheries resources in support of collaborative efforts to ensure protection of marine ecosystem health and sustainability for the many PICs which rely on these resources for food security, employment, and national revenues.
DFO chairs the Illegal, Unreported, and Unregulated Fishing Action Alliance, the only forum that draws actors across the public and private sectors to combat IUU fishing. It offers an opportunity to share one voice at international forums and better work together to eliminate the harmful effects that IUU fishing has on the ocean, vulnerable communities, and the rule of law around the world.
As part of its work to reinforce law enforcement, the Department also worked to ensure that fishery officers have the equipment and tools they need to protect marine biodiversity and enforce the Fisheries Act. For example, DFO took delivery of two 44-foot patrol vessels that will increase the capacity of fishery officers to monitor compliance with the Fisheries Act; retrieve more abandoned, lost, or discarded fishing gear; and monitor endangered whales and other species of concern. They will also support officer safety, as these vessels are capable of operating in adverse weather conditions.
Scientific information on fisheries resources is available to inform management decisions
Results achieved
As mentioned above, in 2024-25, the presence of two oyster diseases were confirmed on the East Coast: MSX and Dermo. Neither disease is a human health or food safety concern, but both pose a serious threat to the east coast’s oyster industry. Canada’s response to the outbreaks was led by the National Aquatic Animal Health Program, which is co-delivered by the Canadian Food Inspection Agency and DFO. In 2024–25, DFO’s aquatic animal health laboratories provided more than 13,000 diagnostic tests to inform the regulatory decisions in support of the disease response. In addition, DFO and the Province of Prince Edward Island co-chaired an MSX Science Summit in November 2024 that identified key areas for future research. In March 2025, DFO announced funding to support a range of research areas related to MSX, such as rapid detection and disease resistance.
The Department provided nearly $1.5 million in funding to support research into the potential effects of diluted bitumen on adult migrating sockeye salmon, focusing on reproductive success and the survival of their offspring. Pacific salmon, which play an enormous cultural, economic, and environmental role, have complex life cycles which include migrating between freshwater and marine environments. This project will actively engage Indigenous communities, while underscoring our shared commitment to protecting Pacific salmon, their habitat, and the broader ecosystem, cultures, and livelihoods that depend on them. The findings from this study will deepen our understanding of how exposure to diluted bitumen may impact Pacific salmon, and will further strengthen Canada’s oil spill prevention and response planning capacity.
DFO used artificial intelligence (AI) to help to more precisely monitor aquatic species, supporting sustainable resource management and conservation efforts.
The Whale Acoustic Slocum Glider Program, which has been using ocean gliders equipped with acoustic detection capabilities to monitor North Atlantic right whales in near real time, reached a milestone in 2024 with detections that met the confidence level of ‘definite’, meaning that the detections can now be used to implement fisheries management measures to help protect this endangered species.
DFO continued to prioritize science and research to study the impacts of climate change on fisheries, ecosystems, and coastal infrastructure. In 2024-25, nine projects were funded to address these issues. These projects largely focused on the vulnerabilities of commercially and ecologically important species, infrastructure (e.g. harbours), and industries (e.g. fisheries and aquaculture) to climate change. Additional climate change adaptation tools were also developed or updated, including a tool for coastal infrastructure planning and an assessment of climate risk due to both surface and bottom warming in the ocean for species of commercial and conservation interest across Canada. This research provides both decision makers and Canadians with the information they need to plan and adapt to a changing climate.
In 2024-25, DFO continued to advance an ecosystem approach to fisheries management (EAFM) that will enable consideration of ecosystem information in fisheries science advice, including by publishing an EAFM Science Methods Toolbox to support researchers and stock assessment teams.
To facilitate timely provision of science advice, the Department implemented the Fisheries Science Advisory Report (FSAR), a streamlined and concise document that provides peer-reviewed scientific information on fish stock status and trends. In 2024-25, DFO completed 43 peer-review processes that used the FSAR. DFO also continued to provide links to publicly-available data to connect external stakeholders and the general public to source information.
Enhanced relationships with, involvement of, and outcomes for Indigenous people
Results achieved
The Department will continue its work to build a future of enhanced distinctions-based relationships with, involvement of, and outcomes for Indigenous Peoples, based on recognition of rights, respect, cooperation, and partnership.
In line with the recent Speech from the Throne, which emphasized the creation of long-term wealth and prosperity with Indigenous Peoples, the Department is advancing this commitment through the negotiation and implementation of modern treaties, reconciliation agreements and other fisheries-related agreements or arrangements that support prosperity, self-determination and reconciliation with Indigenous partners across the country.
Recognition and implementation of Aboriginal and treaty rights, including the right to fish for food, social, and ceremonial purposes and the right to fish in pursuit of a moderate livelihood, is an ongoing and incremental process. In 2024-25, the Department continued to work in partnership with Crown-Indigenous Relations and Northern Affairs Canada and Indigenous groups to chart the path forward to recognize and further implement Aboriginal and treaty rights and demonstrate that DFO remains committed to reaching agreements that address fisheries matters.
The following are some examples of this work:
- the Government of Canada and the Ahousaht, Ehattesaht/Chinekint, Hesquiaht, Mowachaht/Muchalaht and Tla-o-qui-aht Nations (the five Nations) signed an Incremental Reconciliation Agreement for Fisheries Resources, a two-year agreement that provides the framework for an effective and collaborative approach to governance, management, and planning of the five Nations' fisheries, as well as funding for implementation, capacity building and to obtain commercial fishing access, vessels, and gear
- DFO renewed eight Moderate Livelihood Fishing Plan understandings with 17 First Nations in Maritimes and Gulf Regions for the continued implementation of their right to fish in pursuit of a moderate livelihood. Among these First Nations, Wasoqopa’q, Bear River, Annapolis Valley, and Glooscap First Nations, saw their DFO interim lobster moderate livelihood authorization renewed for a fourth consecutive year to allow their members to exercise their treaty right to fish in pursuit of a moderate livelihood during the commercial season
- in June 2024, Tŝilhqot’in Nation, the Government of Canada, and Province of British Columbia signed a five-year renewal of the Gwets’en Nilt’i Pathway Agreement, which committed the parties to bring “transformative change” to the lives of the Tŝilhqot’in people and communities and to making sustained progress on a number of priorities, including lands, water, and resources. Through this agreement, the Tŝilhqot’in Nation has taken significant strides, including in building world-class fisheries programs. The five-year extension demonstrates a commitment to continued progress
- the Aboriginal Fisheries Strategy (AFS) and Aboriginal Aquatic Resource and Oceans Management (AAROM) programs deepened co-development, co-design and co-delivery activities with Indigenous partner and welcomed five additional First Nations into the AFS program as part of the AFS new entrants process
- DFO concluded negotiations on the Self Government Agreement (SGA) with Musqueam Indian Band. The SGA provides Musqueam with innovative lawmaking authority on matters of fish and fish habitat on Musqueam lands. While these authorities are similar to ones found in other SGAs, Musqueam is unique because a portion of their Indian reserve lands extend into the foreshore
DFO's commitment to implementing the Action Plan for the Renewal and Expansion of DFO’s Indigenous Programs, through co-development, co-design, and co-delivery with Indigenous organizations and communities, is clearly demonstrated by the successful launch and significant uptake of the Community-Based Access Acquisition (CBAA) program. This initiative directly responds to the Action Plan's goal of strengthening DFO’s commercial and collaborative Indigenous programs and aligning them with Indigenous definitions of success. The CBAA, a new component of the existing Atlantic Integrated Commercial Fisheries Initiative (AICFI), empowers participating First Nations to obtain the fisheries access necessary to achieve their communities’ aspirations in pursuing their right to fish in pursuit of a moderate livelihood, fostering individualized, self-determined fisheries portfolios.
As part of meeting DFO’s commitments under the UNDA Action Plan, DFO continued to work with our partners on the Nunavut Fishery Regulations Working Group to advance the co-development of the Nunavut Fishery Regulations. An important component of this work is the ongoing conversations around exploring the concept of Communal Fish Plans. The Nunavut Fishery Regulations will support Inuit self-determination and help to advance Canada’s reconciliation efforts with Inuit. The co-development of the Policy intent for the Nunavut Fishery Regulations with Indigenous partners was a significant milestone in the development of the Regulations. This document summarizes the co-developed policy proposed by the Working Group and is intended to inform and support public consultation and elicit feedback to consider in finalizing the policy direction for the Regulations.
To support economic opportunities for the Qikiqtani Inuit, DFO and the Qikiqtani Inuit Association signed the Qikiqtani Fisheries Agreement in February 2025. The Agreement provides funding over the next 10 years to support both acquiring access to offshore commercial fisheries, vessels, and gear, and training to participate in offshore commercial fishing in adjacent waters.
In October 2024, the Department launched the Indigenous Fisheries Monitoring Fund. This funding supports Indigenous groups as they increase fisheries monitoring and catch reporting activities, which is crucial for maintaining sustainable fisheries. This funding will promote the sharing of best practices and fishery monitoring data to better inform decision-making for sustainable fisheries and demonstrate collaborative management of federally-regulated fish stocks and populations across Canada.
Pacific salmon are under threat due to climate change, habitat degradation and other pressures. Hatcheries, which incubate, rear and release Pacific salmon to live alongside their wild counterparts, are a key component in supporting and restoring these vulnerable populations. In 2024-25, DFO partnered with First Nations to build three Pacific salmon hatcheries and explore the development of a Yukon River salmon stewardship and restoration centre. DFO also provided funding to renew over 10 Indigenous-run hatchery facilities which support Pacific salmon and collaborative management.
In addition, DFO provided support to 31 new First Nations partnerships and collaborations to advance tangible, on-the-ground work in support of Pacific salmon recovery and rebuilding. Major infrastructure upgrades at 3 First Nations-operated hatcheries improved facility capacity for conservation enhancement, biosecurity, and climate change resiliency.
DFO launched the Bridging Indigenous and Science-Based Knowledge (BIAS-K) portal. BIAS-K highlights over 250 projects and case studies across Canada that bridge multiple ways of knowing. As a learning tool, BIAS-K helps to make key information accessible from published case studies and community-led projects. BIAS-K was developed with the vital collaboration of Indigenous Peoples and federal colleagues.
Through the Interdepartmental Indigenous Science, Technology, Engineering, and Mathematics (I-STEM) Cluster, DFO collaboratively developed and supported a successful proposal to the Council of Canadian Academies (CCA). The CCA will assess how Indigenous science can be supported to advance policy and governance in a way that achieves reciprocal benefits for all people in Canada. The report will examine approaches to including Indigenous science and leadership in decision-making.
The Department has advanced a number of initiatives linked to UNDA Action Plan Shared Priority 36 (SP36). This requires DFO to: “Pursue amendments and reforms to fisheries legislation, regulation, or policies to support self-determination and the meaningful implementation and exercise of Indigenous fishing rights, including Aboriginal and treaty rights.” Various fisheries policy projects led by DFO have either been completed or are underway to advance this Action Plan measure, including the Eastern Canada Communal Commercial Licensing Policy Review and the review of the 1993 Policy for the Management of Aboriginal Fishing (1993 Policy). In 2024-25, DFO completed its engagement with Indigenous communities and organizations that hold communal commercial licences in Eastern Canada to better understand their current realities, pressure points, challenges, and barriers related to communal commercial licensing. The feedback provided during these engagements directly informed the development of a draft policy on communal commercial licensing, which was shared with communal commercial licence holders in Eastern Canada in January 2025 for consultation. Additionally, early engagement and collaborative planning discussions were held with Indigenous partners to support a planned multi-year review of the 1993 Policy.
DFO continued to advance UNDA Action Plan Shared Priority 37 through the development and implementation of reconciliation agreements, including the ongoing implementation of the Coastal First Nations Fisheries Resources Reconciliation Agreement and the signing of a two-year Incremental Reconciliation Agreement for Fisheries Resources and associated implementation of the community-based economic fishery plan for the Five Nuu-chah-nulth Nations.
Budget 2024 announced two years of funding for the Canadian Shellfish Sanitation Program (CSSP) partners (which include the Canadian Food Inspection Agency, Environment and Climate Change Canada, and DFO) to assist Indigenous communities to safely access bivalve molluscan shellfish for food, social and ceremonial (FSC) purposes. In 2024-25, DFO initiated, coordinated and led engagement with Nations who had previously expressed interest in FSC harvest but where lack of monitoring by CSSP partners prevented access. These activities, and collaboration between the CFIA, ECCC, and the Nations, supported expanded harvest access, sharing of scientific and Traditional Knowledge, and strengthened relationships with Indigenous partners.
Resources required to achieve results
Table 7: Snapshot of resources required for Fisheries
Table 7 provides a summary of the planned and actual spending and full-time equivalents required to achieve results.
| Resource | Planned | Actual |
|---|---|---|
| Spending | $1,038,740,576 | $1,248,016,428 |
| Full-time equivalents | 3,658 | 3,882 |
The Finances section of the Infographic for Fisheries and Oceans Canada on GC Infobase page and the People section of the Infographic for Fisheries and Oceans Canada on GC Infobase page provide complete financial and human resources information related to its program inventory.
Related government-wide priorities
This section highlights government priorities that are being addressed through this core responsibility.
Gender-based Analysis Plus
The Department continued to use gender-based analysis plus (GBA Plus) to understand who is impacted by the issues or opportunities being addressed by the Department’s initiatives, identify how the initiative could be tailored to meet diverse needs of the people most impacted, and anticipate and mitigate any barriers to accessing or benefitting from the initiative.
United Nations 2030 Agenda for Sustainable Development and the Sustainable Development Goals
More information on DFO’s contributions to Canada’s Federal Implementation Plan on the 2030 Agenda and the Federal Sustainable Development Strategy can be found in our Departmental Sustainable Development Strategy.
Innovation
As part of the Pacific Salmon Strategy Initiative, DFO invested in innovative data and AI projects that address complex salmon data challenges, improve efficiency and productivity in business processes, and produce higher-quality, more accurate data that enables better insights and actions to protect and restore Pacific salmon and their ecosystems.
In 2024-25, DFO used drone technology for the inspection of small craft harbours. The drones were used to inspect difficult-to-reach areas such as under timber crib wharves, sheet pile walls, breakwaters and other hard to reach or access areas. In addition, the drones have been used to obtain aerial harbour images at a large cost savings. Overall, the use of drone technology has greatly increased the efficiency of conducting inspections and determining maintenance requirements at small craft harbours in several regions.
DFO continues to explore innovative approaches to leverage the vast amounts of data collected by the Department to support decision-making while improving the quality of results, realizing efficiencies, and reducing costs. For example, in 2024-25, DFO implemented an electronic monitoring pilot to investigate the potential of AI-assisted solutions for East Coast groundfish fisheries. These solutions aim to modernize the Electronic Monitoring Program by reducing the costs and time associated with monitoring fishing activities. These AI models can analyze video footage from onboard cameras to identify fish species, estimate catch sizes, and detect discard events, thereby providing evidence-based insights. While the AI assisted solutions require further refinement for broad implementation in East Coast fisheries, insights from the pilot program will inform further work in this domain, with the goal of promoting the sustainable use of fishery resources and reducing marine habitat destruction.
In 2024-25 the Department continued implementation of the Chinook mass-marking program at salmon hatcheries within British Columbia. Mass marking is a crucial tool used by hatchery managers, scientists, and technicians to assess salmon populations, manage enhancement to reduce genetic impacts, and support fishing opportunities. In 2024-25, the Department marked a total of 14.8 million Chinook salmon, an increase of 5.3 million fish from 2023-24 and a 60% increase in the total number of fish marked annually since 2022.
In 2024-2025, through the Indigenous Fisheries Monitoring Fund, the Department supported several projects aimed at piloting the use of innovative technologies (such as electronic monitoring and AI) to enhance monitoring of community-based and commercial Indigenous fisheries.
Funded through BCSRIF, the A-Tlegay Fisheries Society is undertaking assessment, design, construction, and operation of a tidal waters selective fishery salmon trap close to their traditional fishing sites in the Campbell-Quinsam rivers estuary on Vancouver Island. Historically, heart and chevron shaped traps were used extensively by First Nation communities along the estuary to capture adult salmon. Recent revitalization of fish traps as a terminal fishery in other areas along the coast has been successful in catching and selectively harvesting hatchery-marked salmon species while releasing wild (unmarked) salmon and steelhead. This innovative initiative is developing First Nations’ capacity for sustainable salmon stewardship through the development of selective harvest fishing methods in traditional fishing areas, while preserving wild stocks of conservation concern.
Program inventory
Fisheries is supported by the following programs:
- Fisheries Management
- Aboriginal Programs and Treaties
- Aquaculture Management
- Salmonid Enhancement
- International Engagement
- Small Craft Harbours
- Conservation and Protection
- Fish and Seafood Sector
- Aquatic Animal Health
- Biotechnology and Genomics
- Aquaculture Science
- Fisheries Science
- Economics and Statistics
Additional information related to the program inventory for Fisheries is available on the Results page on GC InfoBase.
Core responsibility 2: Aquatic Ecosystems
Description
Conserve and protect Canada’s oceans and other aquatic ecosystems and species from human impact and invasive species.
Quality of life impacts
The Aquatic Ecosystems core responsibility contributes to quality of life in Canada in the domain of Environment. The Department works to protect marine and coastal areas, safeguard species and habitats, encourage community stewardship and sustainable industry practices, and restore aquatic ecosystems. These efforts contribute to the subdomain of ecological integrity and environmental stewardship, as measured by the Canadian species index and multiple indicators related to conserved areas. Additionally, by incorporating aquatic ecosystem science into its decision-making, the Department contributes to the environment and people subdomain.
Progress on results
This section details the Department’s performance against its targets for each departmental result under core responsibility 2: Aquatic Ecosystems.
Table 8: Negative impacts on Canada’s oceans and other aquatic ecosystems are minimized or avoided
Table 8 shows the target, the date to achieve the target and the actual result for each indicator under “negative impacts on Canada’s oceans and other aquatic ecosystems are minimized or avoided” in the last three fiscal years.
| Departmental result indicators | Target | Date to achieve target | Actual results |
|---|---|---|---|
| Percentage of Canada’s oceans that are conservedFootnote16 | At least 25% | December 31, 2025 | 2022–23: 14.66% 2023–24: 14.66%Footnote17 2024–25: 15.54%Footnote18 |
| Percentage of development projects occurring in or near water that effectively avoid, mitigate or offset impacts to fish and fish habitatFootnote19 | Exactly 100% | March 31, 2025 | 2022–23: 93% 2023–24: 90% 2024–25: 88.5% |
| Percentage of aquatic species / populations at risk listed under the Species at Risk Act for which a recovery strategy / management plan is completed | At least 80% | March 31, 2025 | 2022–23: 90% 2023–24: 89% 2024–25: 92% |
| Percentage of approved requests to the Canadian Science Advisory Secretariat (CSAS) for peer-reviewed science advice on aquatic invasive species completed each yearFootnote20 | At least 90% | March 31, 2025 | 2022–23: 100% 2023–24: Not applicable 2024–25: 33% |
Table 9: Scientific information on Canada’s oceans and other aquatic ecosystems is available to inform management decisions
Table 9 shows the target, the date to achieve the target and the actual result for each indicator under “Scientific information on Canada’s oceans and other aquatic ecosystems is available to inform management decisions” in the last three fiscal years.
| Departmental result indicators | Target | Date to achieve target | Actual results |
|---|---|---|---|
| Number of science products related to aquatic ecosystems that are available | At least 100 | March 31, 2025 | 2022–23: 60 2023–24: 100 2024–25: 100 |
| Percentage of approved requests to the Canadian Science Advisory Secretariat (CSAS) for peer-reviewed science advice on aquatic ecosystems completed each yearFootnote21 | At least 90% | March 31, 2025 | 2022–23: 76% 2023–24: 87% 2024–25: 100% |
Table 10: Enhanced relationships with, involvement of, and outcomes for Indigenous people
Table 10 shows the target, the date to achieve the target and the actual result for each indicator under “enhanced relationships with, involvement of, and outcomes for Indigenous people” in the last three fiscal years.
| Departmental result indicators | Target | Date to achieve target | Actual results |
|---|---|---|---|
| Number of agreements / arrangements involving Indigenous groups | At least 180 | March 31, 2025 | 2022–23: 300 2023–24: 290 2024–25: 239 |
| Number of Indigenous people trained through agreements / arrangements | At least 310 | March 31, 2025 | 2022–23: At least 211 2023–24: 916 2024–25: 1,098Footnote22 |
| Number of Indigenous people employed through agreements / arrangements | At least 60 | March 31, 2025 | 2022–23: At least 53Footnote23 2023–24: 2 2024–25: 60 |
The Results section of the Infographic for Fisheries and Oceans Canada on GC Infobase page provides additional information on results and performance related to its program inventory.
Details on results
The following section describes the results for Aquatic Ecosystems in 2024–25 compared with the planned results set out in Fisheries and Oceans Canada’s Departmental Plan for the year.
Healthy oceans are vital to supporting the livelihoods of those who live near and rely on the ocean. DFO has a significant responsibility to protect the health of Canada’s oceans and aquatic ecosystems in partnership with Indigenous Peoples, other levels of government, and in consultation with stakeholders and interested parties. The Department also helps build a united Canada through its commitments to advancing reconciliation and protecting nature. Programs in the Aquatic Ecosystems core responsibility work to protect fish, fish habitats, and species at risk; establish and manage marine protected and conserved areas; manage aquatic invasive species; and undertake scientific research and activities to support decision-making and inform the Department’s work on everything from the sustainable use of marine resources to oil spill prevention and response. On top of these ongoing activities, the following are some of the Department’s achievements for 2024–25.
Negative impacts on Canada’s oceans and other aquatic ecosystems are minimized or avoided
Results achieved
The health of communities, economies, and the planet depend on respecting and protecting finite aquatic ecosystem resources. DFO, in partnership with Indigenous Peoples and provincial and territorial governments, and through engagement with stakeholders, continued to both respond to the realities of today and prepare for the challenges of tomorrow, such as climate change.
DFO took steps to identify areas of improvement in its regulatory process as directed by the Cabinet Directive on Regulatory and Permitting Efficiency for Clean Growth Projects to ensure clarity for project proponents, including for nation-building projects. For example, the Department produces an annual report on trends in information requests sent to proponents during the review process for applications for Fisheries Act authorizations, timelines for decision-making, and actions taken to reduce inefficiencies in this process. By identifying common gaps in applications that lead to information requests, DFO will be better placed to support project proponents in completing applications for Fisheries Act authorizations. DFO also reviewed its internal and external guidance to support applications for authorizations, and additional guidance documents were published during 2024-25, including a series of project planning tip sheets. For more detailed information, please refer to the Supplementary Information Table “Regulatory and Permitting Efficiency for Clean Growth Projects.”
DFO also published standardized general avoidance and mitigation measures to help project proponents reduce risks to fish and fish habitat. These measures are organized by type of pressure and support the use of the updated Pathways of Effects (PoE) diagrams to assess risk. Proponents can include these measures in their project submissions and add any additional, project-specific actions as needed.
In 2024-25, DFO furthered efforts to identify fish habitat restoration priorities across Canada, undertaking extensive engagement with Indigenous Peoples, provinces/territories, and stakeholders to outline region-specific restoration goals, objectives, and actions to maximize benefits for aquatic species and their habitats. The Department published progress updates on this work in each DFO Region on the platform used for public engagement on Fisheries Act products by the Fish and Fish Habitat Protection Program. This work is informed by the national Framework to Identify Fish Habitat Restoration Priorities and aims to improve coordination of marine and freshwater restoration and inform resource management decisions by leveraging partnerships to help reverse habitat loss and degradation.
In 2024-25, the Department built on its previous work to conserve 25 per cent of Canada’s oceans by 2025 and 30 per cent by 2030 by continuing its collaborative work on establishing new marine protected areas (MPAs) and areas recognized as marine other effective area-based conservation measures (OECMs). For example, in 2024-25, in collaboration with the Nuu-chah-nulth Tribal Council, the Council of the Haida Nation, the Pacheedaht First Nation, and the Quatsino First Nation, the government of Canada announced the designation of Tang.Gwan — ḥačxwiqak — Tsig̱is as a Marine Protected Area (MPA), increasing the per cent of Canada’s oceans conserved from 14.66 to 15.54. The MPA aims to conserve and protect the unique seafloor features, including seamounts and hydrothermal vents, and the marine ecosystems they support. The Department also recognized 3 new marine refuges in the North Coast of British Columbia: G̱aw Ḵáahlii (Masset Inlet), X̲aana K̲aahlii (Skidegate Inlet), and Banks (Banks Island). The G̱aw Ḵáahlii (Masset Inlet) and X̲aana K̲aahlii (Skidegate Inlet) marine refuges protect areas of high ecological and cultural significance and biodiversity in Haida Gwaii while the Banks (Banks Island) marine refuge aims to protect rockfish and their habitats, as well as corals and sponges, to contribute to long-term conservation and species biodiversity. DFO also published a second Ministerial Order for the Tuvaijuittuq MPA in Canada Gazette, Part II, working in collaboration with the Qikiqtani Inuit Association and Government of Nunavut, to maintain protections in the area for up to an additional 5 years while work continues to determine the feasibility of a long-term protection approach.
To provide the scientific evidence base for informed decision making that minimizes and avoids negative impacts in Canada’s MPAs, the Canadian Science Advisory Secretariat (CSAS) published 8 peer-reviewed science reports related to biophysical overviews and ecological assessments, including science advice on the ecological risk assessment for the Southampton Island Area of Interest. In 2024-25, DFO developed national guidance for ecological monitoring in Oceans Act MPAs, OECMs, and conservation networks to encourage monitoring efforts across Canada to become more standardized, efficient, and effective. CSAS published 7 peer-reviewed science reports related to indicators and monitoring for 6 MPAs.
In addition, the Department signed different agreements in relation with two Projects Finance for Permanence (PFP), the Great Bear Sea PFP and the SINAA PFP. These agreements support, among other things Indigenous-led conservation and are anticipated to result in the establishment of additional marine protected and conserved areas in the Great Bear Sea area in British Columbia and in the Qikiqtani region of Nunavut. Implementation of the SINAA PFP in Qikiqtani is anticipated to contribute up to 3.68 per cent in additional marine protected and conserved areas towards Canada’s marine conservation targets. The Great Bear Sea PFP is anticipated to contribute an additional 0.27 per cent in new proposed protected and conserved areas and will support the implementation of the MPA Network Action Plan for the Northern Shelf Bioregion (the Great Bear Sea), which was co-developed by Canada, British Columbia, and 17 First Nations, and is the foundation for the Great Bear Sea PFP conservation plan. For more information on this achievement, see the section on enhanced relationships with, involvement of, and outcomes for Indigenous Peoples below. DFO also continued to work closely with Mi’kmaq of Nova Scotia and the Province of Nova Scotia to designate the Fundian Channel-Browns Bank Area of Interest as an MPA.
DFO continued to work closely with the Kivalliq Inuit Association and local Hunter and Trapper Organizations to advance a potential MPA in the Southampton Island Area of Interest, which could contribute another 1.6 per cent towards the marine conservation target. DFO also worked with the Innu Nation to develop an Indigenous monitoring and stewardship program in Labrador in the Natuashish marine area.
In parallel, the Department continued to effectively manage and monitor existing MPAs and OECMs to support the achievement of conservation objectives and biodiversity conservation outcomes. For example, DFO published a new series of annual reports on Canada’s 14 Oceans Act MPAs, demonstrating the value of these sites and the ongoing work to effectively manage them. The reports summarize activities that occurred in each MPA in 2023 under the themes of research and monitoring, education and outreach, surveillance and enforcement, and management and governance. The reports also highlight key collaborations and partnerships, as well as the ecological, socio-cultural, and economic benefits of the MPAs. DFO also published the Scotian Shelf-Bay of Fundy Bioregional Marine Refuge Management Plan, which provides guidance and approaches for management of the bioregion’s marine OECMs to DFO staff, other governing authorities, marine users, and the public.
DFO also made progress, in the last year of funding, to consider the broader marine environment through marine spatial planning (MSP), a process that helps to identify suitable and unsuitable areas for a range of marine activities and areas that may require special protection. In 2024, DFO published first-generation MSPs, or frameworks, for the Southern British Columbia, Newfoundland and Labrador Shelves, and Scotian Shelf-Bay of Fundy planning areas. Also in 2024, the Department released national guidance for MSP, which provides high-level goals, principles, and activities, aligned with international and scientific best practices.
Leveraging the efforts advanced through MSP, DFO provided evidence-based insight that identified optimal areas for potential wind energy installations on Canada's East Coast with the understanding of current uses (including fisheries interests, shipping lanes and other important economic uses). This work reflects the presence of existing and proposed protected areas and also taking into account important considerations for wind energy production. The ability to provide this type of advice in high-use marine environments that require expeditious trade-off scenarios for best fit activities will become even more critical as Canada advances its ambitions on nation building projects.
DFO’s engagement also served to champion ocean protection internationally. In 2024-25, the Department hosted a delegation from Taiwan to showcase Canada’s progress on the development of domestic guidance for recognizing marine OECMs. DFO also contributed to a Protection of the Arctic Marine Environment (PAME) OECM Workshop in Norway to help protect biodiversity for generations to come and supported PAME’s publication of the Synthesis Report on Ecosystems Status, Human Impacts and Management of Measures in the Central Arctic Ocean, as well as the ongoing work to augment the Arctic Ship Traffic Database to enhance Arctic marine safety and support the protection of Arctic peoples and the environment.
Canada also joined the High Seas Treaty First Movers Initiative, which aims to identify biodiversity hotspots in the high seas that can be considered as early candidates for marine protection treaty, once it comes into force. As almost two thirds of the global ocean is outside national jurisdiction, advancing marine conservation in the high seas is essential to achieving the global goal of protecting 30 per cent of the ocean by 2030.
In 2024-25, DFO released a draft Ocean Noise Strategy for Canada, in collaboration with 9 other government departments. The Strategy is a coordinated federal approach to minimize the impacts of human-generated underwater ocean noise on marine life. Public input during the 60-day public consultation period and from a survey and engagement sessions will inform the finalization of the Strategy’s recommendations and the development of a Federal Action Plan on ocean noise.
The Department, in 2024-25, partnered with communities and organizations to enhance coordination, increase awareness, and address various marine stressors such as nutrient enrichment, sedimentation, and marine debris. DFO also developed evidence-based analysis (e.g., Effects of marine debris on Atlantic Canadian species and ecosystems) to strengthen Canada’s marine protection and conservation efforts.
In addition to longer-term collaborative, integrated planning and rebuilding efforts, DFO continued its work to respond to increasingly frequent extreme environmental conditions on the West Coast, which have the potential to threaten salmon and other aquatic species and the habitats they depend on. In response to drought conditions throughout British Columbia, DFO worked closely with the Government of B.C. to support their consideration of non-regulatory actions and regulatory powers under B.C.’s Water Sustainability Act to mitigate the effects of low flow and water use on fish, fish habitat, and aquatic species at risk like Nooksack Dace and Salish Sucker. Collaboration is essential to the effective and timely conservation and protection of species affected by climate emergencies.
DFO continued to advance the implementation of the modernized Fisheries Act, which restores lost protections, rebuilds fish populations, enables the consideration of Indigenous Knowledge, and incorporates modern safeguards so that fish and their habitats are protected for future generations. For more information, please see the Fisheries core responsibility above.
As part of the renewed Oceans Protection Plan, DFO continued to fund projects through the Aquatic Ecosystems Restoration Fund to address human impacts on Canadian aquatic species and habitats. For example, Memorial University of Newfoundland worked on establishing healthy coastal habitats for species such as Atlantic salmon, cod, American eel, and lobster through the restoration of eelgrass beds and artificial reefs to enhance habitat productivity and conserve biodiversity. In 2024–25, the project made significant strides in invasive species control, habitat restoration, and community engagement. Over 65,000 kg of invasive green crab were removed across eight sites, contributing to improved biodiversity and healthier eelgrass meadows. Monitoring efforts confirmed increased presence of key species like Atlantic cod and American eel, indicating ecosystem recovery. Also, foundational work was completed, including reef construction and site assessments. Community capacity building was advanced through youth outreach, training programs, and Indigenous-led data collection initiatives with the Mi’kmaq Alsumk Mowimsikik Koqoey Association.
DFO has a leadership role in managing aquatic species at risk in Canada to maintain biodiversity and habitat resiliency for generations to come, and to respond to commitments under the International Convention on Biological Diversity, including the Kunming-Montreal Global Biodiversity Framework. Historic investments made under the Nature Legacy and Enhanced Nature Legacy initiatives have set the stage for the enhanced protection and conservation of aquatic ecosystems and aquatic species, including species at risk, through the application of multi-species, place, and threat-based approaches and meaningful collaboration with Indigenous Peoples. Following the announcement in Budget 2023, the Canada Nature Fund for Aquatic Species at Risk was renewed to support up to $39 million in incremental funding over 3 years. This initiative aims to build relationships with Indigenous Peoples, provinces and territories, industry, and other partners by supporting and encouraging in-the-water stewardship actions. Under this contribution program, DFO identified 2 priority marine threats and 9 priority places to focus project funding.
In 2024-25, DFO worked to streamline listing processes to reduce delays in providing advice on the listing of aquatic species at risk under Schedule 1 of the Species at Risk Act. The Department developed Listing Guidelines for staff that outline regional and national processes and implemented a new Listing Process Options guide and related training material.
In November 2024, the then Minister of Fisheries and the Minister of the Environment, in his role as the Minister responsible for the Parks Canada Agency, announced that Parks Canada had formed the opinion that the Southern Resident Killer Whale (SKRW) continues to face imminent threats to its survival and recovery. The Government of Canada decided to not issue an Emergency Order and instead proposed a series of incremental regulatory and non-regulatory measures. Building on existing measures, the Government announced additional actions to address key threats, including the proposal to increase the vessel approach distance for SRKW through amendments to the Marine Mammal Regulations under the Fisheries Act, potential adjustments to adaptive salmon fishing closures in key foraging areas, and identifying interim underwater noise objectives in critical habitat, which will serve as benchmarks to measure noise level changes over time and guide efforts to reduce underwater noise. DFO also continued to lead and collaborate with other federal departments, including Transport Canada, Environment and Climate Change Canada, and Parks Canada to consult and work with Indigenous groups and stakeholders to develop and implement longer-term measures through existing processes. DFO also published the Beluga Whale St. Lawrence Estuary population proposed Action Plan to the Species at Risk public registry in November 2024.
In 2024-25, the Department worked alongside many Indigenous, governmental, and nongovernmental partners on a number of varied projects to both quantify the impacts of climate change and to support mitigation actions in support of Pacific Salmon. This included work on substantial improvements in hatchery infrastructure for enhancement, including work towards new hatcheries in priority areas, thermal tolerance to support harvest adjustments in response to high water temperatures, evaluations of swim performance to provide advice on fish passage at landslides and low flow barriers, implementing habitat restoration actions through the Department’s new Habitat Restoration Centre of Expertise, quantification of impacts of wildfire on changes in lake productivity, and innovative use of remote sensing matched with spatial ecology to evaluate the effectiveness of long-term mitigation and restoration actions. The Centre supported processed-based approaches, watershed planning, climate resilient solutions, emergency response and effectiveness monitoring through a combination of data-driven and science-informed approaches, innovations, and expanded capacity and expertise. The Centre also advanced data sharing and transparency with partners while supporting capacity building and transfer of skills to partners.
Aquatic invasive species can change and harm native habitats, and one of DFO’s responsibilities is to prevent and mitigate their presence in Canadian waters. Since the Government of Canada announced in 2022 that it will invest $37 million over 5 years, DFO expanded its work on aquatic invasive species prevention and management. In 2024–25, the Aquatic Invasive Species Prevention Fund supported 11 new multi-year projects for a total of $5 million to combat aquatic invasive species across the country. The projects will undertake activities such as the operation of boat washing stations; the early detection, monitoring, and removal of aquatic invasive species such as European Green Crab and tunicates; as well as education and outreach on preventing the spread of aquatic invasive species.
DFO’s Invasive Carp Program will continue to work with partners to prevent the introduction and spread of invasive carps in the Great Lakes. In 2024-25, additional eDNA surveillance work by partners will supplement DFO’s early detection surveillance using traditional fishing nets.
In 2024–25, DFO also advanced work towards potential amendments to the Aquatic Invasive Species Regulations to improve the efficiency and environmental protections of authorized control activities for aquatic invasive species that use registered pest control products. A “What we heard” report on the results of early engagement was published in January 2025, indicating general agreement with the proposal. The feedback received will be used to inform the regulatory process for the potential amendments, as well as policies and guidance in support of the implementation of the Regulations, when applicable.
DFO continued to work with provinces, territories, the Canada Border Services Agency, Parks Canada Agency, international partners, and stakeholders on the management of the spread of zebra and quagga mussels in a number of key entry points across Canada. Once established, these invasive mussels quickly take over, posing a serious threat to Canada’s aquatic ecosystems by altering food webs, damaging habitats, out-competing native species for food, and damaging and clogging infrastructure. In 2024-25, DFO partnered with the government of Manitoba to inspect 849 watercraft being transported by road for aquatic invasive species, including zebra mussels near the Ontario-Manitoba border, and collaborated with Canada Border Services Agency to inspect and, where appropriate, decontaminate 880 watercrafts for aquatic invasive species at the Emerson Port of Entry in Manitoba. Also, the provincial B.C. Invasive Mussel Defence Program trained 14 DFO fishery officers on zebra and quagga mussel watercraft inspection and decontamination in July 2024. DFO staff then operated 2 2-day watercraft inspection projects, resulting in 74 watercrafts being inspected, including 1 moderate risk decontamination.
DFO supported the deployment of three DFO-owned decontamination stations for operation in New Brunswick by DFO, the Province of New Brunswick, and the New Brunswick Invasive Species Council, expanding the coordinated decontamination effort and enhancing regional capacity to prevent the spread of aquatic invasive species. These decontamination stations were used at targeted fishing events throughout the province to decontaminate boats coming from high-risk areas for aquatic invasive species and provided opportunities to educate recreational fishers to “Clean, Drain, and Dry” their boats and fishing gear.
Scientific information on Canada’s oceans and other aquatic ecosystems is available to inform management decisions
Results achieved
The Department continued to conduct scientific research and activities to better understand chemical, physical, and biological ocean processes, how they are changing, and their impact on aquatic ecosystems and fisheries through collaborations with national and international partners. This work supports Canada’s blue economy as well as security and sovereignty on our waters.
Marine science also plays a vital role in oil spill prevention and response, contributing directly to a sustainable blue economy and the protection of aquatic ecosystems. For example, in 2024-25, DFO expanded research to advance Canada’s spill response regime and the delivery of the Oceans Protection Plan through the ratification of 8 multi-year contribution agreements with universities and research institutions in Canada and internationally.
DFO is also a supporter of the United Nations Decade of Ocean Science for Sustainable Development (2021 to 2030) and continued working with the Canadian ocean community and other partners to advance efforts to stimulate ocean science and knowledge generation to reverse the decline of the state of the ocean system through projects that contribute in advancing solution-oriented ocean science. For example, DFO hosted the annual forum of the All-Atlantic Ocean Research and Innovation Alliance in 2024 to advance collaborative initiatives in shared ocean challenges like climate change and coastal resilience.
DFO created a high-resolution numerical ocean model simulation for our 3 oceans from 1958 to the present, which is now being used to improve our understanding of drivers and mechanisms of ocean climate change, including within our marine conservation areas. Understanding the past and present is often key in helping to understand the future, and projections using state-of-the-art circulation models can be a powerful tool.
In support of the Government of Canada’s commitment to open science, the State of the Ocean program delivers annual summaries on the status and trends of marine ecosystems across Canada’s three oceans to Canadians. In February 2025, DFO released its second public report on the Arctic Ocean, Canada’s Oceans Now: Arctic Ecosystems, 2023, along with a video, ten Infographics, and two interactive activities. Published in English, French, Inuktitut, and Inuinnaqtun, the report presents accessible, high-level insights drawn from a comprehensive technical report referencing 475 scientific sources. Developed collaboratively, the report highlights key themes including environmental conditions, habitats, species, food webs, biodiversity, and the increasing involvement of Indigenous communities in research and monitoring.
Furthermore, DFO published its Open Science Action Plan, which describes actions undertaken to foster a culture of open science, share our science data, publish our science results, and communicate the Department’s science stories. The Action Plan responds to the Government of Canada Roadmap for Open Science published by Canada’s Chief Science Advisor.
The Department continued to advance the Coastal Environmental Baseline Program (CEBP) through the collection of physical, biological, and biogeochemical baseline data in six key coastal areas which are subject to vessel traffic or coastal development. In 2024-25, the CEBP collected data through 27 DFO-led projects and 44 partner-led projects. This baseline data is made openly available to inform decision-making and to enable the assessment of ecosystem changes in the future.
DFO’s Departmental Science Advisor led a blue carbon workshop with participation from experts from other departments, academia, and non-governmental institutions. Participants co-developed a report that provides a comprehensive overview of current knowledge, uncertainties, and knowledge gaps regarding blue carbon and its potential role in climate change mitigation.
In the spring of 2025, Canada made history by launching its first all-Canadian expedition beyond the Antarctic Circle. This journey aboard His Majesty’s Canadian Ship Margaret Brooke strengthened international science collaboration. The expedition, which included 15 Canadian scientists, two of whom were from DFO, focused on marine and coastal geoscience research, contributing to a better understanding of climate change impacts, particularly in polar regions. This unique opportunity also enabled scientific cooperation with Chile, Peru, Brazil, and Argentina, and may support further data-sharing collaborations into the future.
The Department also continued to conduct and disseminate vital scientific research and advice. For example, DFO’s Canadian Science Advisory Secretariat completed and released the report on the evaluation of a noise offset framework related to noise increases from Transmountain Expansion Project vessels and their potential impact on the Southern Resident Killer Whale.
Enhanced relationships with, involvement of, and outcomes for Indigenous people
Results achieved
In collaboration with Environment and Climate Change Canada, Parks Canada Agency, and Crown-Indigenous Relations and Northern Affairs Canada, DFO continued to work in partnership with Indigenous groups on the establishment of large-scale, distinctions-based, Indigenous-led conservation initiatives supported through the innovative Project Finance for Permanence (PFP) initiative of up to $800 million announced in 2022. This work supports Indigenous-led conservation and reconciliation, as well as Canada’s ambitious goal of conserving 30 per cent of land and waters by 2030. Indigenous groups, Canada, and philanthropic donors signed 2 marine-focused PFP agreements in 2024-25, the SINAA (formerly referred to as the Qikiqtani PFP) and the Great Bear Sea PFPs. These agreements were developed collaboratively, based on Indigenous groups’ vision for large-scale conservation, and include co-governance plans and long-term financial stability for Indigenous-led governance and stewardship.
DFO concluded negotiations on the Self Government Agreement (SGA) with Musqueam Indian Band. The SGA provides Musqueam with innovative lawmaking authority on matters of fish and fish habitat on Musqueam lands. While these authorities are similar to ones found in other SGAs, Musqueam is unique because a portion of their Indian reserve lands extend into the foreshore.
Many aquatic species at risk have social, economic, and cultural significance to Indigenous Peoples, and DFO remained committed to exploring opportunities to collaborate with Indigenous Peoples throughout all of the Species at Risk Act processes, including on the listing recovery and management of aquatic species at risk. In October 2024, a new Canadian Nature Fund for Aquatic Species at Risk’s Indigenous grant funding program was established to provide accessible and timely support to Indigenous Peoples to participate in consultation and engagement activities. This grant will decrease barriers, build capacity, and enhance opportunities for the inclusion of Indigenous Knowledge and perspectives in these processes.
Invasive species can be detrimental to the places where Indigenous Peoples live and work. In 2024-25, DFO provided training, equipment, and funding to the Métis Nation of Ontario (MNO) to conduct environmental DNA surveillance for Grass Carp in multiple MNO regions. The Department also supported Mississauga First Nation and Magnetawan First Nation through contribution funding to increase awareness through fish identification training, to undertake outreach activities on threats of invasive carps to their communities, and to conduct environmental DNA surveillance for Grass Carp.
These are some examples of how the Department helped build a united Canada through its commitments to advancing reconciliation and protecting nature.
Resources required to achieve results
Table 11: Snapshot of resources required for Aquatic Ecosystems
Table 11 provides a summary of the planned and actual spending and full-time equivalents required to achieve results.
| Resource | Planned | Actual |
|---|---|---|
| Spending | $458,054,031 | $650,678,379 |
| Full-time equivalents | 1,892 | 1,997 |
The Finances section of the Infographic for Fisheries and Oceans Canada on GC Infobase page and the People section of the Infographic for Fisheries and Oceans Canada on GC Infobase page provide complete financial and human resources information related to its program inventory.
Related government-wide priorities
This section highlights government priorities that are being addressed through this core responsibility.
Gender-based Analysis Plus
Species at risk in aquatic environments sometimes occur in the traditional territories of Indigenous Peoples. These communities intimately understand the consequences of species becoming at risk, especially for numerous species of cultural, food, and socio-economic value (e.g. salmonids, sturgeons, eulachon, American eel, and others). Indigenous Peoples have the traditional knowledge to help support recovery efforts and the interest, sense of obligation, and commitment to sustainability that makes them an important partner for DFO. Collection of demographic information regarding participants in Indigenous environmental monitoring activities assists in providing overall data to support future GBA Plus reviews. However, reporting burdens and confidentiality issues can arise when asking Indigenous communities or band-owned enterprises for employee information. Going forward, DFO staff will work with experts in the Access to Information Act and Privacy Act to develop methods to collect and protect sensitive data to further analyses.
In 2024–25, the designation of the Tang.ɢ̱wan – ḥačxwiqak – Tsig̱is Marine Protected Area marked a significant milestone in advancing reconciliation and collaborative approaches to marine stewardship. This initiative was co-developed with the Council of the Haida Nation, the Nuu-chah-nulth Tribal Council, the Pacheedaht First Nation, and the Quatsino First Nation, reflecting a collaborative approach that respects Indigenous Knowledge systems, governance structures, and stewardship values. Through this process, DFO supported Indigenous leadership in marine conservation, contributing to more equitable decision-making and recognition of rights and responsibilities. The initiative demonstrates strong alignment with GBA Plus principle, particularly in terms of supporting Indigenous self-determination.
The Oceans Management Contribution Program continued to support Indigenous-led conservation through targeted funding agreements, including a notable collaboration with the Innu Nation in Labrador. This agreement focused on the development of an Indigenous monitoring and stewardship program in Labrador in the Natuashish marine area. The initiative provided resources to build local capacity, integrate Traditional Knowledge, and support community-driven conservation planning. From a GBA Plus perspective, this work contributes to addressing systemic barriers to participation in marine governance and supports culturally-relevant approaches to environmental stewardship.
United Nations 2030 Agenda for Sustainable Development and the Sustainable Development Goals
More information on DFO’s contributions to Canada’s Federal Implementation Plan on the 2030 Agenda and the Federal Sustainable Development Strategy can be found in our Departmental Sustainable Development Strategy.
Innovation
Through the Innovative Solutions Canada program, the Department continued to support the development and commercialization of technologies and services to support monitoring of the biological and physical health of the marine environment, including the detection of invasive species and monitoring of marine protected areas.
DFO advanced the use of artificial intelligence (AI) and machine learning across several areas of scientific research, for example, to improve predictive ocean models, enabling more accurate forecasts of ocean conditions and climate impacts. AI also enhanced the ability to identify and quantify biodiversity in aquatic ecosystems by automating the analysis of environmental DNA, imagery, and acoustic data. DFO also explored the use of AI to accelerate the review of underwater imagery to automate the detection and identification of underwater species. This work provided valuable insights and laid the groundwork for ongoing efforts to identify and evaluate AI tools for reviewing underwater video.
DFO continued to support and promote learning and public science as the first science-based department to co-host the 2025 GC Data Conference, the largest annual Canadian public service conference with over 9,000 registered participants. The Department also used this opportunity to launch a year-long departmental learning campaign focusing on good data stewardship and the ethical and responsible use of data and AI to guide innovative approaches to delivering on departmental priorities and services to Canadians.
Program inventory
Aquatic Ecosystems is supported by the following programs:
- Fish and Fish Habitat Protection
- Aquatic Invasive Species
- Species at Risk
- Marine Planning and Conservation
- Aquatic Ecosystem Science
- Oceans and Climate Change Science
Additional information related to the program inventory for Aquatic Ecosystems is available on the Results page on GC InfoBase.
Core responsibility 3: Marine Navigation
Description
Provide information and services to facilitate navigation in Canadian waters.
Quality of life impacts
The Marine Navigation core responsibility contributes to quality of life in Canada within the domain of Prosperity. By providing marine information and services that facilitate safe and reliable navigation in Canadian waters, the Department supports an efficient marine transportation sector, which impacts the subdomain of income and growth and the indicator “gross domestic product (GDP) per capita.” The effective management of waterways enhances public trust and confidence in government institutions, promoting the Good Governance domain, specifically the democracy and institutions subdomain and “confidence in institutions” indicator.
Progress on results
This section details the Department’s performance against its targets for each departmental result under core responsibility 3: Marine Navigation.
Table 12: Mariners safely navigate Canada’s waters
Table 12 shows the target, the date to achieve the target and the actual result for each indicator under “mariners safely navigate Canada’s waters” in the last three fiscal years.
| Departmental result indicators | Target | Date to achieve target | Actual results |
|---|---|---|---|
| Rate of marine incidents versus vessel movements | At most 1% | March 31, 2025 | 2022–23: 0.02% 2023–24: 0.02% 2024–25: 0.02%Footnote24 |
| Number of official navigational products created and/or updated per year, from incorporation of new and modern hydrography and/or navigationally significant informationFootnote25 | At least 200 | March 31, 2025 | 2022–23: 1,174 2023–24: 1,568 2024–25: 1,685Footnote26 |
Table 13: A Canadian maritime economy that is supported by navigable waters
Table 13 shows the target, the date to achieve the target and the actual result for each indicator under “A Canadian maritime economy that is supported by navigable waters” in the last three fiscal years.
| Departmental result indicators | Target | Date to achieve target | Actual results |
|---|---|---|---|
| Rate of marine incidents versus vessel movements | At most 1% | March 31, 2025 | 2022–23: 0.02% 2023–24: 0.02% 2024–25: 0.02%Footnote27 |
| Percentage of ship ice escort requests south of the 60th parallel north that are delayed beyond level of service response time standardsFootnote28 | Exactly 0% | March 31, 2025 | 2022–23: 3.6% 2023–24: 2% 2024–25: 2% |
| Average time (in hours) beyond level of service response time standards for ice escort requests south of the 60th parallel northFootnote29 | Exactly 0 (hours) | March 31, 2025 | 2022–23: 13.12 2023–24: 6.5 2024–25: 15 |
Table 14: Enhanced relationships with, involvement of, and outcomes for Indigenous people
Table 14 shows the target, the date to achieve the target and the actual result for each indicator under “enhanced relationships with, involvement of, and outcomes for Indigenous people” in the last three fiscal years.
| Departmental result indicators | Target | Date to achieve target | Actual results |
|---|---|---|---|
| Number of agreements / arrangements involving Indigenous groups | n/a | n/a | 2022–23: 11 2023–24: 6 2024–25: n/a |
| Number of Indigenous people employed through agreements / arrangements | n/a | n/a | 2022–23: n/aFootnote30 2023–24: n/aFootnote31 2024–25: n/a |
The Results section of the Infographic for Fisheries and Oceans Canada on GC Infobase page provides additional information on results and performance related to its program inventory.
Details on results
The following section describes the results for Marine Navigation in 2024–25 compared with the planned results set out in Fisheries and Oceans Canada’s Departmental Plan for the year. Further to Order in Council 2025-0639, approved on September 2, 2025, transferring responsibility for the CCG from DFO to the Department of National Defence (DND), DND will undertake future reporting for the CCG through their Departmental Plans and Departmental Results Reports.
Safe and reliable navigation of waterways is essential for trade and access to global markets. DFO and the CCG help build a strong Canadian economy and a safe and secure Canada by ensuring that Canada’s waters are safe and navigable for mariners through the charting and provision of marine navigation information and services and the provision of marine communications and traffic services, aids to navigation, waterways management, and icebreaking services. On top of these ongoing services, the following are some of the Department’s achievements for 2024–25.
Mariners safely navigate Canada’s waters
Results achieved
In 2024-25, Arctic survey operations continued with 48,006 km surveyed, adding an additional 19,726 km2 of survey data. During this period, 83 Electronic Navigational Chart products were officially published. This work is critical to gaining a better understanding of changes occurring in the region and their impact on marine ecosystems and marine safety and navigation.
The new Community Hydrography program developed 3 additional pilot projects for bathymetric (seafloor) data collection and mapping with coastal and Indigenous communities, for a total of 6 ongoing projects, which contributed to support for coastal and Indigenous communities’ collection and use of this data, advancing their understanding of the local seafloor.
Technology helped improve the collection and sharing of navigational data. In collaboration with internal, federal, and industry partners and port authorities, the Department used virtual Automatic Identification System (AIS) aids to navigation to mark marine mammal sanctuaries that helped to minimize risks of vessel strikes to endangered species. The Department also created a tool that uses AIS to allow Marine Communications and Traffic Services (MCTS) officers to monitor vessel compliance of imposed speed limits and the boundaries of marked 'no-go' zones. In addition, the implementation of the Collaborative Voyage Management System continued in 2024-25. This platform will allow the capture of vessel-traffic data directly from mariner input at MCTS centres across Canada. Further, in response to pilots’ requests for digital weather information, in the Atlantic Region, in collaboration with Environment and Climate Change Canada, work is being completed to establish a process to digitally transfer weather data from various Canadian Coast Guard wind sensors via AIS messages. MCTS also enhanced the Navigational Warning Issuing System to now include real-time NAVAREA warnings alongside coastal warnings, so mariners can access full-text warnings and “in-force” bulletins through a single, centralized link. These projects are critical in maintaining the safe and efficient movement of marine traffic and goods, while protecting the marine environment.
A Canadian maritime economy that is supported by navigable waters
Results achieved
The implementation of e-navigation remained at the core of the CCG’s work to modernize marine navigation services in Canada and to digitalize its tools and services to meet international requirements. In 2024-25, the CCG launched the development of technical and operational requirements for the new Vessel Traffic Management Information System, finalized a policy for the use of automated digital notices on safe navigation for vessels with compliant navigation software, and made waterways information accessible more efficiently through the e-Navigation Portal. The shift towards e-navigation will provide digital information and tools for the benefit of maritime safety, security, and protection of the marine environment, reducing administrative burden, and increasing the efficiency of maritime trade and transport in Canada.
To advance the modernization of marine navigation programs to meet international standards, the CCG and Canadian Hydrographic Service continue to lead an interdepartmental committee that monitors progress aimed at achieving international standards in a timely manner to ensure a whole-of - government coordinated effort on Canada’s implementation of the S-100 Universal Hydrographic Data model of the International Hydrographic Organization (IHO) that comes into force by 2026. The S-100 data model is a new global standard which offers a new way of visualizing the marine environment using layered, interactive digital data that can be added to navigational charts. Unlike traditional paper or electronic charts, the new standard integrates real-time information – like depths, landmarks, tides, and currents into a single, dynamic format. In 2024-25, the DFO Canadian Hydrographic Service, in collaboration with the CGG and others, received endorsement from IHO to host sea trials in 2025-26. These sea trials are expected to provide real-time S-100 data and services along the 350-km stretch of the St. Lawrence Waterway.
In 2024- 25, as part of the S-100 data model implementation, the Department piloted modern S-63 encrypted chart distribution on 6 CCG vessels. The charts, which are automatically updated online weekly, provide streamlined services to mariners to maximize routes, avoid collisions and groundings, minimize impacts to marine mammals, and reduce transport-related carbon emissions.
Enhanced relationships with, involvement of, and outcomes for Indigenous people
Results achieved
DFO and the CCG’s Arctic Regions continued to collaborate with Inuit Tapiriit Kanatami and the Inuit Treaty Organization to develop an Inuit Nunangat Policy work plan through regular, ongoing engagement and relationship building at the DFO/CCG-Inuit Nunangat Arctic committee. The committee is a co-governance table that ensures Inuit are at the centre of planning and decision-making about departmental programs and services for Inuit communities. The implementation of the CCG Arctic Region, including northernizing programs; regional recruitment and personnel; and access to training, assets, and infrastructure in Inuit Nunangat, has been the focus of this table’s work together.
The CCG finalized and published the Arctic Strategy in English, French, and Inuktitut in August 2024. The strategy will guide the CCG in delivering its mandate within the Arctic’s unique operational context over the next 10 years. As noted in the strategy, the CCG is enhancing its year-round presence in the Arctic with innovative programs, a modernized fleet, an equitable and representative workforce, and policies that are made in the North, by the North, and for the North.
In addition, the Department published the "DFO CCG Inuit Employment Plan 2023-2033" in September 2024 as part of its Nunavut Agreement Article 23 commitments to realizing a fully-representative workforce in the Nunavut Settlement Area. These commitments are strengthened through the Department’s tailored recruitment and outreach initiatives, which incorporate Indigenous languages and reflect the distinct realities of northern communities, in close collaboration with Inuit organizations. These efforts led to the successful hiring of 4 Indigenous deckhands through the Indigenous Participation and Training program.
DFO, CCG, and Makivvik established and co-led a new Nunavik-DFO/CCG regional governance table. Terms of reference were endorsed by all partners and draft work plan is in development. The departmental Arctic regions also collaborated with the Government of Nunatsiavut to work toward a regional governance table. These tables ensure formal, regular meetings and ongoing communication to work together and coordinate planning and implementation of safe shipping routes, navigation aids, ice information, and marine safety planning in their regions of Inuit Nunangat. These tables give everyone a voice in decisions that affect how vessels move safely through Arctic waters and aligns the Department’s responsibilities under modern Treaties and Land Claim Agreements.
As part of the Department’s ongoing commitment to building a future of enhanced distinctions-based relationships with, involvement of, and outcomes for Indigenous Peoples, DFO continues to be guided by the United Nations Declaration on the Rights of Indigenous Peoples Act (UNDA) and the UNDA Action Plan. All core responsibilities across the Department seek opportunities for co-development, co-design, and co-delivery with Indigenous partners to improve programs and will continue to implement the DFO-CCG Reconciliation Strategy.
In 2024-25, the CCG continued to support the implementation of departmental and other government departments’ UNDA Action Plan measures, providing subject matter expertise specific to the marine safety system. The Agency provided support for departmental efforts to develop and employ mechanisms that respect and incorporate Indigenous Knowledge as a distinct knowledge system (UNDA Action Plan Measure Shared Priorities #40), including the application of OCAP principles (ownership, control, access, and possession) to knowledge that is shared specifically to support emergency response efforts. The CCG also engaged externally with Indigenous partners, including hosting Inuit Tapiriit Kanatami President Natan Obed for a discussion on the CCG's implementation of the UNDA and the Inuit Nunangat Policy.
Resources required to achieve results
Table 15: Snapshot of resources required for Marine Navigation
Table 15 provides a summary of the planned and actual spending and full-time equivalents required to achieve results.
| Resource | Planned | Actual |
|---|---|---|
| Spending | $376,795,478 | $341,970,776 |
| Full-time equivalents | 1,778 | 1,713 |
The Finances section of the Infographic for Fisheries and Oceans Canada on GC Infobase page and the People section of the Infographic for Fisheries and Oceans Canada on GC Infobase page provide complete financial and human resources information related to its program inventory.
Related government-wide priorities
This section highlights government priorities that are being addressed through this core responsibility.
Gender-based Analysis Plus
The Department continued to use gender-based analysis plus (GBA Plus) to understand who is impacted by the issues or opportunities being addressed by the Department’s initiatives, identify how initiatives could be tailored to meet diverse needs of the people most impacted, and anticipate and mitigate any barriers to accessing or benefitting from them.
An initiative under the Government of Canada's Oceans Protection Plan, Community Hydrography is a five-year (2022 to 2027) program supporting coastal and Indigenous communities to collect and use bathymetric data and information for their own community purposes. Bathymetry is the measurement of the depth of water in oceans, rivers and lakes. Bathymetric data can help to improve marine safety, community planning, identification of undersea hazards and sensitive marine environments, as well as fishing and harvesting. Through this program, the Department supported three new Community Hydrography projects in 2024-2025 and continued three projects that started in previous years.
United Nations 2030 Agenda for Sustainable Development and the Sustainable Development Goals
More information on DFO’s contributions to Canada’s Federal Implementation Plan on the 2030 Agenda and the Federal Sustainable Development Strategy can be found in our Departmental Sustainable Development Strategy.
Innovation
In 2024-25, the CCG completed the second year of a 3-year project to inform the transition from diesel generators to renewable / hybrid power systems at its remote radio communications sites. The project, funded through the Greening Government Fund, aims to make the remote infrastructure more resilient and flexible and to reduce the agency’s operational greenhouse gas emissions. Over the 3 years, the project will:
- Validate the performance and suitability of renewable / hybrid power systems to deliver reliable power to critical remote infrastructure
- Inform the CCG’s future renewable energy investment decisions based on validation of results and lessons learned
- Create a national inventory of CCG remote site power systems to guide expansion across the CCG
In 2024–25, the Department advanced its digital transformation agenda by leveraging innovative technologies to modernize chart production and enhance navigational safety. In 2024-25, DFO launched the S421 Route Risk Assessment pilot project to support safer Arctic navigation. This initiative introduced machine-readable formats for voyage plans, enabling automated risk assessments based on charting data. The project, developed in collaboration with Transport Canada, aims to improve the quality and timeliness of navigational risk insights while reducing manual processing. This is just one example of the ways in which the Department is using automation and data-driven tools to deliver faster, more efficient services to mariners and support Canada’s broader goals for safe and sustainable marine transportation.
Program inventory
Marine Navigation is supported by the following programs:
- Icebreaking Services
- Aids to Navigation
- Waterways Management
- Marine Communications and Traffic Services
- Shore-based Asset Readiness
- Hydrographic Services, Data and Science
Additional information related to the program inventory for Marine Navigation is available on the Results page on GC InfoBase.
Core responsibility 4: Marine Operations and Response
Description
Provide marine response services and operate Canada’s civilian maritime fleet.
Quality of life impacts
The Marine Operations and Response core responsibility contributes to quality of life in Canada within the domain of Environment. By providing on-water services, including marine environmental and hazards response to incidents, the Department protects the marine environment, enhancing public health and safety. The CCG also ensures a level of preparedness through response exercises and the development and updating of policies and documents to ensure a cohesive, collaborative, and coordinated all-hazards response with other departments. These efforts impact the subdomain of environment and people, through the indicator “natural disasters and emergencies,” as well as the subdomain ecological integrity and environmental stewardship, with multiple indicators related to water quality and ecosystem health.
This core responsibility also contributes to the domain of Health. By ensuring the safety and security of Canada’s waters, including search and rescue response, the Department enhances public health and safety. The Department’s Search and Rescue program is designed to assist people who are lost, missing, or in distress in marine areas of federal responsibility. Its primary objective is the safety of human life. These activities align with the subdomain of Healthy People and the indicator “health-adjusted life expectancy.”
Finally, this core responsibility promotes the domain of Good Governance. Effective response to marine incidents, supported by a modern fleet of Coast Guard vessels, increases public trust. This contributes to the subdomain of democracy and institutions, aligning with the indicator “confidence in institutions.”
Progress on results
This section details the Department’s performance against its targets for each departmental result under core responsibility 4: Marine Operations and Response.
Table 16: Canadian Coast Guard has the capability to respond to on-water incidents
Table 16 shows the target, the date to achieve the target and the actual result for each indicator under “Canadian Coast Guard has the capability to respond to on-water incidents” in the last three fiscal years.
| Departmental result indicators | Target | Date to achieve target | Actual results |
|---|---|---|---|
| Percentage of responses to environmental incidents that meet established standards | Exactly 100% | March 31, 2025 | 2022–23: 100% 2023–24: 100% 2024–25: 100% |
| Percentage of search and rescue responses that meet established standards | At least 99% | March 31, 2025 | 2022–23: 99% 2023–24: 99% 2024–25: 99% |
Table 17: Canada’s Civilian fleet has the capability to meet established service standards for clients
Table 17 shows the target, the date to achieve the target and the actual result for each indicator under “Canada’s Civilian fleet has the capability to meet established service standards for clients” in the last three fiscal years.
| Departmental result indicatorsFootnote32 | Target | Date to achieve target | Actual results |
|---|---|---|---|
| Operational days delivered vs. operational days planned | At least 90% | March 31, 2025 | 2022–23: Data not available 2023–24: Data not available 2024–25: Data not available |
| Percentage of operational days lost due to crewing and logistical issues | At most 3% | March 31, 2025 | 2022–23: Data not available 2023–24: Data not available 2024–25: Data not available |
| Percentage of operational days lost due to unplanned maintenance | At most 3% | March 31, 2025 | 2022–23: Data not available 2023–24: Data not available 2024–25: Data not available |
Table 18: Enhanced relationships with, involvement of, and outcomes for Indigenous people
Table 18 shows the target, the date to achieve the target and the actual result for each indicator under “enhanced relationships with, involvement of, and outcomes for Indigenous people” in the last three fiscal years.
| Departmental result indicators | Target | Date to achieve target | Actual results |
|---|---|---|---|
| Number of agreements / arrangements involving Indigenous groups | At least 58 | March 31, 2025 | 2022–23: n/aFootnote33 2023–24: 29 2024–25: 115 |
| Number of Indigenous people trained through agreements / arrangements | At least 76 | March 31, 2025 | 2022–23: 291 2023–24: 425 2024–25: 451 |
The Results section of the Infographic for Fisheries and Oceans Canada on GC Infobase page provides additional information on results and performance related to its program inventory.
Details on results
Further to Order in Council 2025-0639, approved on September 2, 2025, transferring responsibility for the CCG from DFO to the Department of National Defence (DND), DND will undertake future reporting for the CCG through their Departmental Plans and Departmental Results Reports.
Canada is paving a new path towards its future by shifting its focus towards diversifying and growing its international trade partnerships while also focusing on domestic trade growth. Moreover, Canada is aiming to establish itself as a global energy provider by harnessing its vast reserves of traditional fuels, clean energy resources, and critical minerals such as copper, lithium, and cobalt. A lot of these trade activities will take place in the marine domain, which means that Canadian waters will continue to play a critical role in Canada’s economic transformation. At the core of Canada’s marine capabilities is the Canadian Coast Guard (CCG), the on-water lead agency uniquely equipped to oversee and coordinate the full spectrum of on-water activities and marine incident response. This includes managing environmental risks, addressing vessels that present hazards, and conducting Search and Rescue operations that require immediate response, while supporting other emergency management partners with on-water and air access during crisis. Additionally, the CCG plays a crucial role in ensuring vessel owner compliance and adherence to Canada’s maritime laws and regulations. As maritime traffic increases along Canada’s coastlines and in Canadian waters, increased CCG presence could help ensure that trade, including resource exports, is not only possible but also responsible, resilient, and secure.
The following section describes the results for Marine operations and response in 2024–25 compared with the planned results set out in Fisheries and Oceans Canada’s departmental plan for the year.
Maritime Security
The Canadian Coast Guard worked in close cooperation and collaboration with other federal maritime security partners to support not only Canada’s maritime domain awarenessFootnote34 but also the safety, security, and sovereignty of Canadian waters. In response to the 2022 report on Arctic Waters Surveillance by the Office of the Auditor General, further progress was made in 2024-25 to address the recommendations. Key accomplishments include the completion of a draft Canadian Coast Guard Maritime Domain Awareness Strategy, the updating of the Maritime Security Operations Centres (MSOC) Guidelines and Priority Intelligence Requirements, the upgrading of the Maritime Information Portal, and the initiation of a process to revise the terms of reference for committees and working groups involved in MSOC governance.
The CCG has the capability to respond to on-water incidents
Results achieved
The CCG continued to expand its work under the Oceans Protection Plan (OPP), which committed $2 billion over nine years starting in 2022 and builds on the $1.5 billion committed in 2016. This maintains and expands initiatives that have helped to make Canada’s oceans safer, healthier, and cleaner. In 2024-25, the CCG’s operations and response-related results for the OPP included the following:
- expanded Canada’s marine emergency prevention, preparedness, and response approaches to handle marine pollution oil spills through both the delivery of Arctic Environmental Response Community Caches of equipment and training in Parry Sound and Quebec City on new environmental response equipment in accordance with the Environmental Response Equipment Modernization Initiative
- worked with vessel owners to prevent marine pollution and hazards, and taking enforcement when necessary. In 2024-25, the CCG removed over 85 wrecked, abandoned, or hazardous vessels. The agency also issued 4 administrative monetary penalties to non-compliant owners under the Wrecked, Abandoned or Hazardous Vessels Act
- provided extensive training to CCG enforcement officers to effectively use all the legislative tools at their disposal, including issuing monetary penalties, in support of the polluter pay principle
- significantly strengthened cost recovery processes in response to hazardous and polluting vessels under the polluter pay principle, with the number and value of claims submitted climbing from 34 files worth $2.2 million in 2022-23 to 56 files for a total of $5 million claimed in 2024-25
- increased response capacity with the delivery of a medium high-speed sweep system, 13 large pumps, and five oil storage barges (two 40 cubic meter and three 20 cubic meter barges)
- leased a dedicated workshop in Iqaluit for year-round mechanical and maintenance work, as well as for incident coordination and exercising
- expanded Indigenous participation in Canada’s marine safety systems, including by increasing the budget for trained and resourced responders, such as the Canadian Coast Guard Auxiliary (CCGA), by over 30 per cent. The Indigenous Community Boat Volunteer Program (ICBVP) enables communities to acquire vessels, equipment, and training needed to become active CCGA members. As of March 31, 2025, 55 Indigenous communities have received ICBVP funding and are working with CCGA to build local response capacity; this is critical in remote areas where they are often the first and only responders
- empowered Indigenous and coastal communities to play a more meaningful role in marine safety by delivering search and rescue and marine safety training to 451 Indigenous participants across 63 communities in 2024-25 through the Indigenous Search and Rescue Training and Exercising project
- The Coastal Marine Response Teams initiative further supports community-led emergency response by co-developing response frameworks and funding local capacity by distributing $2.5 million across Western, Central, and Atlantic regions for hiring marine liaison officers, purchasing equipment, and delivering training
- under the Integrated Marine Response Planning initiative, continued to strengthen marine emergency preparedness through inclusive, risk-informed planning that integrates both scientific data and Indigenous Knowledge. In 2024-25, the CCG developed planning, training, and exercise documents that reflect engagement with Indigenous partners, other government departments, and regional stakeholders
- continued the support to other departments leading the OPP initiative. The CCG supported Environment and Climate Change Canada in engaging the public and developing an interdepartmental framework for recovery from marine oil spills. It also collaborated with Transport Canada on the development and publication of the National Places of Refuge Contingency Plan, ensuring its ongoing implementation, and remains involved in advancing the Vessel Remediation Fund and the potential development of regulations for Hazardous and Noxious Substances vessels, reinforcing its commitment to coordinated marine environmental response and recovery
In its final year, the Trans-Mountain Expansion accommodation measure Co-Developing Community Response (CDCR) initiative was a tremendous success as 31 of 33 eligible groups (93.94% participation rate) have contribution agreements, 25 of 33 eligible groups (75.75% completion rate) have completed training, and 24 out of 33 eligible groups (72.7% participation rate) have participated in marine response exercises. Throughout the CDCR initiative, $33 million in funding has been disbursed to eligible Indigenous groups. This funding has enabled Indigenous groups to participate in training sessions, receive essential spill response equipment, and engage in collaborative planning exercises thus enhancing their capacity for marine spill response. Broadly, the CDCR initiative has helped to deepen capacity within Indigenous communities to respond to marine pollution incidents in their traditional territories and helped to solidify the groundwork that has been laid for the formal inclusion of Indigenous community responders in Canada’s marine response regime.
In efforts to strengthen the response to pollution incidents involving hazardous and noxious substances, the CCG acquired 56 personal gas detectors and 7 area monitors. Furthermore, 80% of responders in the Marine Environmental and Hazards Response program have received basic hazmat (hazardous material) awareness training, enhancing overall preparedness and safety.
Canada’s Civilian fleet has the capability to meet established service standards for clients
Results achieved
The CCG operates the federal government’s civilian fleet and provides essential maritime services to Canadians. However, the CCG’s aging vessels are becoming more costly to maintain and are more frequently taken out of operation for unscheduled repairs, placing further strain on the remaining fleet. As the Department experiences increasing pressure for on-water work, the need to replace the vessels has never been more important. Through the National Shipbuilding Strategy, construction continued on large and small ships for the CCG.
Throughout 2024 25, work continued on the new Offshore Oceanographic Science Vessel (OOSV). The OOSV is expected to be delivered in fall 2025, and it will be DFO’s primary offshore oceanographic science and survey platform. Additionally, work on the Near Shore Fishery Research Vessel (NSFRV) was also advanced in 2024-25 in preparation to start build work in 2025-26. NSFRV will be the CCG’s first-ever diesel-electric hybrid propulsion vessel, using a battery energy storage system, and is designed to reduce the consumption of fossil fuels. This vessel will provide an additional platform with capabilities to conduct hydrographic services in nearshore areas.
To secure Canada’s Arctic, in 2024-25, build contracts were awarded to Vancouver Shipyards and Chantier Davie to each build a Polar Icebreaker. These icebreakers will be the flagships of Canada’s future fleet and will contribute to strengthening Canada’s Arctic sovereignty and security with a year-round presence in the North. Simultaneously, they will provide icebreaking services to commercial traffic, conduct high Arctic missions and science work, and support northern communities. Further progress was also made on several other large and small shipbuilding projects. The CCG took delivery of two search and rescue lifeboats, bringing the total to 18 delivered from the 20 under contract. Construction began on the second of two CCG-variant Arctic and Offshore Patrol Ships at Irving Shipbuilding. Request for Information processes were completed on both the Mid-Shore Multi-Mission and the Special Shallow Draft Buoy Tenders projects. Engineering work continued on the Multi-Purpose Icebreakers at Vancouver Shipyards and work advanced under an Auxiliary Contract for the Program Icebreakers at Chantier Davie.
New vessels will continue to be designed to use modularity, wherever feasible, to enable them to serve different functions by adding or removing modules of equipment such as science laboratories. This versatility will enable the CCG’s fleet to continue to deliver core services such as search and rescue, while meeting new challenges posed by climate change and an evolving security environment.
While awaiting delivery of new vessels, the CCG continued its work on extending the life of the existing fleet through the Vessel Life Extension 2020 project. This project will continue until the late 2030s, with the aim of ensuring that older active vessels are safe, reliable, and able to continue providing essential services to Canadians. For example, in 2024-25, the CCGS Sir Wilfrid Laurier underwent a complete engine replacement and the CCGS Louis S. St-Laurent had crane and equipment upgrades.
New investments in people and infrastructure are needed to prepare for the CCG’s new vessels. Budget 2023 provided $119.6 million over five years, starting in 2023–24, to reinforce the integrity of the CCG’s helicopter fleet, to prepare infrastructure, and to hire and train staff to operate its future marine vessel fleet. In 2024-25, the Department secured the procurement of a replacement helicopter.
The CCG made significant progress in 2024-25 in expanding and modernizing the Canadian Coast Guard College’s capacity to train the personnel that will be required to operate the CCG’s larger and more complex future vessels. This included hiring key instructional staff and expanding the CCG’s learning management system to enhance lifelong learning and technical upskilling across the fleet. The CCG also completed planning for the waterfront infrastructure required to support marine emergency duties training. This included geotechnical and environmental assessments, engagement with Indigenous partners, and confirmation that all obligations under the Impact Assessment Act and the Navigable Waters Act can be met.
Also in 2024-25, the CCG launched its third consecutive national advertising recruitment campaign to address both immediate and long-term staffing needs for high-priority, hard-to-fill positions. Positions were identified based on lessons learned from previous campaigns and persistent recruitment challenges, particularly in remote and specialized operational environments.
Enhanced relationships with, involvement of, and outcomes for Indigenous people
Results achieved
As part of the renewed Oceans Protection Plan, the CCG continued work to increase Indigenous co-development, co-management, and co-implementation of initiatives designed to protect Canadian coastal waters and inland waterways. Through programs such as the Coastal Marine Response Network and Integrated Marine Response Planning (IMRP), the CCG seeks to empower Indigenous coastal communities in enhancing their ability to protect culturally-important and environmentally-sensitive marine areas. These initiatives were supported through grants and contribution funding mechanisms providing various levels of support for capacity, planning, training and/or equipment. In 2024-25, the CCG finalized 42 work plans and contribution agreements through IMRP, worth nearly $2.5 million. These agreements directly contributed to enhancing preparedness capacity and advancing collaborative marine response planning with Indigenous partners.
In 2024-25, the CCG also successfully delivered eight Environmental Response Community Caches, known as Community Packs, to the Nunavik and Nunatsiavut regions. The Community Packs consist of pre-positioned shipping containers equipped with essential environmental response tools, such as sorbent boom and shoreline clean-up kits. These caches are integral to the core function of the CCG, enabling faster local response to marine pollution incidents while larger equipment is mobilized from depots, the CCG fleet, or industry partners. The deployment of the remaining 21 Arctic Environmental Response Community Caches is scheduled for completion by the end of the 2025 Arctic season.
The Canadian Coast Guard College worked on implementing the Continuum of Support for Indigenous Learners (CSIL) initiative. This initiative engages Indigenous voices in dialogue to examine barriers to Indigenous recruitment and to the Canadian Coast Guard College, as well as building support tools to help increase the retention of Indigenous employees. The CCG engaged with Indigenous community members and leaders to develop an Action Plan and a Statement of Work to formalize the role of a Mi’kmaq Hereditary Chief as founding member to guide the implementation process.
In 2024-25, the College began a phase II of the CSIL action plan, to review, prioritize, and address the 70 recommendations submitted to the College in the Phase I report. The College also began development of a Cultural Awareness Training program intended for all personnel. A Training Advisory Group (TAG), with representation from each Coast Guard region, was established to guide the development of the course.
Through the Community Engagement Coordinators (CEC) initiative and the Indigenous Participation and Training (IPT) program, the CCG’s Arctic Region made strides in reducing barriers for Indigenous employees and increasing representation. In 2024-25, CCG-DFO Arctic Regions hired five CECs, all of whom are located in their communities (Yellowknife, Iqaluit, Makkovik, Pangnirtung and Tuktoyaktuk).The CCG also hired four Indigenous deckhands through the IPT program.
In the spirit of partnership, the CCG worked in collaboration with Inuit Tapiriit Kanatami to name both the future polar icebreakers, the CCGS Arpatuuq and CCGS Imnaryuaq, as well as the offshore oceanographic science vessel, CCGS Naalak Naappaluk.
Resources required to achieve results
Table 19: Snapshot of resources required Marine Operations and Response
Table 19 provides a summary of the planned and actual spending and full-time equivalents required to achieve results.
| Resource | Planned | Actual |
|---|---|---|
| Spending | $2,182,367,818 | $2,371,659,831 |
| Full-time equivalents | 4,611 | 4,715 |
The Finances section of the Infographic for Fisheries and Oceans Canada on GC Infobase page and the People section of the Infographic for Fisheries and Oceans Canada on GC Infobase page provide complete financial and human resources information related to its program inventory.
Related government-wide priorities
This section highlights government priorities that are being addressed through this core responsibility.
Gender-based Analysis Plus
The Canadian Coast Guard College is the centre of excellence for CCG operational training that educates the marine professionals needed to deliver CCG programs in support of marine safety, security, and environmental protection. The College applies a GBA Plus lens to course creation and delivery and continually strives to ensure training materials are developed to represent diversity and gender equality. As part of its recruitment strategy, the College will continue to implement initiatives to aid in the recruitment of under-represented groups into the CCG, including the Indigenous Participation and Training initiative.
Advancing its commitment to inclusive recruitment, the College engaged under-represented groups, particularly Indigenous communities and women in 2024-25. It participated in national and local Indigenous-focused events, partnered with the Mi’kmaq Employment Training Secretariat for outreach in Membertou, and hosted a culturally-enriched summer camp for Eskasoni youth led by residential school survivors. The unveiling of an Indigenous Gathering Space further emphasized the College’s dedication to cultural inclusion. Efforts to increase women’s recruitment were made by participation in initiatives like Techsploration and “Les filles et les sciences,” that are designed to empower women in science and engineering fields. In addition to these initiatives, the CCG partnered with Canadian Geographic Education, Qalipu Mi’kmaq First Nation, and Miawpukek First Nation to launch the Open Waters Youth Education Program. The program is aimed at inspiring youth, especially in remote and underserved communities, through an interactive digital hub and culturally relevant content that was co-developed with Indigenous partners. Youth workshops and expeditions were planned to deepen engagement and foster long-term impact.
United Nations 2030 Agenda for Sustainable Development and the Sustainable Development Goals
More information on DFO’s contributions to Canada’s Federal Implementation Plan on the 2030 Agenda and the Federal Sustainable Development Strategy can be found in our Departmental Sustainable Development Strategy.
Innovation
In support of Canada’s Greening Government Strategy, the CCG continued to seek innovative solutions to reduce the environmental footprint of its fleet while continuing to provide essential services to Canadians across the country. The CCG’s Fleet Decarbonization plan was approved by the Commissioner and delivered to the Treasury Board of Canada Secretariat’s Centre for Greening Government in March 2025 with publishing scheduled for 2025-26. The plan is the foundation for all decarbonization roadmap objectives and strategies across the CCG.
Keeping with the federal government’s ongoing focus on innovation, the CCG has taken a leadership role in advancing pre-commercial testing initiatives. A task force on AI innovations was established to explore process automation in support of decision-making, surveillance, and reconnaissance, in line with departmental priorities and operational needs. The task force is currently seeking evaluators, and several CCG personnel from various areas of expertise have already volunteered to contribute to this initiative.
The CCG also explored two emerging innovation priorities, namely AI Governance and AI for Greening Government. CCG representatives are expected to participate in these initiatives as they develop, reflecting the organization’s continued commitment to integrating advanced technologies into its operations.
Program inventory
Marine Operations and Response is supported by the following programs:
- Search and Rescue
- Marine Environmental and Hazards Response
- Maritime Security
- Fleet Operational Capability
- Fleet Maintenance
- Fleet Procurement
- Canadian Coast Guard College
Additional information related to the program inventory for Marine Operations and Response is available on the Results page on GC InfoBase.
Internal services
Description
Internal services refer to the activities and resources that support a department in its work to meet its corporate obligations and deliver its programs. The 10 categories of internal services are:
- Management and Oversight Services
- Communications Services
- Legal Services
- Human Resources Management
- Financial Management
- Information Management
- Information Technology
- Real Property
- Materiel
- Acquisitions
Progress on results
This section presents details on how the Department performed to achieve results and meet targets for internal services.
DFO-CCG is a large department with a wide variety of activities and responsibilities, and internal services support all programs to ensure that they have the resources needed to effectively and efficiently provide services to Canadians. Guided by government-wide priorities and internal action plans, the Department implemented key measures to support equity and inclusion and reconciliation with Indigenous Peoples, and ensure compliance with official language requirements while being innovative. This implementation work reflected a continued commitment to modernizing public service delivery, fostering a representative and inclusive workforce, and strengthening relationships with Indigenous communities, all while ensuring responsible use of public resources and improving outcomes for Canadians. The following are some of the Department’s achievements for 2024–25.
Efficiency and Accountability
Results achieved
In 2024-25, DFO developed its forward-looking AI strategy, aimed at leveraging the transformative potential of AI to enhance service delivery, improve operational efficiency, and responsibly harness AI technologies to drive innovation. This strategy outlines clear actions and deliverables to help DFO adopt AI responsibly and effectively. It aims to build public trust while supporting the Government of Canada’s goal of creating a more innovative, efficient workplace that delivers world-class services.
The Department implemented and enhanced national-level governance structures and accountability measures over financial management and reporting practices. These measures are designed to help adapt to emerging priorities, streamline and integrate services across the country, and ensure consistent service delivery while achieving cost efficiency.
To further improve operational efficiency, the Department leveraged artificial intelligence (AI) to automate invoice processing. This improved invoice routing and reduced manual data entry, resulting in more timely payments to businesses and efficiency gains for DFO.
DFO’s Enterprise Data Hub serves as a central repository where analytics workspaces are now available on demand, enabling data scientists to collaborate and develop AI models more efficiently. An analytics workspace is a protected, cloud-based digital environment that allows teams like data scientists and analysts to collaboratively explore, manipulate, and report on data, as well as develop AI and machine learning solutions using tools that meet DFO’s security and governance standards. This setup enhances productivity and accelerates data insight initiatives. In parallel, efforts are being made to implement an AI model management and deployment platform, which will provide robust governance and continuous monitoring to ensure models remain effective, reliable, and ethically sound over time.
DFO engaged in pilot projects to employ innovative techniques to convert paper-based documents into searchable, structured digital data formats, enabling faster access to critical information, improved data quality, and more efficient analysis to support science, conservation, and management decisions. In 2024-25, approximately 48,000 documents were digitized. This transformation helps modernize business processes and ensures long-term preservation and usability of valuable data collected by the Department for decision-making.
Innovation
Results achieved
As part of its work to develop innovative solutions, DFO successfully launched the Elver Monitoring and Traceability System (EMT) on March 1, 2025. The EMT application is a modern digital solution, accessible via computer, tablet, or cell phone, that enables fishing, possession, and export license holders to comply with their reporting requirements. It allows DFO to maintain oversight of monitoring, traceability, and enforcement of compliance across the elver supply chain, thereby reducing unlawful harvesting in support of a more sustainable and resilient elver fishery. As an integral part of the 2025 elver season, EMT played a key role in supporting harvesters' active participation in the fishery by allowing streamlined reporting.
Innovative tools to support catch and effort monitoring have the potential not only to modernize how vital information is collected to effectively manage fish resources, but also to provide near real-time access to data needed for timely decision making. Along with innovations to enhance and streamline data capture in other areas of the Department’s work, these digital solutions have revolutionized how DFO operates and provides services.
Inclusion, diversity, equity, and accessibility
Results achieved
To support and improve its delivery of services to Canadians, the Department continued to identify, reduce, and eliminate barriers to employment, and implemented intentional measures to recruit, retain, and provide career progression to support designated employment equity groups and equity-seeking groups (such as women, Black and other racialized groups, Indigenous Peoples, persons with disabilities, and 2SLGBTQIA+ communities). The Department was guided in this work by the 2022 Employment Systems Review; its Employment Equity, Diversity and Inclusion Action Plan; its Accessibility Action Plan 2022-2025; and the Clerk of the Privy Council’s Call to Action on Anti-Racism, Equity, and Inclusion in the Federal Public Service.
The Department implemented the 2023-2027 Employment Equity, Diversity and Inclusion Action Plan (EEDIAP), which renewed the commitment to creating a representative workforce and an inclusive culture where employees with diverse backgrounds and abilities are given equal opportunities and are valued for their differences. Key Performance Indicators were developed to measure the success of the EEDIAP and identify areas needing further focus and efforts.
The Department developed new training and continued to deliver existing mandatory training to employees on accessibility, Indigenous cultural awareness, and 2SLGBTQIA+ inclusion in the workplace. For example, over 500 executives and managers participated in new training on 2SLGBTQIA+ and inclusive hiring that enhanced their awareness of their responsibilities in fostering inclusive practices and promoting a supportive work culture.
DFO launched an awareness campaign for inclusivity in washrooms, an initiative that responds, in part, to the Clerk's Call to Action, the Accessible Canada Act, and the Canadian Labour Code. Addressing barriers in the Department’s facilities is part of fostering a safe, respectful, and inclusive public service.
In 2024-25, the Department made significant progress in achieving the goals of its 2022-2025 Accessibility Action Plan. Key achievements include closing representation gaps, establishing accessibility governance, raising disability awareness, and enhancing knowledge of shared responsibilities and obligations. In collaboration with the Canada School of Public Service, the Department also hosted a public service-wide event for International Day of Persons with Disabilities, drawing over 5,300 registrants. These achievements reflect a culture of inclusion and leadership and a sustained commitment to accessibility.
The Department also completed reviews of its hiring processes, communication practices and technologies, and facilities. The resulting mitigation actions and improvement plans will help ensure that all Canadians, including persons with disabilities, will have equitable opportunities for employment with the Department and improved access to its programs, services, information and facilities.
Official Languages
Results achieved
In partnership with Canadian Heritage, the Treasury Board of Canada Secretariat, and the Office of the Commissioner of Official Languages, the Department reaffirmed its commitment to ensure compliance with the Official Languages Act (OLA) and respect of its obligations and equal rights in the use of both official languages. A $1.7 million investment in second-language training was made to support employees learning and maintaining proficiency in their second official language. This training helped ensure that language of work rights are respected, the needs of linguistic minority communities are considered, and quality bilingual services are delivered to Canadians.
Internal collaboration across the Department was strengthened to further ensure all communications are consistently bilingual and of equal quality so that Canadians may access DFO’s services in the official language of their choice. In preparation for the coming into force of the modernized Official Languages Act on June 20, 2025, DFO undertook a robust and proactive approach to ensure compliance across the organization. Through targeted communications, outreach, and educational initiatives, the Department raised awareness of the importance of linguistic duality, emphasizing its role in fostering inclusivity and respecting Canada’s rich bilingual heritage. These efforts helped cultivate a workplace culture that embraces both official languages and champions the values enshrined in the modernized Act.
Reconciliation with Indigenous Peoples
Results achieved
The recognition and implementation of Indigenous rights is central to advancing the vital work of reconciliation. DFO continued to pursue reconciliation objectives, including the need to make transparent decisions in collaboration and partnership with Indigenous communities.
The Department worked with five First Nation organizations representing 37 First Nations to co-design and participate in workshops and engage to develop shared understandings around Indigenous data sovereignty needs, barriers, and priorities for Indigenous communities and organizations to advance two action plan measures (APM) from the UNDA Action Plan: APM 30 – Indigenous Data Sovereignty and APM 40 – integrating Indigenous Knowledge into the management of fisheries, fish habitat, conservation, marine safety, and protection of the marine environment.
In 2024-25, DFO-CCG also continued to advance its commitment to Indigenous self-determination and regional governance in the Arctic. In April 2024, DFO-CCG completed the next phase of implementing the Arctic Region by fully transferring core programs, services, personnel, and funding from previously split administrative regions – Central Arctic, Newfoundland and Labrador, and Quebec – into a unified Arctic Region. To strengthen Indigenous governance, the Department established regional governance frameworks and tables with several Indigenous partners. Multi-year funding agreements with Inuit Tapiriit Kanatami, Inuit Circumpolar Council Canada, and the four Inuit Treaty Organizations were signed for a total of $10.7 million from 2023 to 2028 to support the operationalization of national and regional co-governance tables and Inuit capacity to collaborate with the Department. DFO also participated in ongoing engagement and relationship-building through the DFO-CCG-Inuit Arctic Region Committee, a co-governance body that ensures Inuit leadership in shaping decisions that reflect their priorities, needs, and community realities.
DFO and the CCG also continued to increase capacity and economic opportunities in the north for Inuit, First Nations, and Métis through the renewal of the Community Engagement Coordinators initiative. In 2024-25, the Department staffed six Indigenous community-based liaisons in Arctic communities to support community engagement and information sharing on the Department’s programs and services.
In keeping with the spirit of strengthening the relationship between the Inuit and the Government of Canada, the CCG and DFO also continued participation in the Government of Canada’s work with the Inuit-Crown Partnership Committee on co-developing an implementation plan for the Inuit Nunangat Policy (INP), including completing environmental scans and training on the INP with Crown–Indigenous Relations and Northern Affairs Canada. The CCG also completed an analysis of the intersections between the INP and the UNDA, which will inform implementation approaches and priorities with respect to both.
As part of its work to create an inclusive and culturally respectful work environment, the CCG established Indigenous Gathering Spaces located at national headquarters and at the CCG College. These spaces support and celebrate Indigenous representation, learning, and engagement and are accessible to all employees. Knowledgeable employees help create better and more inclusive policies, reduce systematic barriers faced by Indigenous Peoples, and build public trust.
DFO introduced and promoted reconciliation-related cultural competency training. This ongoing work of embedding fundamental knowledge leads to public services that are more informed, respectful, and responsive to Indigenous histories and realities. This strengthens trust, reduces systemic barriers, and contributes to a more inclusive and equitable Canada.
Greening government and climate resiliency
Results achieved
In support of the Government’s Greening Government Strategy and the Federal Sustainable Development Strategy, the Department improved climate resiliency by collecting of Climate Change Vulnerability Index data for key coastal and inland sites and by completing of a new crib wharf at the Bedford Institute of Oceanography. The wharf was designed with future climate impacts in mind: it incorporates elevated structures, durable materials, and low-carbon construction practices to enhance its long-term sustainability and reduce its environmental impact.
DFO also implemented greening projects at various sites such as installing electric vehicle chargers, installing solar photovoltaic systems, and signing renewable electricity agreements and energy performance contracts. Notably, the Department’s St. Lewis Conservation and Protection Office and Warehouse received a zero-carbon building performance certification for its enhanced energy efficiency and use of sustainable building materials.
Following government-wide policy and guidance, the Department used hybrid electric vehicles and zero emission vehicles for 92 per cent of all new 2024-25 light-duty deliveries, which was a significant increase from the previous year’s 25 per cent. The Department also completed the centralization of the vehicle fleet budget, which will improve coordination of vehicle replacement planning and assist in achieving the Treasury Board mandate for greening government.
The Department also worked to improve both its environmental sustainability and cost-effectiveness through initiatives to make more efficient use of cell phones and printers.
All of this work contributed to reducing the risks posed by climate change, reducing greenhouse gas emissions, and supporting the Government’s environmental goals while ensuring continued delivery of the Department’s programs and services to Canadians.
Resources required to achieve results
Table 20: Resources required to achieve results for internal services this year
Table 20 provides a summary of the planned and actual spending and full-time equivalents required to achieve results.
| Resource | Planned | Actual |
|---|---|---|
| Spending | $629,222,501 | $602,705,639 |
| Full-time equivalents | 2,259 | 2,573 |
The Finances section of the Infographic for Fisheries and Oceans Canada on GC Infobase page and the People section of the Infographic for Fisheries and Oceans Canada on GC Infobase page provide complete financial and human resources information related to its program inventory.
Contracts awarded to Indigenous businesses
Government of Canada departments are required to award at least 5% of the total value of contracts to Indigenous businesses every year.
Fisheries and Oceans Canada’s results for 2024-25:
Table 21: Total value of contracts awarded to Indigenous businesses1
As shown in Table 21, Fisheries and Oceans Canada awarded 6.01% of the total value of all contracts to Indigenous businesses for the fiscal year.
| Contracting performance indicators | 2024-25 Results |
|---|---|
| Total value of contracts awarded to Indigenous businesses2 (A) | $41,634,549.97 |
| Total value of contracts awarded to Indigenous and non‑Indigenous businesses (B) | $8,963,821,517.70 |
| Value of exceptions approved by deputy head (C) | $8,271,039,374.88 |
| Proportion of contracts awarded to Indigenous businesses [A / (B−C) × 100] | 6.01% |
1A Contract is a binding agreement for the procurement of a good, service, or construction and does not include real property leases. It includes contract amendments and contracts entered into by means of acquisition cards of more than $10,000.00.
2For the purposes of the minimum 5% target, the data in this table reflects how Indigenous Services Canada (ISC) defines “Indigenous business” as either:
- owned and operated by Elders, band and tribal councils
- registered in the Indigenous Business Directory
- registered on a modern treaty beneficiary business list
In its 2025–26 Departmental Plan, DFO estimated that it would award 5% of the total value of its contracts to Indigenous businesses by the end of 2024–25.
As part of its 2024–25 Indigenous procurement planning exercise, the Department submitted the following three spending categories for exemption from the 5% Indigenous procurement target, each approved by the Deputy Minister. (In accordance with guidance from ISC and the Directive on the Management of Procurement, departments may seek exemptions for spending categories that are not reasonably accessible to Indigenous businesses.)
- Ships and boats: No Indigenous supplier capacity in this category of shipbuilding
- Protection services: The Canadian Corps of Commissionaires received a long-standing exemption from competition and right of first refusal for Guard Services
- Road motor vehicles: The Directive on the Management of Materiel states that all purchases of land vehicles must be exercised through Public Services and Procurement Canada’s established methods of supply
The Department was required to award a minimum of 5% of its total contract value to Indigenous businesses by fiscal year 2024-25. The Department has exceeded the target, awarding 6.01% of its total contract value to Indigenous businesses, demonstrating its commitment to economic reconciliation and inclusive procurement.
The Department continues to implement a range of measure to meet and exceed the minimum 5% of total contract value with Indigenous businesses:
- Strategic planning and oversight
- Indigenous Procurement Plan: DFO developed a 2024–25 Indigenous Procurement Plan to guide annual targets and align procurement with sector-specific opportunities, ensuring readiness and accountability
- Monitoring and escalation: Senior management regularly reviews progress, enabling timely interventions to address barriers
- Data integrity: Indigenous business eligibility is verified using the Indigenous Business Directory, and procurement trends are analyzed to identify gaps and improve alignment
- Capacity building and training
- Mandatory training: All procurement staff complete the Indigenous Considerations in Procurement course
- Internal awareness: DFO delivers regular Indigenous procurement training and maintains job aids and reports to support culturally-informed procurement practices
- Outreach to Indigenous business and communities: DFO engages Indigenous businesses through events like reverse trade shows and national conferences, which build mutual awareness and understanding of market capacity
- Inclusive Procurement Practices
- Set-asides and participation plans: Indigenous set-asides are used where possible, and participation plans are included in major procurements
- Early engagement: Procurement teams collaborate with business owners early to identify Indigenous business opportunities
- Attestation requirement: Contracting authorities must confirm Indigenous businesses were considered and justify exclusions. This documentation is to remain with the procurement file
Spending and human resources
In this section
Spending
This section presents an overview of the Department's actual and planned expenditures from 2022–23 to 2027–28, including the Canadian Coast Guard.
Refocusing Government Spending
In Budget 2023, the government committed to reducing spending by $14.1 billion over five years, starting in 2023–24, and by $4.1 billion annually after that.
As part of meeting this commitment, Fisheries and Oceans Canada identified the following spending reductions.
- 2024-25: $85,412,750
- 2025-26: $105,165,250
- 2026-27 and after: $135,370,800
During 2024-25, Fisheries and Oceans Canada worked to realize these reductions through the following measures:
- Internal Efficiencies: $40,992,711
- Professional Services: $31,845,450
- Transfer Payments: $3,035,589
- Travel Reduction: $9,539,000
Budgetary performance summary
Table 22: Actual three-year spending on core responsibilities and internal services (dollars)
Table 22 shows the money that Fisheries and Oceans Canada spent in each of the past three years on its core responsibilities and on internal services.
| Core responsibilities and internal services | 2024–25 Main Estimates | 2024–25 total authorities available for use | Actual spending over three years (authorities used) |
|---|---|---|---|
| Fisheries | $1,038,740,576 | $1,349,672,723 |
|
| Aquatic Ecosystems | $458,054,031 | $669,989,713 |
|
| Marine Navigation | $376,795,478 | $425,350,554 |
|
| Marine Operations and Response | $2,182,367,818 | $2,435,543,261 |
|
| Subtotal | $4,055,957,903 | $4,880,556,252 |
|
| Internal services | $629,222,501 | $641,729,739 |
|
| Total | $4,685,180,404 | $5,522,285,991 |
|
Analysis of the past three years of spending
The $769 million increase in expenditures from 2022-23 to 2023-24 is primarily related to spending on the Canadian Coast Guard fleet projects and operations as well as Indigenous programs.
The $669 million increase in expenditures from 2023-24 to 2024-25 is primarily related to spending on the Canadian Coast Guard fleet projects and the Great Bear Sea Initiative.
The Finances section of the Infographic for Fisheries and Oceans Canada on GC Infobase offers more financial information from previous years.
Table 23: Planned three-year spending on core responsibilities and internal services (dollars)
Table 23 shows Fisheries and Oceans Canada’s planned spending for each of the next three years on its core responsibilities and on internal services.
| Core responsibilities and internal services | 2025–26 planned spending | 2026–27 planned spending | 2027–28 planned spending |
|---|---|---|---|
| Fisheries | $1,410,375,899 | $1,026,787,409 | $743,953,662 |
| Aquatic Ecosystems | $660,911,204 | $229,148,365 | $186,976,625 |
| Marine Navigation | $385,176,621 | $316,848,601 | $288,438,910 |
| Marine Operations and Response | $2,979,891,314 | $3,512,918,336 | $3,231,123,629 |
| Subtotal | $5,436,355,038 | $5,085,702,711 | $4,450,492,826 |
| Internal services | $616,192,140 | $537,053,391 | $523,838,378 |
| Total | $6,052,547,178 | $5,622,756,102 | $4,974,331,204 |
Analysis of the next three years of spending
The ($430) million decrease in planned spending from 2025-26 to 2026-27 is primarily related to:
- planned changes to Indigenous programs to reflect the ongoing nature of negotiations and planned completion of associated agreements
- planned changes in funding for the Pacific Salmon Strategy Initiative
The ($648) million decrease in planned spending from 2026-27 to 2027-28 is primarily related to:
- planned changes in funding for Canadian Coast Guard fleet projects
- planned changes in funding for the Small Craft Harbour Program
- planned changes in funding related to the Oceans Protection Plan
The Finances section of the Infographic for Fisheries and Oceans Canada on GC Infobase offers more detailed financial information related to future years.
Table 24: Budgetary actual gross spending summary (dollars)
Table 24 reconciles gross planned spending with net spending for 2024–25.
| Core responsibilities and internal services | 2024–25 actual gross spending | 2024–25 actual revenues netted against expenditures | 2024–25 actual net spending (authorities used) |
|---|---|---|---|
| Fisheries | $1,248,016,428 | - | $1,248,016,428 |
| Aquatic Ecosystems | $650,678,379 | - | $650,678,379 |
| Marine Navigation | $388,580,765 | $46,609,988 | $341,970,776 |
| Marine Operations and Response | $2,371,659,831 | - | $2,371,659,831 |
| Subtotal | $4,658,935,403 | $46,609,988 | $4,612,325,415 |
| Internal services | $602,705,639 | - | $602,705,639 |
| Total | $5,261,641,042 | $46,609,988 | $5,215,031,054 |
Analysis of budgetary actual gross spending summary
For certain services, the Canadian Coast Guard collects service fees to ensure that, where appropriate, the entire cost of delivering the service is not borne by taxpayers. Fees for icebreaking, marine navigation, and dredging support the safe navigation of Canadian waters.
The Finances section of the Infographic for Fisheries and Oceans Canada on GC Infobase offers information on the alignment of Fisheries and Oceans Canada’s spending with Government of Canada’s spending and activities.
Funding
This section provides an overview of the Department's voted and statutory funding for its core responsibilities and for internal services. It includes the Canadian Coast Guard. Consult the Government of Canada budgets and expenditures for further information on funding authorities.
Graph 1 summarizes the Department's approved voted and statutory funding from 2022-23 to 2027-28.
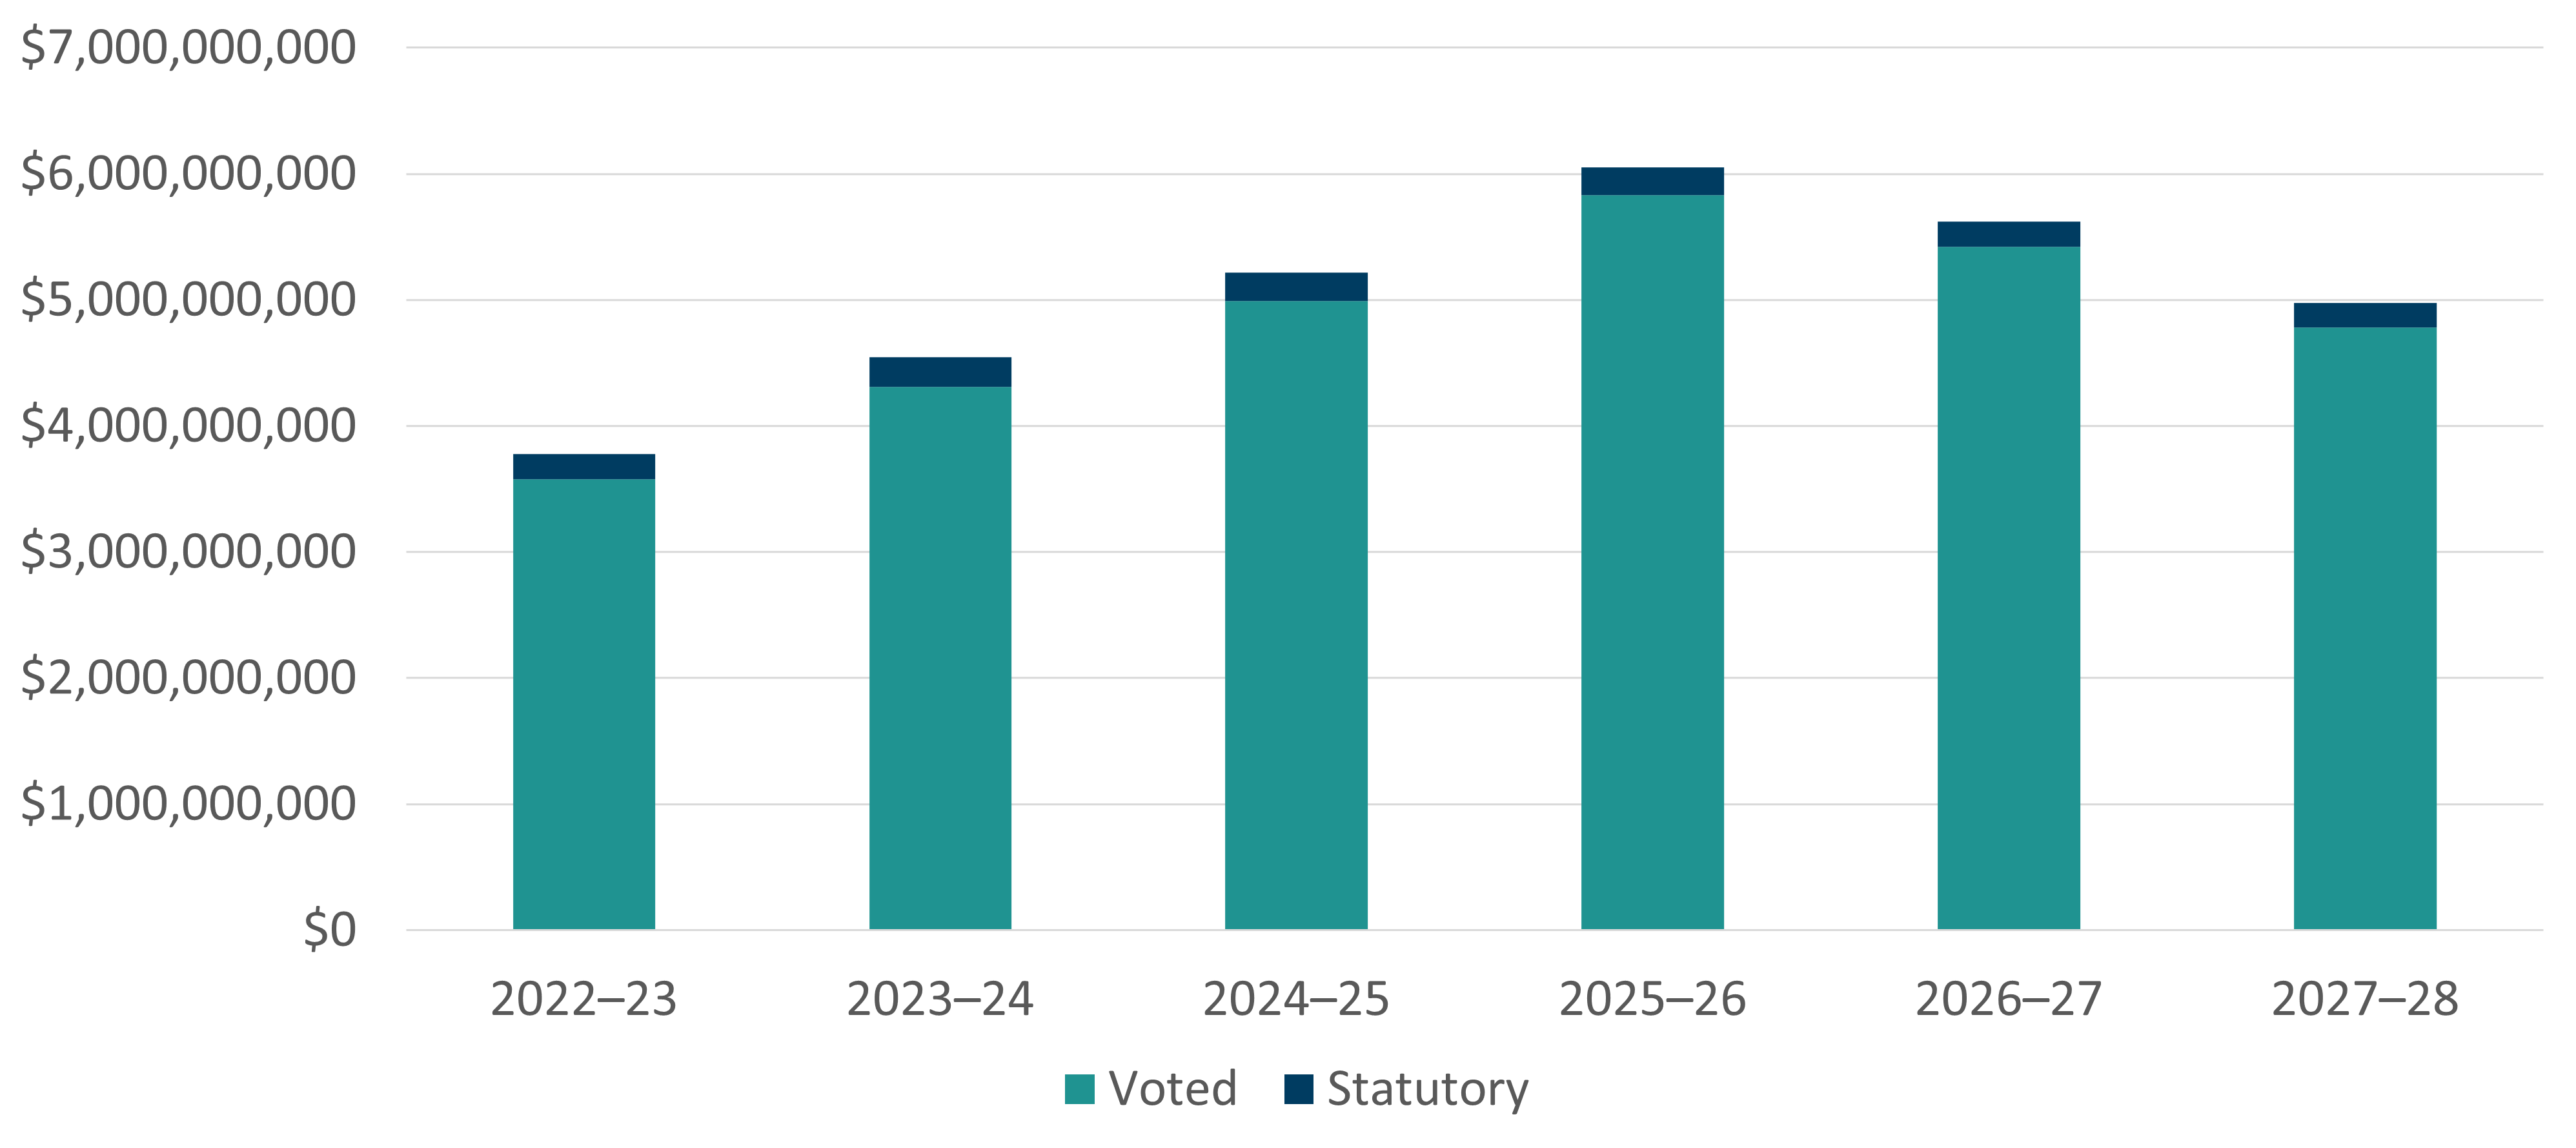
Text version of graph 1
Graph 1 includes the following information in a bar graph:
| Fiscal year | Statutory | Voted | Total |
|---|---|---|---|
| 2022-23 | $196,901,057 | $3,579,926,693 | $3,776,827,749 |
| 2023-24 | $236,618,702 | $4,309,443,705 | $4,546,062,407 |
| 2024-25 | $224,946,353 | $4,990,084,701 | $5,215,031,054 |
| 2025-26 | $221,973,428 | $5,830,573,750 | $6,052,547,178 |
| 2026-27 | $199,190,574 | $5,423,565,528 | $5,622,756,102 |
| 2027-28 | $195,143,911 | $4,779,187,293 | $4,974,331,204 |
Analysis of statutory and voted funding over a six-year period
The difference between actual and planned spending is mainly attributable to timeline changes in the completion of projects, which cause unspent funding to be carried forward to future years, as well as in-year funding not yet received for 2025-26 through 2027-28 fiscal years such as Supplementary Estimates. See detailed analysis under tables above for significant year-over-year variances.
Consult the Public Accounts of Canada for further information on Fisheries and Oceans Canada’s departmental voted and statutory expenditures.
Financial statement highlights
Fisheries and Oceans Canada’s Financial Statements (Unaudited) for the Year Ended March 31, 2025.
The financial statement highlights presented in this Departmental Results Report are intended to serve as a general overview of DFO’s Condensed Statement of Operations and Condensed Statement of Financial Position as presented in Fisheries and Oceans Canada’s unaudited financial statements. These financial statements are prepared in accordance with accrual accounting principles and, therefore, are different from the figures provided in other sections of this Departmental Results Report and information published in the Public Accounts of Canada, which are prepared on appropriation-based reporting.
Table 25: Condensed Statement of Operations (unaudited or audited) for the year ended March 31, 2025 (dollars)
Table 25 summarizes the expenses and revenues for 2024–25 which net to the cost of operations before government funding and transfers.
| Financial information | 2024–25 actual results | 2024–25 planned results | Difference (actual results minus planned) |
|---|---|---|---|
| Total expenses | 3,953,310,718 | 3,418,391,025 | 534,919,693 |
| Total revenues | 45,909,939 | 40,011,000 | 5,898,939 |
| Net cost of operations before government funding and transfers | 3,907,400,779 | 3,378,380,025 | 529,020,754 |
Analysis of expenses and revenues for 2024-25
The 2024–25 planned results information is provided in Fisheries and Oceans Canada’s Future-Oriented Statement of Operations and Notes 2024–25.
Total actual expenses for 2024-25 were $534.9 million higher than planned results mainly due to increases in transfer payment programs and increased in write-offs of tangible capital assets.
The total actual revenues for 2024-25 were $5.9 million higher than the planned results due to higher revenues for marine navigation services fees, icebreaking services fees, and maintenance dredging service fees.
Table 26: Condensed Statement of Operations (unaudited or audited) for 2023-24 and 2024-25 (dollars)
Table 26 summarizes actual expenses and revenues and shows the net cost of operations before government funding and transfers.
| Financial information | 2024–25 actual results | 2023–24 actual results | Difference (2024–25 minus 2023–24) |
|---|---|---|---|
| Total expenses | 3,953,310,718 | 3,921,196,412 | 32,114,306 |
| Total revenues | 45,909,939 | 46,117,067 | (207,128) |
| Net cost of operations before government funding and transfers | 3,907,400,779 | 3,875,079,345 | 32,321,434 |
Analysis of differences in expenses and revenues between 2023-24 and 2024-25
Graph 2 summarizes the Department's expenses by core responsibility in 2024-25.
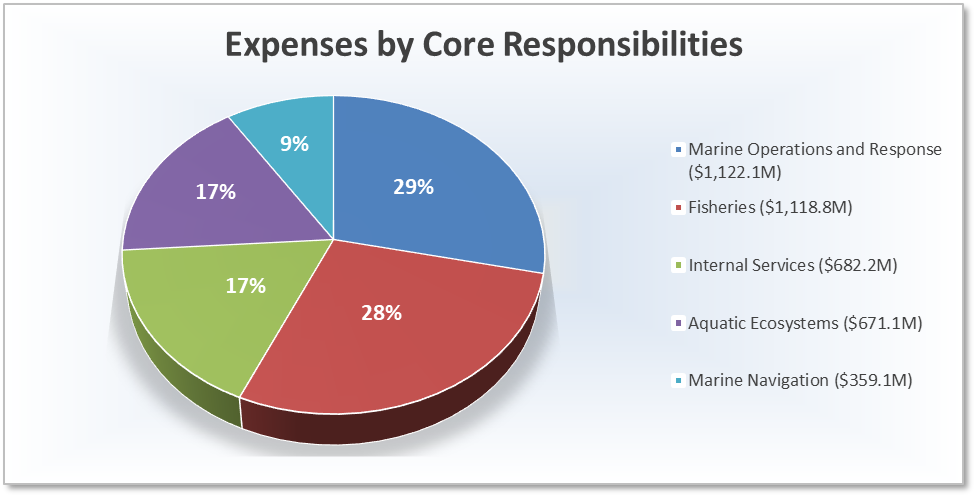
Text description of graph 2
Graph 2 includes the following information in a pie chart:
| Core Responsibility | Percentage of departmental expenses |
Expenses (in millions of dollars) |
|---|---|---|
| Fisheries | 28% | $1,118.8 |
| Aquatic Ecosystems | 17% | $671.1 |
| Marine Navigation | 9% | $359.1 |
| Marine Operations and Response | 29% | $1,122.1 |
| Internal services | 17% | $682.2 |
Total expenses in support of Fisheries and Oceans Canada’s programs and services were $3,953.3 million in 2024-25, an increase of $32.1 million or 0.8% when compared to the previous year’s total expenses of $3,921.2 million.
The maintenance of a relatively stable total expenditure level is in line with initiatives related to refocusing government spending. The significant variances in expenditures are mainly attributed to an increase in transfer payments of $175.4 million and an increase of other expenses of $76.3 million including write-offs of tangible capital assets, mostly ships and boats and an increase in amortization expense of $22.3 million in line with recent acquisitions. These increases are mostly offset by a decrease in salaries and employee benefits of $109.4 million, a decrease in expenses for claims and litigation of $91.8 million, a decrease in utilities, materials, supplies and fuel of $31.5 million and a decrease in professional and special services of $12.5 million.
Total actual revenues were $45.9 million in 2024-25, a decrease of $0.2 million or 0.4% when compared to the previous year’s total actual revenues of $46.1 million.
Table 27: Condensed Statement of Financial Position (unaudited or audited) as at March 31, 2025 (dollars)
Table 27 provides a brief snapshot of the amounts the Department owes or must spend (liabilities) and its available resources (assets), which helps to indicate its ability to carry out programs and services.
| Financial information | Actual fiscal year (2024–25) | Previous fiscal year (2023–24) | Difference (2024–25 minus 2023–24) |
|---|---|---|---|
| Total net liabilities | 2,221,980,748 | 2,279,392,265 | (57,411,517) |
| Total net financial assets | 793,618,629 | 793,391,377 | 227,252 |
| Departmental net debt | 1,428,362,119 | 1,486,000,888 | (57,638,769) |
| Total non-financial assets | 10,166,130,104 | 8,732,007,743 | 1,434,122,361 |
| Departmental net financial position | 8,737,767,985 | 7,246,006,855 | 1,491,761,130 |
Analysis of department’s liabilities and assets since last fiscal year
Graph 3 summarizes the Department's net liabilities by type in 2024-25.

Text description of graph 3
Graph 3 includes the following information in a pie chart:
| Type of net liability | Percentage of departmental liabilities |
Net liabilities (in millions of dollars) |
|---|---|---|
| Accounts payable and accrued liabilities | 34% | $750.5 |
| Contingent liabilities | 23% | $509.9 |
| Asset retirement obligations | 19% | $432.0 |
| Environmental liabilities | 14% | $307.5 |
| Vacation and compensatory leave | 7% | $147.4 |
| Other liabilities | 2% | $45.3 |
| Employee future benefits | 1% | $29.4 |
Total net liabilities were $2,222.0 million as at March 31, 2025, a decrease of $57.4 million or 2.5% when compared to the previous year’s balance of $2,279.4 million. The decrease is mainly attributed to a decrease in environmental liabilities and asset retirement obligations of $67.9 million due to project cost adjustments, interest rate fluctuations, and divestitures of assets. Additional decreases are mainly attributable to decreases in external accounts payable and accrued liabilities of $6.0 million, decreases in vacation pay and compensatory leave of $3.9 million, and decreases of $12.4 M in other liabilities mostly related to federal-provincial partnerships. These decreases are mostly offset by an increase in contingent liability allowances of $33.1 million.
Total net financial assets were $793.6 million as at March 31, 2025, an increase of $0.2 million or 0.0% when compared to the previous year’s balance of $793.4 million.
Total non-financial assets were $10,166.1 million as at March 31, 2025, an increase of $1,434.1 million or 16.4% when compared to the previous year’s balance of $8,732.0 million. The increase is mainly due to a net increase in tangible capital assets of $1,201.0 million and in prepaid expenses ($224.3 million).
Human resources
This section presents an overview of the Department’s actual and planned human resources from 2022–23 to 2027–28.
Table 28: Actual human resources for core responsibilities and internal services
Table 28 shows a summary in full-time equivalents of human resources for Fisheries and Oceans Canada’s core responsibilities and for its internal services for the previous three fiscal years.
| Core responsibilities and internal services | 2022–23 actual full-time equivalents | 2023–24 actual full-time equivalents | 2024–25 actual full-time equivalents |
|---|---|---|---|
| Fisheries | 3,734 | 3,822 | 3,882 |
| Aquatic ecosystems | 2,010 | 1,994 | 1,997 |
| Marine Navigation | 1,794 | 1,784 | 1,713 |
| Marine Operations and Response | 4,594 | 4,714 | 4,715 |
| Subtotal | 12,132 | 12,314 | 12,307 |
| Internal services | 2,549 | 2,543 | 2,573 |
| Total | 14,681 | 14,857 | 14,880 |
Analysis of human resources for the last three years
The 176 FTE variance between 2022-23 and 2023-24 is due to a planned reduction in funding to the Canadian Coast Guard fleet projects.
The 23 FTE increase between 2023-24 and 2024-25 is primarily related to planned changes to in-year funding.
Table 29: Human resources planning summary for core responsibilities and internal services
Table 29 shows the planned full-time equivalents for each of Fisheries and Oceans Canada’s core responsibilities and for its internal services for the next three years, including the Canadian Coast Guard. Human resources for the current fiscal year are forecast based on year to date.
| Core responsibilities and internal services | 2025–26 planned full-time equivalents | 2026–27 planned full-time equivalents | 2027–28 planned full-time equivalents |
|---|---|---|---|
| Fisheries | 3,848 | 3,244 | 3,142 |
| Aquatic Ecosystems | 1,920 | 1,233 | 1,161 |
| Marine Navigation | 1,653 | 1,604 | 1,550 |
| Marine Operations and Response | 4,734 | 4,687 | 4,679 |
| Subtotal | 12,155 | 10,768 | 10,532 |
| Internal services | 2,592 | 2,335 | 2,265 |
| Total | 14,747 | 13,103 | 12,797 |
Analysis of human resources for the next three years
The 133 FTE variance between 2024-25 and 2025-26 is due to a planned reduction in funding to the Refocusing Government Spending Initiative, advance reconciliation on Indigenous right and fisheries issues, as well as the Trans Mountain Expansion.
The 1,644 FTE decrease between 2025-26 and 2026-27 is related to a planned reduction in funding related to the Pacific Salmon Strategy Initiative, modernizing the Fisheries Act, Marine Conservation Targets, continued efforts to protect species at risk, as well as funding to protect and promote the health of Canada's priority at-risk whale populations.
Supplementary information tables
The following supplementary information tables are available on Fisheries and Oceans Canada’s website:
- Details on transfer payment programs
- Up-front multi-year funding
- Gender-based Analysis Plus
- Horizontal initiatives
- Response to Parliamentary committees and external audits
- Regulatory and Permitting Efficiency for Clean Growth Projects
Federal tax expenditures
The tax system can be used to achieve public policy objectives through the application of special measures such as low tax rates, exemptions, deductions, deferrals and credits. The Department of Finance Canada publishes cost estimates and projections for these measures each year in the Report on Federal Tax Expenditures. This report also provides detailed background information on tax expenditures, including descriptions, objectives, historical information and references to related federal spending programs as well as evaluations and GBA Plus of tax expenditures.
Corporate information
Departmental profile
Appropriate minister: The Honourable Joanne Thompson, P.C., M.P.
Institutional head: Annette Gibbons, Deputy Minister
Ministerial portfolio: Fisheries and Oceans Canada
Enabling instruments:
- Oceans Act
- Fisheries Act
- Species at Risk Act
- Coastal Fisheries Protection Act
- Fishing and Recreational Harbours Act
- Canada Shipping Act, 2001 (Transport Canada-led)
- Wrecked, Abandoned or Hazardous Vessels Act (Transport Canada-led)
Year of incorporation / commencement: 1979
Departmental contact information
Mailing address:
Fisheries and Oceans Canada
Communications
200 Kent Street
13th Floor, Station 13E228
Ottawa, Ontario K1A 0E6
Telephone: 613-993-0999
TTY: 1-800-465-7735
Fax: 613-990-1866
Email: info@dfo-mpo.gc.ca
Website: http://dfo-mpo.gc.ca/
Definitions
List of terms
- appropriation (crédit)
- Any authority of Parliament to pay money out of the Consolidated Revenue Fund.
- budgetary expenditures (dépenses budgétaires)
- Operating and capital expenditures; transfer payments to other levels of government, departments or individuals; and payments to Crown corporations.
- core responsibility (responsabilité essentielle)
- An enduring function or role of a department. The departmental results listed for a core responsibility reflect the outcomes that the Department seeks to influence or achieve.
- Departmental Plan (plan ministériel)
- A report that outlines the anticipated activities and expected performance of an appropriated department over a 3-year period. Departmental Plans are usually tabled in Parliament in spring.
- departmental priority (priorité)
- A plan, project or activity that a department focuses and reports on during a specific planning period. Priorities represent the most important things to be done or those to be addressed first to help achieve the desired departmental results.
- departmental result (résultat ministériel)
- A high-level outcome related to the core responsibilities of a department.
- departmental result indicator (indicateur de résultat ministériel)
- A quantitative or qualitative measure that assesses progress toward a departmental result.
- departmental results framework (cadre ministériel des résultats)
- A framework that connects the Department’s core responsibilities to its departmental results and departmental result indicators.
- Departmental Results Report (rapport sur les résultats ministériels)
- A report outlining a department’s accomplishments against the plans, priorities and expected results set out in the corresponding Departmental Plan.
- Full-time equivalent (équivalent temps plein)
- Measures the person years in a departmental budget. An employee's scheduled hours per week divided by the employer's hours for a full-time workweek calculates a full-time equivalent. For example, an employee who works 20 hours in a 40-hour standard workweek represents a 0.5 full-time equivalent.
- Gender-based Analysis Plus (GBA Plus) (analyse comparative entre les sexes plus [ACS Plus])
- An analytical tool that helps to understand the ways diverse individuals experience policies, programs and other initiatives. Applying GBA Plus to policies, programs and other initiatives helps to identify the different needs of the people affected, the ways to be more responsive and inclusive, and the methods to anticipate and mitigate potential barriers to accessing or benefitting from the initiative. GBA Plus goes beyond biological (sex) and socio-cultural (gender) differences to consider other factors, such as age, disability, education, ethnicity, economic status, geography (including rurality), language, race, religion, and sexual orientation.
- government priorities (priorités pangouvernementales)
- For the purpose of the 2024–25 Departmental Results Report, government priorities are the high-level themes outlining the government’s agenda as announced in the 2021 Speech from the Throne.
- horizontal initiative (initiative horizontale)
- A program, project or other initiative where two or more federal departments receive funding to work collaboratively on a shared outcome usually linked to a government priority, and where the ministers involved agree to designate it as horizontal. Specific reporting requirements apply, including that the lead department must report on combined expenditures and results.
- Indigenous business (entreprise autochtones)
- For the purposes of a Departmental Result Report, this includes any entity that meets the Indigenous Services Canada’s criteria of being owned and operated by Elders, band and tribal councils, registered in the Indigenous Business Directory or registered on a modern treaty beneficiary business list.
- non-budgetary expenditures (dépenses non budgétaires)
- Net outlays and receipts related to loans, investments and advances, which change the composition of the financial assets of the Government of Canada.
- performance (rendement)
- What a department did with its resources to achieve its results, how well those results compare to what the Department intended to achieve, and how well lessons learned have been identified.
- performance indicator (indicateur de rendement)
- A qualitative or quantitative measure that assesses progress toward a departmental-level or program-level result, or the expected outputs or outcomes of a program, policy or initiative.
- plan (plan)
- The articulation of strategic choices, which provides information on how a department intends to achieve its priorities and associated results. Generally, a plan will explain the logic behind the strategies chosen and tend to focus on actions that lead to the expected result.
- planned spending (dépenses prévues)
- For Departmental Plans and Departmental Results Reports, planned spending refers to the amounts presented in Main Estimates. Departments must determine their planned spending and be able to defend the financial numbers presented in their Departmental Plans and Departmental Results Reports.
- program (programme)
- An Individual, group, or combination of services and activities managed together within a department and focused on a specific set of outputs, outcomes or service levels.
- program inventory (répertoire des programmes)
- A listing that identifies all the Department’s programs and the resources that contribute to delivering on the Department’s core responsibilities and achieving its results.
- result (résultat)
- An outcome or output related to the activities of a department, policy, program or initiative.
- statutory expenditures (dépenses législatives)
- Spending approved through legislation passed in Parliament, other than appropriation acts. The legislation sets out the purpose and the terms and conditions of the expenditures.
- target (cible)
- A quantitative or qualitative, measurable goal that a department, program or initiative plans to achieve within a specified time period.
- voted expenditures (dépenses votées)
- Spending approved annually through an appropriation act passed in Parliament. The vote also outlines the conditions that govern the spending.
- Date modified:
-