
Center of Expertise in Marine Mammalogy
Scientific Research Report
2015-2017
Table of Contents
- Introduction
- Using aerial infrared images to count ringed seals on ice
- The use of unmanned aerial vehicles (UAV)
- 2017: A Marine Mammal Odyssey, Eh!
- Mark-recapture analysis from long-term study on Sable Island identifies changes in demographic rates in northwest Atlantic Grey Seals
- OTN – Using grey seals (Halichoerus grypus) as bioprobes to estimate phytoplankton biomass
- Northwest Atlantic International Sightings Survey (NAISS) of Marine Megafauna on the Continental Shelf From Northern Labrador to the Bay of Fundy
- Monitoring Movements of Whelping Seals on Drifting Pack Ice
- Marine Mammal Genomics Research in the Central and Arctic Region
- OTN and predator-prey interactions
- Listening in on the Deep: Passive Acoustic Monitoring of Whales off Nova Scotia
- Sharing Meals Keeps Killer Whale Families Together: Provisioning relatives maintains long-term social bonds and helps pass on shared genes
- New developments in the use of fatty acids to determine marine mammal diets
- More than a mouthful – unlocking bowhead whale foraging and reproductive histories from baleen
- Observing walrus behaviour at haulout sites in quasi real-time
- Moving towards automated counting
- References
Introduction
The Department of Fisheries and Oceans established the Centre of Expertise in Marine Mammalogy (CEMAM) in 2004 to provide the national expertise required to deliver peer-reviewed, evidence-based science advice and to promote collaboration among researchers across the country. This built upon the history of cooperation among marine mammal scientists that had developed over the years. Since then, CEMAM has increased from approximately 40 professionals to more than 60 people as a result of new investments in science and the government’s new Oceans Protection Plan. New professionals have joined the CEMAM team, building our expertise and bringing a healthy combination of new quantitative skills and enthusiasm to the group.
Early research on marine mammals in Canada focussed on gathering basic data on abundance, vital rates, diet, distribution, and stock delineation. These longer-term programs give insights as to how life-history parameters respond to density-dependence and food resource availability, allowing us to better predict how populations will respond to climate change, establishment of marine protected areas, and industrial impacts. For example, long-term data collected on harp seal, grey seal, and southern resident killer whale have allowed us to identify and understand major mechanisms that are driving population dynamics for these species. From these databases we have learned that harp seals are showing changes in growth rates and reductions in productivity related to a combination of high population densities and factors such as the timing of ice breakup, which in turn has a cascading effect on the abundance of capelin, a primary food resource for harp seals. Grey seal populations have also recovered significantly since the 1960s and similar density-dependent changes have been observed through reductions in juvenile survival. For southern resident killer whales, long-term studies have identified that Chinook salmon abundance remains a major driver in the dynamics of the population. At the same time, our research has expanded beyond the collection of basic data to development of new analytics to improve data analyses, and to more sophisticated studies of habitat selection, ocean noise and the impacts of underwater noise on marine mammals.
Since our last report, advances in technology have resulted in the appearance of new tools in the scientist’s toolbox. Unmanned aerial vehicles (UAVs or drones) were successfully tested in Cumberland Sound, Nunavut to photograph belugas for the collection of life history data, in Atlantic Canada to estimate seal pup production, and to gather information on sea otters in British Columbia. Working with colleagues in Academia, the deployment of acoustic transmitters and receivers on both fish prey and their predators are helping us to gain new insight into potential prey interactions through participation in the Ocean Tracking Network program. Deployments of satellite transmitters equipped with accelerometers provide additional insights into foraging behaviour of marine mammals.
In addition to long-term studies using more traditional biological approaches, the field of acoustics has expanded our ability to monitor the presence of marine mammals within an area 24 hours a day, 365 days a year, and is now providing insights into the occurrence of marine mammals in areas or at times of the year where traditional approaches such as aerial surveys have been difficult to undertake. Such areas include all three of Canada’s oceans, from nearshore to offshore sites. The development of automated call detection algorithms to identify the specific species vocalizations have sped up data processing and our ability to obtain information on distribution of marine mammals from acoustic datasets. Furthermore, the collection of acoustic data allows us to establish baseline noise levels in our oceans, measure how noise levels change with human activities, and better assess potential impacts of noise on marine mammal populations.
Logistical challenges and costs remain a major barrier to conducting research in the north. Often the most difficult challenge is the initial deployment of people, food and equipment. Once deployed, maintaining the field camp is relatively easy. Building on this principle, colleagues in Central and Arctic Region launched a nine week, major field camp in Tremblay Sound, Nunavut, where they were able to deploy satellite transmitters on narwhals to improve our understanding of narwhal stock structure and behaviour in the northern Baffin Island area. The key to the success of this program was due to collaborations with industry, non-governmental organizations, universities, and Inuit (the local knowledge holders). This allowed the project to be expanded into a multidisciplinary research program that included other components of the ecosystem including zooplankton, Arctic char, and Greenland sharks.
One of CEMAM’s strengths is its high level of inter-regional collaboration. In part, this is necessary because marine mammals often straddle regional boundaries, but collaborations often extend further through our survey and research programs, and in response to unusual events. In 2017, 12 North Atlantic Right whale carcasses were detected in the southern Gulf of St Lawrence. New researchers from the Gulf Region joined together with other researchers in CEMAM and coordinated the response to conduct necropsies. Support from the entire Atlantic zone was required to complete the necropsies and obtain biological samples. The Department also developed a surveillance program involving support from all Atlantic regions to coordinate activities and provide staff on aircraft throughout the summer and fall months to search for right whales. There are several additional instances where there has been extensive collaboration among regions, internationally, and with Academia such as the High Arctic Cetacean survey (HACS) conducted in 2013, the North Atlantic International Sighting Survey (NAISS) in 2016, and the Northwest Atlantic harp seal survey and Hudson Bay-Davis Strait walrus surveys in 2017. In 2018, the first ever complete survey of the Pacific waters off the British Columbia coast, involving a combination of ship and aerial platforms, will be undertaken.
In 2017, the Society for Marine Mammalogy held its 22nd biennial conference in Halifax, Nova Scotia. This is the fourth time that the meeting has been held in Canada and the first time in Atlantic Canada. Attended by over 1700 people, the conference was an amazing success and we extend our congratulations to our co-chair from the Maritime Region, Hilary Moors-Murphy, and other members of CEMAM who were part of the conference and scientific committees for an extremely ambitious event.
In this, our fourth report, we have highlighted only a small sample of the wide range of activities undertaken by Department of Fisheries and Oceans marine mammal scientists across the country. We hope you enjoy and learn a little about the fascinating and useful research being carried out within DFO!
Mike Hammill Director, CEMAM Maurice Lamontagne Institute Mont Joli-QC
Using aerial infrared images to count ringed seals on ice
Brent Young and Steve Ferguson
Estimating marine mammal abundance for stock assessment is challenging. The ability of visual observers seated in moving aircraft to reliably detect animals is limited. Although line transect methods can be employed to account for undetected animals, these methods have considerable uncertainty associated with them. Double -platform line transect methods are based on a number of key assumptions that require at least four observers and detailed statistical analysis to estimate and control for bias. To overcome these limitations, aerial and satellite imagery is being used more and more on marine mammal surveys to try to improve estimates by reducing the number of missed animals. However, in the absence of reliable automated detection methods, analysis of aerial survey photographs is very time consuming and is not always practical.
Aerial view of two ringed seal hauled out on the sea-ice in Eclipse Sound in June 2016. Images were taken with an infrared camera (left) and a digital single lens reflex camera (right). Inset shows a close up view of the seals (photos: DFO).
For surveys of seals on ice, recent advances in infrared technology offer one solution to both improve density estimation while reducing human resource needs in conducting surveys and analyzing photographs. To conduct surveys of ringed seals on ice we used a high resolution infrared (IR) camera (FLIR T1030sc) paired with a high resolution digital single lens reflex (DSLR) camera (Nikon D810). Ice seals in the Arctic, like ringed and bearded seals, haul out on ice in spring to molt (change their fur) and are available to be observed from overhead aircraft conducting surveys. When the seals are hauled out on the sea ice, the warmth of their bodies is contrasted against the cold surface of the ice and appears as an obvious ‘hot spot’ in the infrared imagery (see photos). Infrared video files were analysed to identify hot spots of potential seals and the corresponding photographs from the DSLR were checked to verify observations. Using these methods, seals can be efficiently detected with a high level of confidence, meeting the key assumptions of strip-transect analysis and providing considerable advantages over traditional methods. Fisheries and Oceans Canada continues to develop these new methods to allow for more efficient abundance estimation as conservation efforts call for greater frequency and coverage of marine mammal stocks in order to improve assessment.
The use of unmanned aerial vehicles (UAV)
Marianne Marcoux

Aerial photograph taken by DFO team studying belugas in the Churchill River estuary, Manitoba, using an unmanned aerial vehicle. (photo: DFO).
Unmanned aerial vehicles (UAVs), (also called unmanned aircraft systems or drones) have been increasingly used in the study of wildlife populations. They offer a safer, more cost-effective, and quieter alternative to traditional research methods. For marine mammals, the use of UAVs is promising in several aspects of their research such as the development of method to assess the size and the structure of populations, as well as for making direct observation of behaviour.
For several populations of marine mammals in Canada, we assess the size of the population by directly counting the animals from an aircraft or by counting animals on photographs taken from an aircraft. These methods are costly and can be dangerous. UAVs equipped with a camera offers a new platform to perform population assessment at a lower cost in a safer way. While UAVs don’t fly as fast and for as long as a small aircraft, current research focuses on the feasibility of using UAVs to assess population size. In addition, methods for counting animals in photographs are being improved.
In order to manage a population of marine mammals, it is important to know the proportion of males and females in the population as well as the proportion of adults and non-adults. This information can be gathered non-invasively using photographs taken from a UAV. For example, male and female narwhals can be distinguished by the presence of tusks on males (the tusk can be easily seen on aerial photos). We use videos or photos taken from UAVs to determine the proportion of males in the population. Similarly, the proportion of calves can be assessed from the videos and photos, which provide important information about the health of narwhal population.
Videos and cameras attached to UAVs can also be used to observe marine mammal behaviour from a view point that was previously unaccessible and can improve our understanding of marine mammals. For example, using UAV videography, we were able to document for the first time that narwhals use their tusks to feed on small fish at the surface. With this feeding method, narwhals were observed using their tusks to stun a fish and direct it to their mouth. We are also using UAV videography to link behavioural observations with underwater sound recordings. Therefore, we can gain a better understanding of animals’ communication behaviour.
2017: A Marine Mammal Odyssey, Eh!
Hilary Moors-Murphy
The Society for Marine Mammology’s 22nd Biennial Conference on the Biology of Marine Mammals was held at the World Trade and Convention Centre in Halifax, Nova Scotia on October 22nd -29th 2017. This international meeting is the largest marine mammal conference in the world, attracting over 1700 participants from 70 countries to enhance collaboration, share ideas, and improve the quality of research on marine mammals. The 2017 conference was co-chaired by DFO research scientist H. Moors- Murphy, and several DFO staff played important roles in conference preparation as part of the organizing and scientific program committees. More than thirty DFO personnel participated in this meeting, many presenting their research to this international audience to generate awareness and discussion of ongoing work within the Department.
The conference featured six plenary talks, over 450 oral, speed and video presentations, and more than 500 poster presentations; as well as panel discussion sessions, workshops, and networking events. Marine mammal conservation was a central focus throughout the conference, with about quarter of the presentations falling within the conservation theme. A new “Conservation Highlights Series” consisted of dedicated lunchtime discussion sessions on the plight of North Atlantic right whales, vaquita and monk seals. Habitat and distribution, and acoustics and communication were also popular themes.

A packed auditorium for the welcoming address by Parliamentary Secretary to the Minister of Fisheries, Oceans and the Canadian Coast Guard Terry Beech during the conference Opening Ceremonies (photo: Jarrett Corke).
A recurring topic throughout the conference was science communication. An exciting new and well-received presentation format was introduced; video presentations. This presentation format allows scientists to distill information about their research through a short video summary that can also be used as an outreach tool and will be encouraged in future biennial conferences. A panel discussion on “Science Communication for Conservation” provided examples of successes and failures of communicating our science. The well-attended “Canadian Celebration” event was open to the general public and featured marine mammal scientists sharing their stories about conducting research on marine mammals in Canada. This event highlighted the interest of conference participants and the public alike on hearing about the human component of marine mammal science - understanding what is it like to conduct marine mammal research and why marine mammal scientists choose to do the work that they do can generate interest and help communicate our research to a broader audience.
Overwhelming positive feedback from the Society for Marine Mammology’s executive board and conference participants on their 2017 conference experience has been received. This conference was truly a successful odyssey, with a little Canadian flair!
Mark-recapture analysis from long-term study on Sable Island identifies changes in demographic rates in northwest Atlantic Grey Seals.
Cornelia E. den Heyer, Fisheries and Oceans Canada
W. Don Bowen, Fisheries and Oceans Canada
Damian Lidgard, Dalhousie University
Shelley Lang, Fisheries and Oceans Canada
The grey seal breeding colony on Sable Island is the largest grey seal breeding colony in the world, and in 2016 produced 85% of the total grey seal pup production in Canadian waters. After more than three decades of growth at 13%, the rate of increase has declined to about 4% since 1997. Large, long-lived vertebrates facing resource limitation are hypothesized to exhibit reduced juvenile survival first, followed by natality and finally adult survival. To monitor and better understand the changes in demographic rates and the effect of changing demographic rates on population dynamics, we need long-term studies. Since 1969, some 7000 grey seals were uniquely and permanently marked at weaning on the Sable Island breeding colony. Each year during the December to February breeding season, DFO science staff and collaborators systematically survey the entire colony for marked adults.
These data provide individual resighting histories that allow us to estimate age- and sex-specific survival for juveniles and adults. Average adult survival was high, but male Grey Seals had lower survival at all ages (Fig. 1). Because of the high fidelity of grey seals to breeding colony, we can also estimate reproductive rates using the resighting histories of female grey seals. Only females with pups are sighted at the breeding colony; females that skip breeding are unobservable (temporary emigration). A new multi-state, open robust design model was used to estimate the transition probabilities between breeding and non-breeding states from 1992 to 2016. Females that gave birth had on average an 85% probability of pupping in the following year. However, females that did not give birth had a 56% probability of giving birth in the following year, suggesting that female quality plays a role in breeding probability. Although breeding probability varied among years, there was no trend over time. Thus, neither adult survival nor reproductive rates have contributed to the reduced rate of increase in pup production. To date, the reduced growth rate appears to be driven by a large reduction in juvenile survival from 0.74 (1985-89 cohorts) to 0.33 (1998-2002 cohorts). Recently marked cohorts (2014-2016) will provide future estimates to test how vital rates vary as the population nears environmental carrying capacity.
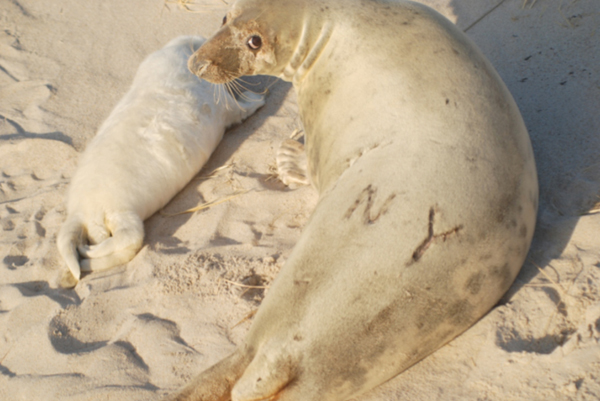
On adults, the permanent individual characters are at least 10 cm high and are easily spotted at a distance (photo: W. Don Bowen).

Figure 1
Apparent survival by age for males (black) and females (red) for 6 age bins. The horizontal bars represent the upper and lower confidence intervals.
OTN – Using grey seals (Halichoerus grypus) as bioprobes to estimate phytoplankton biomass
Don Bowen, Fisheries and Oceans Canada
Benia Nowak, Dalhousie University
Damian Lidgard, Dalhousie University
Sara Iverson, Dalhousie University
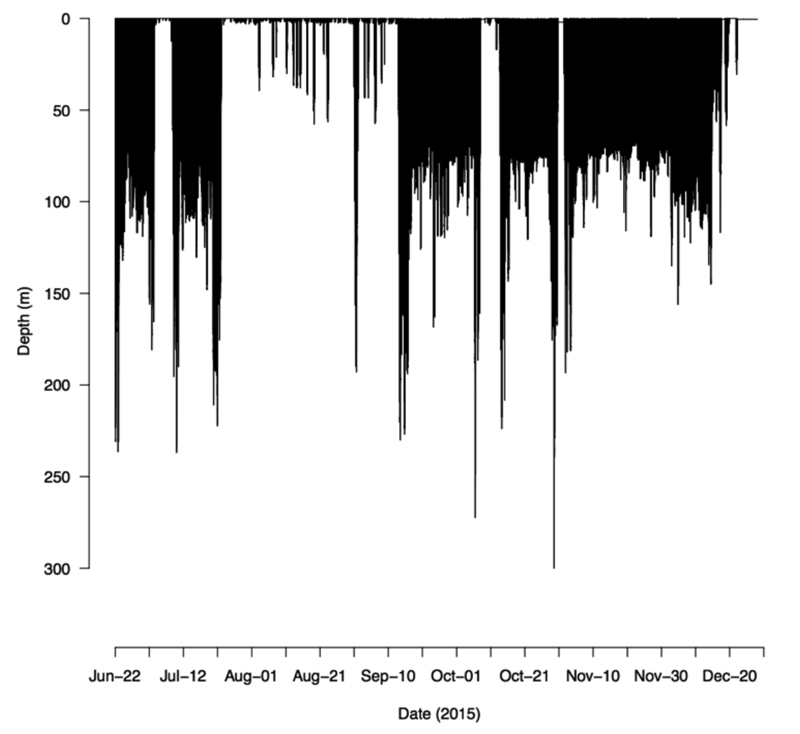
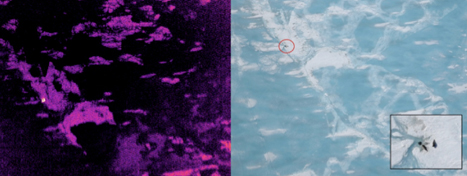
Figure 2
Dive analysis for a female (ID=106706) during the deployment period 2015-06-20 and 2015-12-22; data collected during dives include dive depth (m), temperature (ºC), and light level every ten seconds.
Although electronic dataloggers and telemetry tags are now routinely placed on marine mammals to study their behavior at sea, more recently these tags are also being used to sample oceanographic features (e.g., temperature, salinity). In this context, marine mammals are referred to as bioprobes – animals used to sample properties of their environment, namely the ocean. An element of the Ocean Tracking Network (OTN) sought to use grey seals as bioprobes to sample ocean temperature and light levels, which together offered a way to estimate the spatial and temporal distribution of phytoplankton abundance. By validating the use of light attenuation as a proxy for phytoplankton biomass in a continental shelf ecosystem, electronic tags can be deployed on wider range of species and allow us to collect fine-scale primary productivity data in other ecosystems. In determining the relative distribution of primary productivity within an ecosystem concurrently with the foraging paths of large marine predators, we may also be able to provide insight on importance of bottom-up drivers for ecosystem structuring.
Grey seals are a wide-ranging species that dive to the ocean floor. Between 2009 and 2016, we fitted 104 adult grey seals with global positioning system (GPS) tags which recorded the surface location about every 15 min, and recorded ocean temperature and light level every 10 sec, during each seal dive. From these data, we could determine the path of the seal and accurately position the recorded temperature and light level during each dive (Fig. 2). Light level attenuates with depth, and more so in the presence of phytoplankton. We calibrated the light level data from seal tags against oceanographic instruments during a series of experiments in the Bedford Basin. These experiments spanned a range of phytoplankton abundances and showed that the seal tags performed well against the oceanographic instruments (Figs. 3 and 4). To estimate phytoplankton abundance along the seal tracks, the ascent portion of each dive from the thermocline to the surface will be used to estimates the downwelling irradiance (light-level attenuation). Downwelling irradiance is then related to chlorophyll-a concentration and coloured dissolved organic matter concentration to provide a relationship that can be used to estimate phytoplankton abundance. In addition to linking seal movement behaviour to environmental conditions (Fig. 5), estimated chlorophyll-a concentrations derived from the seal bioprobes can be compared to ocean colour near- surface measurements from satellite and integrated into models of ocean primary productivity.

Figure 3
Comparison of the temperature profiles of a CTD and five MK-10AF FastlocTM GPS tags deployed on 2012-04-02 in the Bedford Basin.
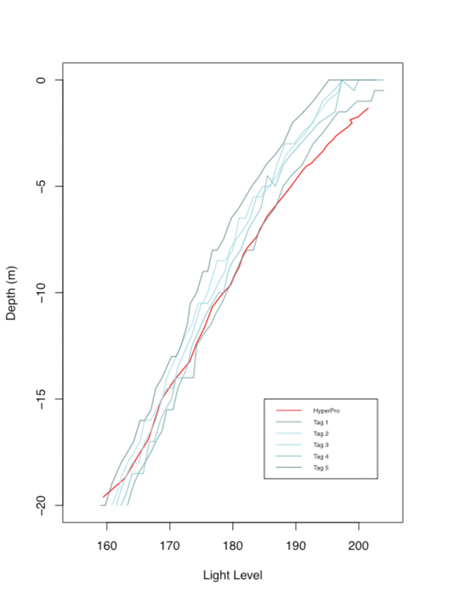
Figure 4
Comparison of the light level profiles of a HyperPro and five MK-10AF FastlocTM GPS tags within the noise equivalence irradiance of the HyperPro in the Bedford Basin on 2012-03-07.

Figure 5A
GPS locations modelled to estimate behavioural state every hour for a female grey seal (ID=106706) deployed between 2015-06-20 and 2015-15-22.
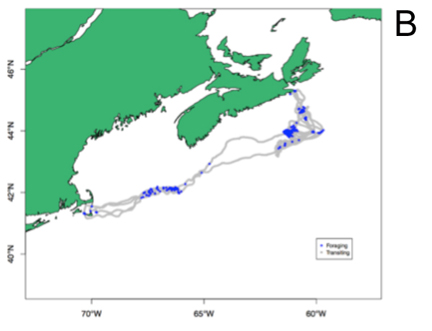
Figure 5B
GPS locations modelled to estimate behavioural state every hour for (B) a male grey seal (ID=106715) deployed between 2013-06-30 and 2014-01-13.
Northwest Atlantic International Sightings Survey (NAISS) of Marine Megafauna on the Continental Shelf From Northern Labrador to the Bay of Fundy
Jack Lawson, Jean-François Gosselin
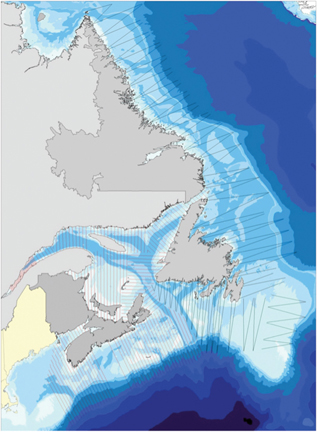
Figure 6
Survey effort by DFO Québec (red lines), DFO Newfoundland and Labrador (black lines) during the summer and fall of 2016.
Concurrent with partners in the United States, and using staff from several DFO Regions, in 2016 DFO conducted a large-scale aerial survey of the Atlantic Canadian seaboard as part of a multinational effort to gather data on the distribution and abundance of a variety of marine megafauna in the western North Atlantic. This survey was designated the NAISS (North Atlantic International Sightings Survey).
This was the second large-scale, systematic survey effort, and the first in nine years, to survey the continental shelves along Labrador and Newfoundland, the Gulf of St. Lawrence, and the Scotian Shelf for marine mammals, sea turtles, and other large species that that can be detected near the sea surface. DFO and its international partners were extremely pleased with the coverage achieved during the comparable 2007 TNASS survey; during both 2007 and 2016 DFO was able to realize an unparalleled level of aerial survey coverage.
DFO’s NAISS survey data will be integrated with the 2016 National Marine Fisheries Service and European SCANS III marine surveys, and by doing so will provide a cross-Atlantic context to interpret results. For example, summer 2016 offered an excellent opportunity for DFO to enhance the scientific value of our survey efforts by coordinating with planned American efforts in adjacent waters. During July-Sept 2016 NOAA conducted a l2-ship 2-aircraft marine megafauna (whales, sea turtles, sharks, seals) survey covering all northern U.S. Atlantic waters, as far north as the Canadian border.
By conducting a survey of Atlantic Canadian waters at the same time as NOAA, scientists covered most of the known range of many transboundary species of conservation and regulatory concern for DFO, and ensure that distributional anomalies will not jeopardise the results.
Further, European countries such as the UK, Spain, France and others also conducted large-scale megafauna surveys in the summer of 2016 – further enhancing the value of the NAISS by facilitating ocean-wide comparisons. An international workshop at the recent biennial marine mammal conference finalized plans to move forward with efforts to compare and merge these north Atlantic survey data.
The only way to achieve the designed coverage within a short time window constrained by weather conditions and whale migration was to use three aircraft simultaneously, each with a team of experienced observers. To make this possible, we combined the resources of three regions of DFO: Québec, Newfoundland & Labrador, and Maritimes.
The NAISS survey was flown at an altitude of 183 metres ASL using a deHavilland Twin Otter 300 and two Cessna 337 Skymasters. Expanding slightly on the 2007 TNASS, the 2016 transect lines extended from the shoreline to at least 20 miles beyond the shelf breaks, and crossed bathymetric profiles. Observers in the survey aircraft collected data on the identity, group size, position, and behaviour of large and small cetaceans, plus environmental covariates. Each aircraft was equipped with bubble windows, and the Twin Otter had a trackline video camera system as well. Sighting data were collected by observers using line transect survey methods. The data from fore and aft observers on the same side of the Otter aircraft will be used to estimate the proportion of sightings missed by observers (perception bias) and therefore improve the precision of the results. Surface interval information from whale tagging data collected by DFO and others will be used to estimate the proportion of animals available to be sighted during an overflight (availability bias).
Between August 1 and September 27 2016, DFO achieved almost the same coverage, 49,591 km of line transect effort, as in our previous large-scale marine megafauna survey in 2007 (TNASS); much poorer weather (i.e., unusually high winds and widespread fog) and an extended NATO naval exercise meant that DFO completed 89% of their planned transect effort in 2016, versus 96% in 2007 (Fig. 6).
In Labrador and Newfoundland DFO sighted almost twice as many cetaceans as they did in 2007 (1,073 sightings = 10,956 animals), although there were relatively fewer large whales (fin, humpback, minke); white-beaked dolphins were the most encountered and numerous cetacean. Most of the additional sightings were collected on the Labrador and Newfoundland NE coasts, perhaps a function of intentionally initiating the survey two weeks later than 2007, the later and prolonged presence of spawning capelin, or some other type of environmental change. A greater number of sightings would have been collected if DFO been able to complete four long transect lines off the Newfoundland south coast that were precluded by poor weather. The two Skymaster teams amassed slightly fewer cetacean sightings in the Gulf of St. Lawrence and on the Scotian Shelf than they did in 2007 (1,182 sightings = 4,819 animals; fewer common and unknown dolphins, principally). This smaller sighting total may have been a function of the poorer weather conditions and the weather-related loss of multiple transects on the centre of the Scotian Shelf (Figure 6).
Processing of the survey data, which began in the fall of 2016, involves transcribing, aggregating, and verifying the recordings made by the observers, mapping sightings, assessing duplicate sightings amongst observers, estimating sighting biases using mark-recapture data, and obtaining estimates of marine megafauna abundance using a distance sampling approach. The analysis of the visual survey data will be presented at the annual meeting of the national marine mammal peer-review committee in the winter of 2018.
From data gathered during the survey, the team will produce abundance estimates and distribution maps for species including cetaceans, sea turtles, and large fish species such as basking sharks and sunfish sighted in Canada’s Atlantic waters. Target species include multiple Species at Risk such as the blue whale, north Atlantic right whale, fin whale, St. Lawrence Estuary beluga whale, Scotian Shelf northern bottlenose whale, Sowerby’s beaked whale, leatherback and loggerhead sea turtles, and basking sharks.
Further, these data will be gathered in a way that facilitates their integration with similar types of data being collected concurrently in adjacent regions (e.g., the NOAA surveys). Sighting density data will be compared with physical and biological features such as bathymetry, sea surface temperature, and productivity to determine if there are relationships that could be used later in habitat assessments (such as to support critical habitat designation), or to refine future survey designs. In particular, the effort-weighted sightings data will be used to analytically challenge DFO’s MaxEnt habitat suitability models, and create new GLMMs. As well, DFO will compare the 2016 results with the distribution patterns and estimates from the 2007 survey using density surface mapping and MaxEnt habitat models.
Monitoring Movements of Whelping Seals on Drifting Pack Ice
Garry Stenson
Harp, hooded and grey seals give birth on drifting pack ice off the coast of Newfoundland and Labrador or in the Gulf of St. Lawrence. In order to determine abundance of these populations, we estimate the number of pups born every four or five years. The first step is to search the ice in the historical whelping (pupping) areas to find the concentrations of seals which in the case of harp seals is an area larger than England and Wales combined. Once these concentrations are found, we carry out visual and/or photographic surveys to count the number of pups hauled out on the ice.
However, a major challenge facing us is to ensure that once we find the seals, we are able to monitor where they are as the pack ice drifts with the current and winds. This movement can be very extensive, particularly during a storm. Even under normal conditions, for example, the ice moves at a speed of one nautical mile per hour off the coast of Labrador. We need to account for this movement to ensure that we are able to find each pupping concentration again in order to survey it and that we do not unknowingly count the same animals twice. Historically, finding these groups each day using helicopters or planes was costly, and took a tremendous amount of effort and time.
Fortunately, new technologies have made it far easier to monitor ice movements. During the most recent harp seal survey, we tested the use of small, inexpensive GPS beacons. These units determine their location to within 10 meters and then send their position to a satellite where it can be uploaded to a website for researchers. The frequency of reporting can be set by the user; in our case we obtained beacon positions every 30 minutes in order to ensure that the batteries lasted for the entire project (in fact they lasted for over 2 months).
One or more beacons were deployed in each of the pupping concentrations and their movements tracked for over 3 weeks. The GPS beacon was place in a specially constructed tube to protect them from the weather and keep them upright (see photo). The tubes were then placed on the ice and marked with highly visible, non-toxic dye so that they could be retrieved after the survey.
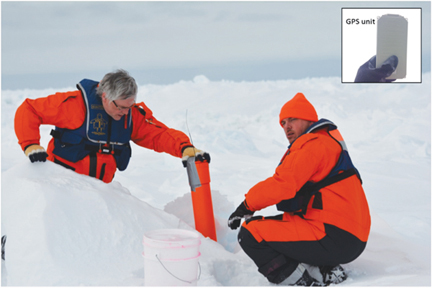
Deploying a GPS ice beacon to monitor movements of harp seal whelping concentrations, March 2017 (photo: A. Buren).
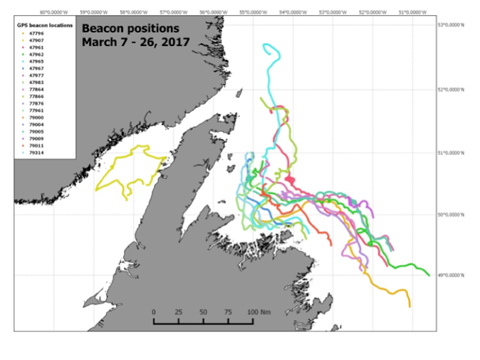
Figure 7
Movements of ice beacons deployed during the harp seal pup production survey, March 2017.

Figure 8
Example of the complex movements of two ice beacons.
The movements of the beacons (Fig. 7) illustrates how dynamic the ice is and the amount of drift that can take place. The average displacement for all beacons off Newfoundland and Labrador was over 210 km. While the general pattern of drift is southward, strong winds can drive the ice movements into quite complex patterns (Fig. 8). For example, in the northern Gulf of St. Lawrence, winter storms drove the ice and seals northward early in March while later in the month, the currents had greater influence and the ice drifted southward. After three weeks, this beacon ended up less than 10 km from where it started! Trying to follow each of the groups and keep them separate would be almost impossible and very expensive using traditional search methods
Carrying out surveys of seals pupping on drifting pack ice is a complex and difficult task. Thanks to the development of GPS beacons that can be deployed quickly and transmit information on their locations to us, it has made this survey a little easier.
Marine Mammal Genomics Research in the Central and Arctic Region
Lianne Postma and Denise Tenkula

Belugas in the Churchill River Estuary (photo: DFO).
Over the last couple of decades, the use of genetic tools (the study of genes) has become the gold standard to define units (populations, stocks) for conservation and management of marine mammals. Especially in the Arctic, DFO has been a leader in using population genetic research to identify distinct stocks of marine mammals in Canada, monitor the impacts of subsistence harvests on these stocks, and understand how historical environmental events may have shaped current migration and distribution patterns.
For many years, sequencing portions of the control region (CR) in mitochondrial DNA (mtDNA) of belugas (Delphinapterus leucas) has provided valuable insight for conservation and population studies for these whales. However, the advantages of increasing the overall amount of mtDNA sequence and including mtDNA protein-coding genes for investigating stock structure and phylogenies has been demonstrated in other species, including other cetaceans. A next-generation workflow was developed to sequence complete mitochondrial genomes (mitogenomes) for population studies of belugas and narwhals (Monodon monoceros). In a recent study, a total of 106 belugas and 94 narwhals from across each species’ Canadian range were sequenced, which resulted in complete mitogenomes for all samples.
Genetic diversity and phylogenetic analyses of beluga mitogenomes supported previous results found with CR sequence, but finer resolution of sub-groups were found that further inform our understanding of stock structure and evolutionary relationships among the sample groups. Preliminary tests of selection detected the presence of negative, or purifying, selection on all protein-coding genes of belugas, particularly for the ND1, CO1 and CO2 genes. However, no signals of positive selection were detected with the analytical methods used. In contrast to belugas, narwhal mitogenomes continued to exhibit much lower levels of genetic diversity and offered no improvements compared to previous approaches to resolve phylogenetic relationships among geographic sample collections. This could be due to insufficient numbers of samples for the analyses.
Future studies will also focus on highly informative genomic approaches (the study of whole nuclear genomes) that have the potential to inform even more complex questions about the adaptive potential of marine mammals to a changing climate and their role in the ecosystem. Genomics research has been applied to understanding and monitoring the potential of animals to adapt and persist in polluted habitats, the physiological and health conditions of individuals, range shifts of animals in response to changing environments and changing prey availability, and novel perspectives on ecosystem processes, such as nutrient and energy flux.
OTN and predator-prey interactions
Don Bowen, Fisheries and Oceans Canada
Damian Lidgard, Dalhousie University
Sara Iverson, Dalhousie University
The Canadian Ocean Tracking Network (OTN Canada) was a 7-year integrative research program which began in 2010 to understand changing continental shelf marine ecosystems across Canada in relation to important issues in fisheries and resource management. The program was funded by the Canadian Foundation for Innovation, Natural Science and Engineering Research Council, and DFO. One of the themes of OTN concerned the spatial and temporal characteristics of foraging by predators and the role they play in structuring trophic interactions and understanding ecosystems. Using newly developing acoustic technology, this study set out to test hypotheses concerning predator impacts on prey populations.
In eastern Canada, grey seals fitted with satellite tags and acoustic transceivers were used to examine the spatial and temporal pattern of encounters between seals and Atlantic cod. Grey seals were fitted with instruments in each year of the 7-yr study (115 at Sable Island and 20 in the Gulf of St. Lawrence). During the same period, acoustic tags were surgically placed in ~1200 Atlantic cod (800 on the Scotian Shelf, 400 in the southern Gulf of St. Lawrence). Species tagged by other investigators that co-occurred with grey seals included bluefin tuna and Atlantic salmon.
Acoustic detections occurred both among the acoustically tagged seals and fish species, mainly Atlantic cod. Seals tended to encounter other tagged seals at offshore banks, presumably were most feeding occurred (Fig. 9). There was no evidence that seals travelled together to these feeding sites, rather seals used the same limited number of feeding hotspots. Of the 104 seals from which data were recovered, only 25% detected tagged cod even though the movements of 70% of these seals overlapped with known cod distribution, underscoring the difficulty in using overlap as the basis for inferring predation rate. Most detection of cod were of short duration (~5 min compared to > several hours if the tag where ingested) and, thus, did not appear to represent predation events. The distribution of cod detected by grey seals on the Scotian Shelf and in the Gulf of St. Lawrence are illustrated in Fig. 10. Overall, these data demonstrate the feasibility of studying predator-prey interactions in the open ocean, but also underscore the importance of tagging large number of prey to have confidence in estimates of prey encounter rate and predation events.

Figure 9
Yellow dots represent the location of acoustic detections between two seals. In the lower panels are shown the movement of two individual grey seals where blue symbols represent travelling and red, presumed foraging sites. Again yellow dots show where an instrumented seal detected another acoustically instrumented seal.
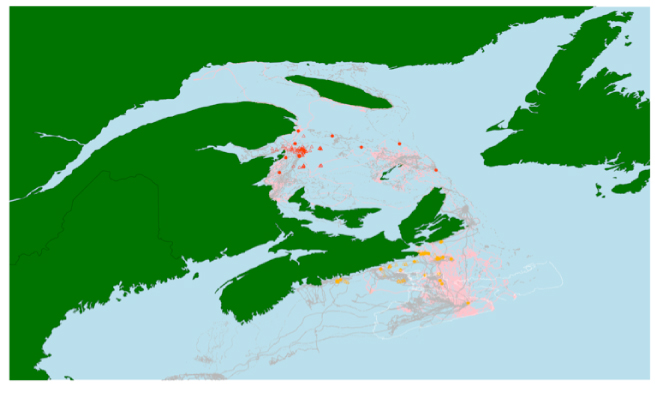
Figure 10
Individual acoustically tagged Atlantic cod detected by instrumented grey seals on the Scotian Shelf (orange symbols) and in the Gulf of St. Lawrence (red). Grey (males) and pink (females) lines represent seal tracks based on GPS locations.
Listening in on the Deep: Passive Acoustic Monitoring of Whales off Nova Scotia
H. Moors-Murphy

Left: Autonomous Multichannel Acoustic Recorders (AMARs) manufactured by JASCO Applied Sciences (photo: H. Moors-Murphy). Right: Sample AMAR mooring diagram.
More than twenty different species of marine mammals occur off Nova Scotia including resident and migratory species and several species at risk. Despite this diverse marine mammal community, relatively little is known about the year-round distribution, movement patterns and habitat use of many of these species throughout most of our waters. Of the species and areas that are well studied, the majority of available information on their occurrence comes from studies conducted on boat-based platforms during summer months, when weather conditions are favorable and it is the most logistically feasible to be out in the Northwest Atlantic studying marine mammals.
Most marine mammals in our waters produce underwater calls, unique to each species. Passive acoustic monitoring, or ‘listening in’ on the ocean environment, can provide a means to gain information on how marine mammals are using an area that is less restricted by weather conditions and at-sea platforms. Based out of the Bedford Institute of Oceanography in the Maritimes Region, Team Whale uses underwater listening devices called Autonomous Multichannel Acoustic Recorders (or AMARs for short) to monitor for whale presence in various areas of interest off Nova Scotia. These systems are anchored to the seafloor and collect and store data autonomously. With their terabytes of memory space and large number of batteries, AMARs can be deployed to collect acoustic data for a year or more at a time.
AMARs were used to collect acoustic data from the Gully Marine Protected Area and two nearby shelf-edge areas during 2012-2014 (Figure 11). These systems sat on the ocean bottom at approximately 1500 m depth for about six months at a time, with a few weeks gap between each deployment period to download data, change batteries and refurbish the systems. This resulted in a near-continuous two-year acoustic dataset that could be examined for the presence of whale calls. Analysis has provided information on the regular year-round occurrence of northern bottlenose whales in both canyon and non-canyon areas along the eastern Scotian Slope, and will contribute to identifying additional important areas outside of identified Critical Habitat for this Endangered species. New information on the seasonal occurrence of other species in these areas has also been gained including peaks in Endangered blue whale and species of Special Concern fin whale calls and humpback whale singingFootnote 1 during winter months, peaks in sei whale calls during summer months, the relatively consistent year-round occurrence of sperm whale and species of Special Concern Sowerby’s beaked whale clicks, and most excitingly the discovery of a new regular user of the Gully MPA – Cuvier’s beaked whales! While Cuvier’s beaked whales were acoustically detected in the Gully on about 25% of the recording days and showed low but consistent presence throughout the yearFootnote 2, only one visual sighting has ever been documented in the canyon despite the numerous beaked whale vessel-based surveys that have been conducted in the area dating back to the 1980’s.
During 2015-2017 (Figure 12), Team Whale’s passive acoustic monitoring program was expanded to five AMAR deployment stations and complimented a larger acoustic study conducted by JASCO Applied Sciences. In total, 25 AMAR recorders were deployed throughout Nova Scotia, Newfoundland and Labrador during this period. Analysis of the large amount of acoustic data collected is currently underway in collaboration with JASCO and the Taggart Lab of Dalhousie University.

The clicks of Endangered Scotian Shelf northern bottlenose whales are acoustically detected in the Gully Marine Protected Area and nearby shelf-edge areas regularly throughout the year (photo: H. Moors-Murphy).
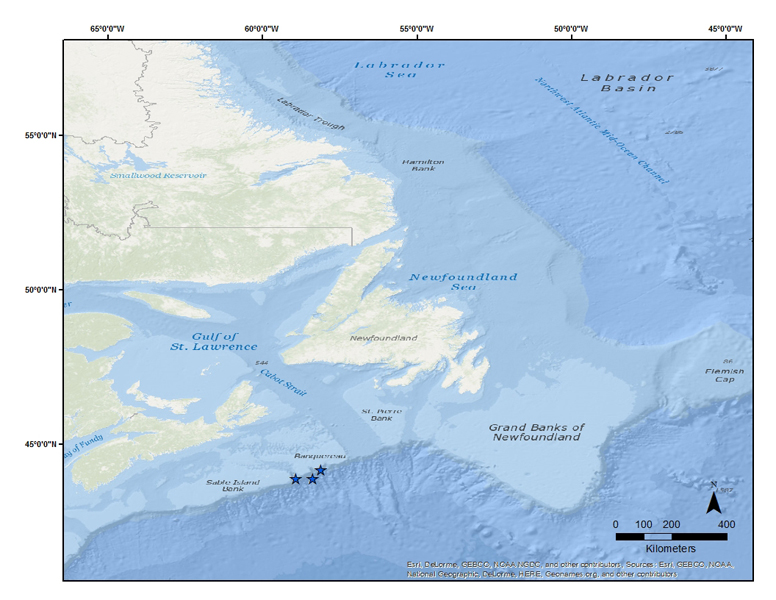
Figure 11
DFO’s three AMAR deployment stations (blue stars) in 2012-2014 along the eastern Scotian Shelf including in the Gully Marine Protected Area and two nearby shelf-edge areas.
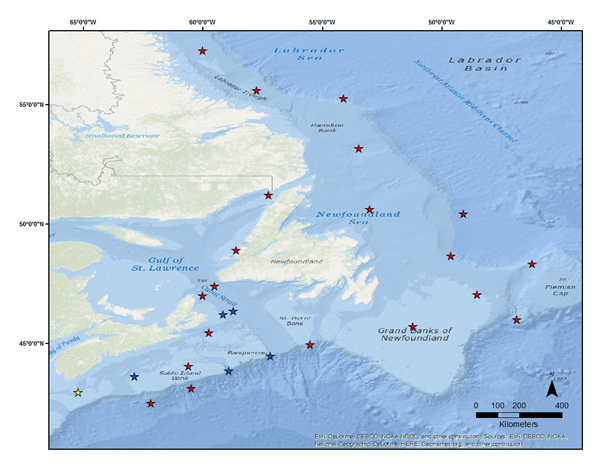
Figure 12
AMAR deployment stations in 2015-2017 off Nova Scotia, Newfoundland and Labrador by DFO (blue stars), JASCO Applied Sciences (red stars) and the Taggart Lab of Dalhousie university (yellow star – system lost/not recovered).
Similar passive acoustic monitoring programs using bottom-mounted recorders known as AURALs (Autonomous Underwater Recorder for Acoustic Listening) are being led by DFO researchers in other eastern Canadian regions. Yvan Simard from the Institut Maurice-Lamontagne in Quebec has been conducting AURAL deployments in the St. Lawrence Estuary and Gulf of St. Lawrence and Jack Lawson of the North Atlantic Fisheries Centre in Newfoundland has been deploying AURALs off southern Newfoundland and eastern Labrador since 2009.
Over the next few years, DFO’s passive acoustic monitoring program off eastern Canada will continue to expand under the new Ocean Protection Program (OPP). Funding through OPP supports the acquisition of additional acoustic recording equipment and personnel with acoustics expertise to help increase our understanding of the impacts of human-made noise, particularly shipping noise, on at-risk whale species including Endangered North Atlantic right whales, St. Lawrence belugas and southern resident killer whales in the Pacific. Enhanced passive acoustic monitoring efforts into the future will allow us to continue to expand our knowledge of when and where whales occur off eastern Canada, will help us to monitor ocean noise in our waters, and will contribute to our understanding the impacts of human-made noise on whales to better assess how to mitigate these impacts and protect whales in our waters.
Sharing Meals Keeps Killer Whale Families Together: Provisioning relatives maintains long-term social bonds and helps pass on shared genes
Brianna Wright, Eva Stredulinsky, Graeme Ellis, John Ford
A study conducted by researchers at the Pacific Biological Station (Fisheries and Oceans Canada, Pacific Region) has received the award for the Assistant Deputy Minister’s 2016 Science Paper of the Year. The award recognizes an innovative and thought-provoking scientific paper in a peer-reviewed journal that advances a field of study of relevance to DFO’s mandate. The paper, entitled “Kin-directed food sharing promotes lifetime natal philopatry of both sexes in a population of fish-eating killer whales, Orcinas orca”, was published in the journal Animal Behaviour. The study found that northern resident killer whales frequently share fish with members of their family groups (known as matrilines). Over a twelve-year period (2002-2014), researchers observed killer whales from this population catch 685 salmon, over 70% of which they shared with other individuals. Animals of all ages (except very young calves) and both sexes participated in this behaviour. When prey was shared, one whale usually made a long foraging dive while other individuals milled at the surface. Once the hunting whale surfaced with prey, it carried the fish towards the milling individuals or it was approached and joined by one or more of these animals. Killer whales frequently swam from as far as 400 m away to join in, although more often, they were within 100-200 m when the salmon was brought to the surface. Fish scales and pieces of tissue were typically found at the surface of the water where whales came together, indicating that fish had been broken apart for sharing. Researchers identified the species and age of the shared fish by collecting these scraps or ‘left-overs’. This prey sharing behavior was also captured on video, using an underwater camera on a pole that was lowered off the side of the research boat.
Resident killer whales prey almost exclusively on salmon and depend particularly on Chinook (the least common species of salmon in the Pacific Northwest), which makes up the majority of their known diet. Despite the importance of Chinook to the survival of individual killer whales, they frequently choose to share this critical resource with family members. This behaviour is quite remarkable, since any of these fish could easily be eaten whole by a single whale, but instead they choose to break them apart and share them. The vast majority of salmon that were shared by whales were given to close maternal relatives (84%) − fish were rarely shared with animals outside the matriline. This type of self-sacrificing behaviour can actually end up benefitting whales that give up a portion of their meal. First, it limits the level of competition among family members for access to salmon, and second, by helping close relatives and ensuring their health and survival, it helps to pass on shared genes to future generations. In other words, performing a helping behaviour that favours the successful reproduction of close relatives results in the proliferation of genes common to both the helping individual and the recipient; this is an evolutionary strategy known as kin selection. Kin selective behaviours provide the greatest benefit to helpers when they assist individuals that are the most closely related to themselves, as well as those with the highest potential future reproductive output.
Food sharing is a kin selective behaviour that helps to reveal how the exceptionally stable social structure of resident killer whales may have evolved. Typically, male mammals leave their social groups when they reach reproductive age, to prevent inbreeding and to reduce competition between relatives. However, neither male nor female resident killer whales ever leave their mother’s social group, a pattern that has been documented in only a handful of species worldwide. Resident killer whales remain with their mothers for their entire lives because food sharing with close maternal relatives provides significant benefits, such as proliferation of shared DNA. These benefits are only available to whales that stay with the group they are born into. Resident killer whales are able to avoid inbreeding without permanently leaving their mother’s group because they have sophisticated acoustic dialects that help them to recognize and avoid mating with kin.
Although both sexes of resident killer whale remain with their mother’s group throughout life, the study found a significant difference in the way that males and females shared fish with their family members (Figure 13). Adult females shared almost all of the fish that they caught (91%), and shared most frequently with their offspring. Unlike females, adult males shared fish much less frequently (25% of salmon caught), which might be explained by several factors. The first is that a male’s offspring are born to females outside of his matriline, and therefore males are less related, on average, to the members of their family group and as a result are less likely to share fish with them. Adult males also have greater nutritional requirements because of their large body size, and therefore probably need to retain more food in order to meet these needs.
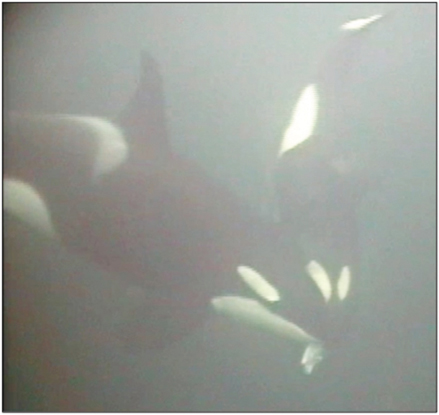
A34, an adult female (30 years old) northern resident killer whale, passes a portion of fish to A80, her male calf (1 year old), in a food-sharing event recorded in Blackfish Sound, British Columbia, Canada on October 26, 2005 (photo © Cetacean Research Program, Fisheries and Oceans Canada).

Figure 13
Percentage occurrence of prey sharing based on the age-sex class of the whale making the kill (i.e. the ‘sharer’). Includes only those kills made by a single, photo-identified individual and for which sharing probability was certain (N = 466). Adult: ≥12 years old; subadult: individuals of both sexes <12 years old.

Figure 14
Percentage of sharing interactions by age-sex class of recipients for each age-sex class of sharer: sexually mature male (12-17 years, N = 12 interactions); physically mature male (>17 years, N = 32); reproductive female (12-39 years, N = 286); post-reproductive female (>39 years, N = 28); subadult ( <12 years, both sexes, N=7 3). Includes a total of N=4 31 sharing interactions observed during 341 different predation events in which sharing was confirmed with the highest level of observer certainty.
When adult males did share fish, it was often with their mothers. Since these females were usually older, post-reproductive matriarchs (Figure 14), this behavior is surprising, because assisting an individual that can no longer reproduce does not help perpetuate shared genes. There is no apparent advantage in doing this from a kin selection perspective. However, post-reproductive matriarchs favoured sons when they shared salmon (Figure 14), and other research has shown that adult sons whose mothers have died are less likely to survive themselves. Adult males probably share fish with their mothers to ensure that their mothers survive and continue to provision them into adulthood.
Conversely, the study found that mothers stop sharing prey with their daughters around the time that daughters reached adulthood and produced their first calves. This is probably because daughters became more focused on provisioning their calves than on sharing food with their mothers. Mothers may also choose to favour adult sons instead of daughters because sons have a greater expected lifetime reproductive output (female killer whales produce around 5-7 calves in their lifetime, whereas a successful male could potentially sire many more). Mothers who share fish with sons to enhance their survival therefore receive a greater return on their investment (in terms of shared genes passed to the next generation). The decline in sharing with daughters may help to explain why resident killer whale groups sometimes split across maternal lines – daughters that no longer receive the benefit of salmon from mom may strike out on their own with their offspring.
The research paper is available online, free of charge, at the following link, along with video of northern resident killer whales sharing a salmon: http://www.sciencedirect.com/science/article/pii/S0003347216000737
New developments in the use of fatty acids to determine marine mammal diets
Shelley Lang, Fisheries and Oceans Canada
Connie Stewart, University of New Brunswick
Don Bowen, Fisheries and Oceans Canada
Sara Iverson, Dalhousie University
Determining the diet of marine mammal species is difficult because most feeding occurs while they are diving at remote locations in the ocean and thus cannot be observed directly. Traditional methods using prey hard parts recovered from feces or stomach can provide useful information, but known sources of error and bias have motivated the development of new methods to determine marine mammal diets. Quantitative fatty acid analysis (QFASA) is one of these new methods.
Fatty acids are the building blocks of fat. In the ocean, there are about 67 such building blocks in the fats of most marine fish and invertebrate species such as Atlantic cod and squids, respectively. Although the same fatty acids occur in most species, their relative abundances differ greatly providing a fingerprint by which, for example, cod can be distinguished from herring and other fish and invertebrate species. An important feature of prey fatty acids is that they are deposited in predator fat stores in a predictable way. Thus, by comparing the predator’s fatty acid profile with a library of prey species fatty acids, we can estimate how much of each prey species must have been eaten to produce the predator profile. From this the diet composition of the predator can be estimated.
Although the method has been used for more than a decade, improvements continue to be made. Principle among these concern the library of prey species fatty acids and the calibration coefficients needed to account for predator metabolism of prey fatty acids. Although 87 prey species are represented in the fatty acid library, 21 species are now used to estimate the diet of grey seals on the Scotian Shelf. Estimates are now based on a subset of dietary fatty acids (i.e., those that can only come from the diet and cannot be synthesized by the predator) that are reliably estimated. Finally, the calibration coefficients that are associated with these 28 fatty acids have been tested for how well they work by comparing model results against diets fed to captive harbour and grey seals. These improvements in QFASA should provide more accurate estimates of not only the diets of grey seals but other marine mammals.
More than a mouthful – unlocking bowhead whale foraging and reproductive histories from baleen
Cory Matthews, Fisheries and Oceans Canada
Nadine Lysiak, University of Massachusetts, Boston
Kathleen Hunt, Northern Arizona University
Conny Willing, Fisheries and Oceans Canada
Claire Hornby, Fisheries and Oceans Canada
Mads Peter Heide Jørgensen, Greenland Institute of Natural Resources
Steve Ferguson, Fisheries and Oceans Canada
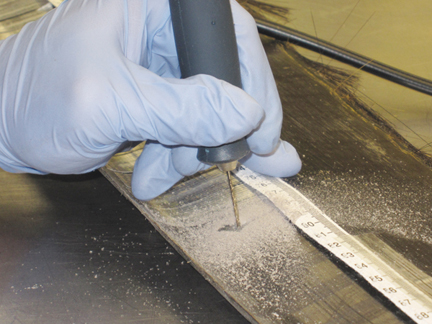
Drilling baleen at 2-cm increments (photo: Cory Matthews).

Figure 15
Isotope ratio oscillations along the baleen of one bowhead whale are related to seasonal movements and foraging. The isotope values of zooplankton, which bowhead whales feed on, differ between their summer and winter grounds. As the bowhead whales migrate and feed between these areas, the distinct isotope ‘signature’ of each region is recorded as an annual cycle in their baleen.
Effective management of marine mammal populations requires knowledge of habitat use (for example, where do they feed, and where do they raise their calves?). Understanding reproductive rates, which allows for projecting population growth from current levels, is also important. Bowhead whales, which exist as two populations in the eastern and western Canadian Arctic, are currently recovering from severe depletion from commercial whaling over the past several centuries. While their populations are now doing well, a good understanding of when and where bowhead whales feed throughout the year, as well as the calving rates of mature females, can help us understand how bowhead whale populations may respond to climate change-related stressors such as changes in prey availability, increased shipping activity, and oil exploration.
Studying the ecology and reproduction of large whales is difficult, especially for bowhead whales that migrate long distances in a region that is inaccessible to conduct research during much of the year. Recent scientific studies have shown that measurement of the composition of baleen, a keratinous material (like fingernails) that grows in long, thin plates from the upper jaw of bowhead whales, can be used to reconstruct diet, movements, and reproductive histories. Baleen plates, which are closely packed together and coated in long hairs, allow the whales to filter tiny organisms called zooplankton – which form their diet – from the water. Baleen grows continuously at about 20 centimeters a year, and can reach lengths of 3 to 4 meters in bowhead whales – in other words, one baleen plate can represent up to 20 years of growth!
One of the most interesting developments in marine mammal research over the past decade is the measurement of the chemical composition of continuously growing structures like baleen to learn about past diet and migration patterns, and reproductive history. Because baleen forms directly from dietary metabolites in the blood, its composition reflects that of the whale’s diet at the time of growth. The nitrogen and carbon composition of animal tissues like baleen in particular can be used to assess what and where an animal eats because ratios of stable isotopes of these two elements vary with an animal’s trophic position (where it is located within the food web), and its habitat. Similarly, hormone concentrations that peak in an animal’s blood, for example, progesterone during pregnancy, are also incorporated into baleen as it forms. Baleen is therefore an archive of an animal’s dietary and reproductive history that can be accessed by measuring the isotope and hormone composition along its length.
Fisheries and Oceans Canada and the Greenland Institute of Natural Resources have collected baleen plates from more than 20 whales harvested in subsistence hunts in both countries over the past 10-15 years. Researchers have drilled small samples of baleen in 2-cm increments along the length of each plate, which corresponds to a sampling interval of about 1 to 2 months, and measured them for stable isotope and hormone concentrations. All individuals exhibited stable isotope cycles every 20 cm, or equivalent to the annual baleen growth rate. By matching zooplankton isotope values with the baleen isotope peaks (Figure 15), which occurred in summer, and troughs, which occurred in winter, researchers showed that bowhead whales forage throughout their annual range. While it has long been known that bowhead whales forage intensively during the summer months on zooplankton known as copepods, it has been assumed that winter, when the cover of sea ice limits ocean productivity, was a time that bowhead whales fasted and relied on their blubber stores for energy. However, results of the baleen isotope research indicate that bowhead whales feed to some extent during winter, perhaps on copepods that hibernate at the sea floor. This research therefore indicates bowhead whales may select winter habitat in regions that allow them to dive to the bottom and forage, and that winter feeding forms a more important part of their annual energy budget than previously thought.
More recent analyses of baleen hormones are ongoing, but initial results have shown this to be a promising technique to learn more about both female and male reproductive behaviour. For example, progesterone peaks indicating pregnancy were detected along the baleen plates of 10 females. The next step – analysis of the placement of these peaks relative to annual isotope cycles – will allow for researchers to determine calving interval, or how often each female was pregnant and gave birth (versus pregnancies that were terminated prematurely). Simultaneous measurement of the stress hormone corticosterone showed that all progesterone peaks were associated with elevated stress, likely reflecting the extra investment required by females in terms of allocating resources to the developing fetus. Researchers were also able to detect annual peaks in testosterone in male bowheads, which indicates they breed annually. Further, testosterone peaks were offset from the peaks in nitrogen and carbon isotopes that occurred in summer, which is consistent with observations of bowhead whales breeding in the spring.
The long baleen plates of bowhead whales make them an ideal species for applying this novel method of reconstructing dietary and reproductive histories. Research has already shown foraging patterns that were previously unknown, and further analysis of reproductive hormone data will allow for researchers to develop better models of bowhead whale population growth. Ultimately, isotope and hormone patterns in individual plates, including remnants from commercial whaling hundreds of years ago that are currently housed in museums, can be combined to examine changes in diet and reproduction over much longer periods of time. For example, a clear decline in stable isotope values was observed across the three decades represented by the sample of 20 whales that have been measured so far, which may be related to diet shifts. As the Arctic climate continues to change, future analysis of diet variations and concomitant variation in reproductive parameters and stress levels may be used to indicate negative health impacts and population trends.
Observing walrus behaviour at haulout sites in quasi real-time
Arnaud Mosnier and Mike Hammill
Walrus follow a typical pinniped life history strategy combining marine foraging with hauling out on land or the ice to rest and for reproduction. The effects of climate change are already impacting seasonal ice cover. In the future, walrus are expected to have fewer haulout options as summer pack ice recedes, forcing animals to make greater use of a restricted number of terrestrial sites and limiting availability of foraging areas to those in proximity to these haulout sites.
In Canada, a decline in ice cover may impact walrus, but perhaps not as severely as in the Pacific, where walruses are making extensive use of the offshore pack-ice. One potential benefit is that as summer ice cover declines, animals will make greater use of islands and coastal areas which may be easier to survey to derive abundance estimates. Currently, coast surveys are characterized by considerable uncertainty in the day to day numbers of walruses hauled out at any one time and uncertainty in the proportion of the population hauled out. One approach to improving our understanding of changes in counts of walrus at haulout sites is to increase the number of overflights of key sites during surveys, which is expensive and time consuming.
The deployment of remote cameras at principle haulout sites could provide information on numbers of walruses using a site on a daily basis, information that could be incorporated into surveys. At the same time, cameras could record activity patterns on daily and seasonal haulout use. Data can be stored and downloaded onsite later in the season. However, this approach is cumbersome and would mean data are not available until a year later when the site is revisited. Transmission of remote data via mobile telephone and VHF networks is common but is not possible on walrus haulout sites because they are generally located far from any human installations. The use of satellite communications is becoming more affordable and some companies are developing smaller systems that can take advantage of such technology.
A tower mounted digital camera was installed in early August at an haulout site along the Nottingham Island coast, located in the Hudson Strait, north of the Nunavut Inuit community of Ivujivik. The choice of the site was based on the local knowledge of the hunters and the installation was conducted in collaboration with them. The camera system is powered by a solar panel and a rechargeable battery pack provides electricity to the camera and the satellite modem allowing the transmission of the data. A small weather station installed on another part of the tower also records the wind speed and direction along with the temperature. The camera is programmed to take several pictures per day so as to cover the daily patterns of occupation of the site by walrus. Among those photos three are transmitted through satellite to a website that can be accessed from DFO’s Maurice Lamontagne Institute. This allows us to recover the information collected in quasi real-time (photos are uploaded daily). The photos are also accessible to local hunters allowing them to observe what is happening with walrus as well.
This first installation is a test from various points of view. The plan is to deploy the system on site during one year as a test to see how it will react to the harsh conditions that can occur in this area. This is also a test for the feasibility of the use of satellite transmission in those conditions, including during the winter, when the limited number of daylight hours may limit the solar panel’s abilities to keep the system operational. Depending on the result of this project, similar systems could be deployed at other walrus haulout sites and be used to monitor other species, including for example the monitoring of the use of some estuaries by belugas.
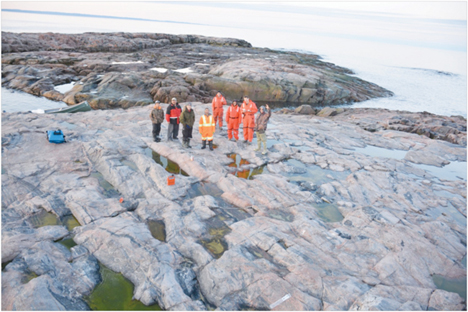
First photo taken by the camera showing the field of view of the camera mounted on the tower and the installation team (Note: the photo was taken at 10 PM) (photo: DFO).

From the left to the right: Jusipi Padlayat, Charlie Paningajak, Adamie Paningajak, Paulusie Tarriasuk, Samuel Turgeon (DFO Quebec), Tivi Alaku, Arnaud Mosnier (DFO Quebec), Jusi Sala (photo: DFO).

The camera system installed on the island (photo: Samuel Turgeon).
Moving towards automated counting
Garry Stenson, Mike Hammill
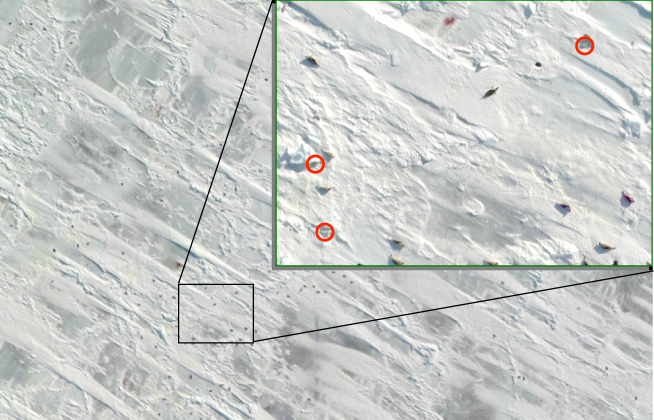
Figure 16
Photograph of ice taken during a harp seal pup production survey. White coated pups are circled. Counts of dark adults are not used in the assessment. The counting process is laborious because of the number of images and the time needed to search each image. For many ice-breeding seals this is further complicated because of the lack of contrast between a white-coated pup and the white background.
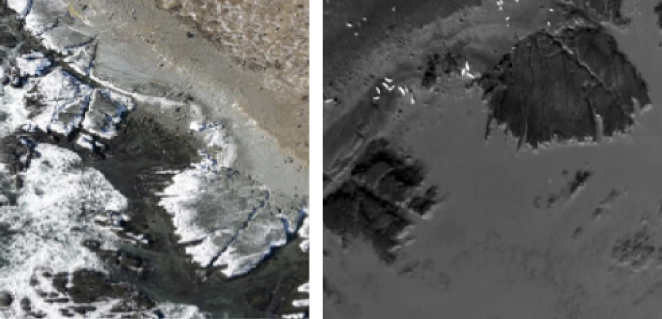
Figure 17
Imagery of a grey seal pupping colony on an island in Atlantic Canada taken using a normal camera (left) and an image for the same island colony as recorded using a thermal infrared camera (right). From Seymour et al. 2017 (Seymour, A.C., J. Dale, M. Hammill, P.N. Halpin, and D.W. Johnston.2017. Automated detection and enumeration of marine wildlife using unmanned aircraft systems (UAS) and thermal imagery. Scientific Reports 7 :000-000. http://dx.doi.org/10.1038/srep45127. Published online 24 March 2017)
Obtaining an estimate of animal abundance is needed to identify conservation objectives, for setting harvest limits and evaluating the impact of development. To do this, we often carry out visual or photographic surveys, to determine the number of animals in an area. During visual surveys, trained observers detect and tabulate animals as they pass by along a predetermined transect in a boat or aircraft. The advantages of such surveys are that observations can be made quickly, the data entered and analyzed to produce an estimate within a period of days to only a few weeks. However, visual observations are transient; the observer quickly sees the animal, identifies species, number and other data which are recorded, but there is no way to return later to verify if the data are correct.
The preferred approach is to use a sensor, such as a camera, to photograph the area. However, each photograph must be examined which can be difficult and time consuming. Detection of animals in a photo depends on the quality of the image and the ability of the reader to identify the animal on the photograph (Figure 16). This ability to detect an animal will vary between readers, but because there is a physical image that can be re-checked, protocols can be developed and quality of identifications evaluated. Over the last three decades we have seen tremendous improvements in image quality as platforms have incorporated motion-compensation mechanisms, and moved from film to digital systems. With current digital systems the resolution is so great that readers can hone in on a single image, magnify it and determine if it is an animal or some other object. This has reduced the amount of correction that has been applied to counts to compensate for missed animals. Incorporating the imagery into Geographic Information Systems (GIS) has also helped to accelerate counting since each animal is georeferenced on the screen and entered automatically into a database, thereby saving time; any questionable observation can be checked right away, and time-wasting physical entry of data is avoided. Geo-located data can also be used for additional studies such as identifying the types of ice used for pupping. However, many surveys, particularly those of marine mammals, cover large areas, so there can be an enormous number of photographs to read. In our harp seal surveys we generate 25,000 to 35,000 images each year that a survey is flown. Currently, this requires three people, working full-time, a year to read all of the imagery.
An automated detection and counting system would speed up the processing of photographs and reduce both the amount of time and energy needed to count animals on images. Such an approach could be semi- or fully automated. In a fully automated system, the number of animals present on an image is detected and tabulated by the system. This reduces the amount of effort needed and speeds up the final results, but is very difficult to actually develop. A semi-automated system, where potential animals are highlighted and a trained observer decides if it is a marine mammal or not, is more feasible. Over the years, various attempts have been made to create a semi-automated system to count seal pups but it is only in the last decade with significant improvements in computing power, and major advances in facial recognition systems, that some progress has been made. These features, combined with an approach referred to as deep learning have opened up possibilities to developing new automated detection systems. Deep learning is where the computer, exposed to hundreds of images of marine mammals (e.g. seals on the ice), slowly learns to distinguish what a seal on the ice looks like. This differs from earlier, more traditional approaches in which scientists attempted to define the shape of a seal using very complex algorithms.
DFO scientists are working with researchers from the Norwegian Institute of Marine Research and the Norwegian Computing Center to develop a program that automatically identifies potential harp and hooded seal pups in aerial images using a Deep Convolutional Neural Network (CNN). While still in the developmental stage, early results suggest that this is a useful approach. The method was developed using images from older Canadian and Norwegian surveys and is now being tested against images obtained during the harp seal survey DFO carried out in March of 2017. It is hoped that the program will be operational in time for the next survey.
The greatest challenge in identifying marine mammals, and in particular seals that give birth to white-coated pups like harp and grey seals, on images obtained using normal sensors is the lack of contrast between the seals and their background. In the past, ultra-violet cameras have been used to improve the contrast of harp seals but such cameras were expensive and hard to obtain. However, over the last few years, sensors that operate using other wavelengths, have become readily available. Thermal sensors which can measure the difference between the warm temperatures emitted from an animal and its colder surroundings are one example of a sensor that offers potential. Working with researchers from the Duke University Marine Laboratory, we recently deployed a thermal sensor in a small Unmanned Aerial Vehicle (UAV) to collect imagery of grey seal pups born on small islands during January in Atlantic Canada.
A seal detection model was developed to scan thermal imagery, detect seals, and count them. Counts obtained using the automated counter were compared to manual counts obtained from two island breeding colonies in Atlantic Canada. The tool used temperature thresholds and pixel cluster size sorting to detect grey seal adults and pups. The images were first examined manually to provide a baseline count. They were then examined using the automated thermal model. At one island, the automated counter detected 5% fewer seals than were detected manually. At the second island, the automated counter only detected 2% fewer seals than were counted manually (Figure 17).
In our analyses, the automated method performed better than manual counts at the prediction site (site two) where ambient landscape temperatures were lower, allowing for better contrast between seals and the environment. However, the model failed to detect young animals that were not warm enough. These ‘cold’ animals were likely dead animals that did not have a thermal signature but could be seen by the human readers. This automated system is relatively easy to set up and apply using commonly used GIS software. In areas where multiple sensors are used, it offers a clear way forward to improve counting and tabulation of imagery obtained from our surveys.
References
- Allard, K., Cochrane, N., Curran, K., Fenton, D., Koropatnick, T., Gjerdrum, C., Greenan, B.J.W., Head, E., Macnab, P., Moors-Murphy, H., Serdynska, A., Trzcinski, M.K., Vaughan, M., and Whitehead, H. 2015. The Gully Marine Protected Area Data Assessment. DFO Can. Sci. Advis. Sec. Res. Doc. 2015/056. vi + 167 p.
- Auger-Methe, M., Albertsen, C. M., Jonsen, I. D., Derocher, A. E., Lidgard, D., Studholme, K. R., Crossin, G.T., Bowen, W.D., Mills Flemming, J. 2017. Template Model Builder: a promising tool to model the movement of marine animals. Marine Ecology Progress Series 565: 237-249. doi: 10.3354/meps12019
- Aulanier, F., Simard, Y., Roy N., Gervaise, C., and Bandet, M. 2016. Ground-truthed probabilistic shipping noise modeling and mapping: Application to blue whale habitat in the Gulf of St. Lawrence. In: Proceedings of Meeting on Acoustics 27, 07006. pp. 1-14. Fourth International Conference on the Effects of Noise on Aquatic Life, Dublin, Ireland. 10-15 July. http://www.dfo-mpo.gc.ca/oceans/publications/mpaegsl-egslamp/index-eng.html
- Aulanier, F., Simard, Y., Roy N., Gervaise, C., and Bandet, M. 2016. Spatial-temporal exposure of blue whale habitats to shipping noise in St. Lawrence system. DFO Can. Sc. Adv. Sec. Res. Doc. 2016/090. vi + 26 p. http://www.dfo-mpo.gc.ca/csas-sccs/Publications/ResDocs-DocRech/2016/2016_090-eng.html
- Aulanier, F., Simard, Y., Bandet, M., Roy N., and Gervaise, C. In press. Effects of shipping on marine acoustic habitats in Canadian Arctic estimated via probabilistic modelling and mapping. Marine Pollution Bulletin
- Baker, L. L., J. Mills-Fleming, I. D. Jonsen, D. C. Lidgard, S. J. Iverson, W. D. Bowen. 2015. A novel approach to quantifying the spatiotemporal behavior of instrumented grey seals used to sample the environment. Movement Ecology 20153:20 https://doi.org/10.1186/s40462-015-0047-4
- Bellehumeur, C., Nielsen, O., Measures, L., Harwood, L., Goldstein, T., Boyle, B., and Gagnon, C. 2015. Herpesviruses including novel gammaherpesviruses are widespread among phocid seal species in Canada. Journal of Wildlife Disease 52 (1): 70-81
- Binnington, M.J., Lei, Y.D., Pokiak, L., Pokiak, J., Ostertag, S.K., Loseto, L.L., Chan, H.M., Yeung, L.W.Y., Huang, H., Wania, F. 2017. Effects of preparation on nutrient and environmental contaminant levels in Arctic beluga whale (Delphinapterus leucas) traditional foods. Environmental Science: Processes & Impacts: 19, 1000-1015
- Bowen, W. D., C. E. den Heyer, McMillan, JI, Iverson SJ. 2015. Offspring size at weaning affects survival to recruitment and reproductive performance of primiparous gray seals. Ecology and Evolution 5(7): 1412-1424
- Bowen, D. 2016. Halichoerus grypus. The IUCN Red List of Threatened Species 2016: e.T9660A45226042.
- Bowen, D. 2016. Phoca vitulina ssp. vitulina. The IUCN Red List of Threatened Species 2016: e.T17020A66991409.
- Breed, GA, CJD Matthews, M Marcoux, JW Higdon, B LeBlanc et al (2017) Sustained disruption of narwhal habitat use and behavior in the presence of Arctic killer whales. Proceedings of the National Academy of Sciences 114 (10), 2628-2633
- Breed GA, Matthews CJD, Marcoux M, Higdon JW, Orr J, Reinhart, NR, and Ferguson SH. 2017. Sustained disruption of habitat use and behavior of narwhals in the presence of Arctic killer whales. Proceedings of the National Academy of Sciences 114: 2628–2633. doi: 10.1073/pnas.1611707114
- Breton-Honeyman, Kaitlin, C. M. Furgal and M. O. Hammill. 2016. Systematic Review and Critique of the Contributions of Traditional Ecological Knowledge of Beluga Whales in the Marine Mammal Literature. Arctic. 69:37-46
- Breton-Honeyman, K., M. Hammill, C. Furgal, and B. Hickie. 2016. Inuit knowledge of beluga whale (Delphinaterus leucas) foraging ecology in Nunavik (Arctic Quebec), Canada. Canadian Journal of Zoology 94:713-726
- Brewster, J.D, Giraldo, C., Swanson, H., Reist, J.D., Stern, G.A., Loseto, L.L. 2016. Ecological niche of coastal Beaufort Sea fishes defined by biotracers: Recommendations for a marine protected area monitoring program. Marine Ecology Progress Series, 559:159-173
- Brown, TM, DCG Muir, SH Ferguson, BG Young, AT Fisk, KJ Reimer, X Wang. 2016. Mercury and cadmium in ringed seals in the Canadian Arctic: influence of location and diet. Science of the Total Environment 545–546: 503–511
- Brown, T.A., Chrystal, E., Ferguson, S.H., Yurkowski, D.J., Watt, C.A., Hussey, N.E., and Belt, S.T. (2017) Coupled changes between the H-Print biomarker and δ15N indicates a variable sea ice carbon contribution to the diet of Cumberland Sound beluga whales. Limnology and Oceanography. Doi: 10.1002/lno.10520
- Burns, L. D., S.D. Petersen and S.H. Ferguson, 2016. Exploring the use of citizen science to process aerial photographs: challenges and next steps. Can. Tech. Rep. Fish. Aquat. Sci. 3165: vi + 11 p.
- Carr, S.M., A.T. Duggan, G.B. Stenson and H.D. Marshall. 2015. Quantitative phylogenomics of within-species mitogenome variation: Monte Carlo and non-parametric analysis of phylogeographic structure among discrete transatlantic breeding areas of harp seals (Pagophilus groenlandicus). PLoS ONE 10(8): e0134207. doi:10.137/journal.pone.0134207
- Choy, E.S., Roth, J.D., Loseto, L.L. 2016. Lipid removal and acidification affect nitrogen and carbon stable isotope ratios of beluga whales and their potential prey species in the Beaufort Sea ecosystem. Marine Biology. 163: 220. doi:10.1007/s00227-016-2992-x
- Choy, E.S., Rosenberg, B., Roth, J.D., Loseto, L.L. 2017. Inter-a nnual variations in environmental factors affect prey and body condition of eastern Beaufort Sea beluga whales (Delphinapterus leucas). Marine Ecology Progress Series
- Citta, J.J., S. Okkonen, L.T. Quakenbush, W. Maslowski, R. Osinski, J. C. George, R.J. Small, H. Brower, M.P. Heide-Jørgensen, and L. A. Harwood. 2017. Oceanographic characteristics associated with autumn movements of bowhead whales in the Chukchi Sea. Deep Sea Research Part II Topical Studies in Oceanography. http://dx.doi.org/10.1016/j.dsr2.2017.03.009
- Citta, JJ, P Richard, LF Lowry, G O’Corry‐Crowe, M Marcoux, R Suydam, et al (2017) Satellite telemetry reveals population specific winter ranges of beluga whales in the Bering Sea. Marine Mammal Science 33 (1), 236-250
- Davis, G., Baumgartner, M.F., Bonnell, J.M., Bell, J., Berchok, C., Bort Thornton, J., Brault, S., Buchanan, G., Charif, R.A., Cholewiak, D., Clark, C., Corkeron, P., Delarue, J., Dudzinski, K., Hatch, L., Hildebrand, J.A., Hodge, L., Klinck, H., Kraus, S., Martin, B., Mellinger, D., Moors-Murphy, H., Nieukirk, S., Nowacek, D., Parks, S., Read, A., Rice, A.N., Risch, D., Sirovic, A., Soldevilla, M., Stafford, K., Stanistreet, J., Summers, E., Todd, S., Warde, A. and van Parijs, S. In press. Long-term passive acoustic recordings track the changing distribution of North Atlantic right whales (Eubalaena glacialis) from 2004 to 2014. Scientific Reports XX: XX-XX
- den Heyer, C. E., and W. D. Bowen. 2017. Estimating changes in vital rates of Sable Island grey seals using mark-recapture analysis. DFO Can. Sci. Advis. Sec. Res. Doc. 2017/054. v + 27 p.
- den Heyer, C.E., S.L.C. Lang, W.D. Bowen, and M.O. Hammill. 2017. Pup production at Scotian Shelf grey seal (Halichoerus grypus) colonies in 2016. DFO Can. Sci. Advis. Sec. Res. Doc. 2017/056. v + 35 p.
- Doniol-Valcroze, T, J-F Gosselin, D Pike & J Lawson. 2015. Spatial modelling of narwhal density in fiords during the 2013 High Arctic Cetacean Survey (HACS). DFO Can. Sci.Advis. Sec. Res. Doc. 2015/059. v + 31 p.
- Doniol-Valcroze, T, J-F Gosselin, D Pike, J Lawson, N Asselin, K Hedges & SH Ferguson. 2015. Abundance estimate of the Eastern Canada - West Greenland bowhead whale population based on the 2013 High Arctic Cetacean Survey. DFO Can. Sci. Advis. Sec. Res. Doc. 2015/058. v + 27 p.
- Doniol-Valcroze, T, J-F Gosselin, D Pike, J Lawson, N Asselin, K Hedges & SH Ferguson. 2015. Abundance estimates of narwhal stocks in the Canadian High Arctic in 2013. DFO Can. Sci. Advis. Sec. Res. Doc. 2015/060. v + 36 p.
- Doniol-Valcroze, T, MO Hammill, S Turgeon & LD Postma. 2016. Updated analysis of genetic mixing among Nunavik beluga summer stocks to inform population models and harvest allocation. DFO Can. Sci. Advis. Sec. Res. Doc. 2016/008. iv + 13 p.
- Doniol-Valcroze, T, A Mosnier & MO Hammill. 2016. Testing estimators of walrus abundance: insights from simulations of haul-out behavior. DFO Can. Sci. Advis. Sec.Res. Doc. 2016/40. v +18 p.
- Edwards, A.M., Haigh, R., Tallman, R., Swain, D.P., Carruthers, T.R., Cleary, J.S., Stenson, G. and Doniol-Valcroze, T. 2017. Proceedings of the Technical Expertise in Stock Assessment (TESA) National Workshop on ‘Incorporating an ecosystem approach into single-species stock assessments’ 21-25 November 2016, Nanaimo, British Columbia. Can. Tech. Rep. Fish. Aquat. Sci. 3213: vi + 53 p.
- Escajeda E, KL Laidre, EW Born, Ø Wiig, S Atkinson, M Dyck, SH Ferguson, NJ Lunn. 2017. Identifying shifts in maternity den phenology and habitat characteristics of polar bears (Ursus maritimus) in Baffin Bay and Kane Basin. Polar Biology DOI 10.1007/s00300-017-2172-6
- Ferguson SH, BG Young, DJ Yurkowski, R Anderson, C Willing, O Nielsen. 2017. Demographic, ecological, and physiological responses of ringed seals to an abrupt decline in sea ice availability. PeerJ 5:e2957; DOI 10.7717/peerj.2957
- Ford JKB, Pilkington JF, Riera A, Otsuki M, Gisborne B, Abernethy R, Stredulinsky EH, Towers JR, Ellis G (2017) Habitats of Special Importance to Resident Killer Whales (Orcinus orca) off the West Coast of Canada. Can. Sci. Advis. Sec. Res. Doc. 2017/035
- Frasier, T.R., Petersen, S.D., Postma, L.D., Johnson, L., Jorgensen, M.P.H., Ferguson, S.H. 2015. Abundance estimates of the Eastern Canada-West Greenland bowhead whale (Balaena mysticetus) population based on genetic capture-mark-recapture analyses. DFO Can. Sci. Advis. Sec. Res. Doc. 2015/0008. vii + 25p.
- Galicia, M.P., G.W. Thiemann, M.G. Dyck, S.H. Ferguson. 2015. Characterization of polar bear (Ursus maritimus) diets in the Canadian High Arctic. Polar Biology 38: 1983–1992
- Galicia, M.P., Thiemann, G.W., Dyck, M.G., Ferguson, S.H. and Higdon, J.W., 2016. Dietary habits of polar bears in Foxe Basin, Canada: possible evidence of a trophic regime shift mediated by a new top predator. Ecology and Evolution, 6(16), pp.6005-6018
- Gervaise, C., Aulanier, F., Simard, Y., and Roy, N. 2015. Mapping probability of shipping sound exposure level. The Journal of the Acoustical Society of America 137: EL429-EL435. http://dx.doi.org/10.1121/1.4921673
- Gomez, C., J.W. Lawson, A.J. Wright, A.D. Buren, D. Tollit, V. Lesage. 2016. A systematic review on the behavioural responses of wild marine mammals to noise: the disparity between science and policy. Canadian Journal of Zoology, 2016, 94(12): 801-819, https://doi.org/10.1139/cjz-2016-0098
- Gomez, C., J. Lawson, A. L. Kouwenberg, H. Moors-Murphy, A. Buren, C. Fuentes-Yaco, E. Marotte, Y. F. Wiersma & T. Wimmer, 2017. Predicted distribution of whales at risk: identifying priority areas to enhance cetacean monitoring in the Northwest Atlantic Ocean. Endangered Species Research 32:437-458
- Gosselin, J.-F., Hammill, M.O. and Mosnier, A. 2017. Indices of abundance for beluga (Delphinapterus leucas) in James Bay and eastern Hudson Bay in summer 2015. DFO Can. Sci. Advis. Sec. Res. Doc. 2017/019. vi + 28 p.
- Gosselin, J.-F., Hammill, M.O., Mosnier, A. and Lesage, V. 2017. Abundance index of St. Lawrence Estuary beluga, Delphinapterus leucas, from aerial visual surveys flown in August 2014 and an update on reported deaths. DFO Can. Sci. Advis. Sec. Res. Doc. 2017/019. v + 28 p.
- Gregr, E.J., Gryba, R., James, M.C., Brotz, L., and Thornton, S.J. 2015. Information relevant to the identification of critical habitat for Leatherback Sea Turtles (Dermochelys coriacea) in Canadian Pacific waters. DFO Can. Sci. Advis. Sec. Res. Doc. 2015/079. vii + 32p.
- Hammill, M.O., G.B. Stenson, T. Doniol-Valcroze and A. Mosnier. 2015. Conservation of Northwest Atlantic harp seals: past success, future uncertainty? Biological Conservation. 192:181-191
- Hammill, M.O., Stenson, G.B. and Mosnier, A. 2016. Science Advice on Theoretical Harvest Reduction Scenarios and Sustainable Catches of NWA harp seals? DFO Can. Sci. Advis. Sec. Res. Doc. 2016/055. v + 32 p.
- Hammill, M.O., P. Blanchfield, J.W. Higdon, D.B. Stewart, S.H Ferguson. 2016. Estimating abundance and total allowable removals for walrus in Foxe Basin. DFO Can. Sci. Advis. Sec. Res. Doc. 2016/014. iv + 20 p.
- Hammill M.O., J. Dale, G.B. Stenson, C.E. den Heyer, J-F Gosselin, and D. Johnston. 2016. Comparison of methods to estimate grey seal pup production at different colonies DFO Can. Sci. Advis. Sec. Res Doc. 2017/041. iv + 19 p.
- Hammill, MO, T Doniol-Valcroze, A Mosnier & J-F Gosselin. 2016. Modelling walrus population dynamics: A direction for future assessments. DFO Can. Sci. Advis. Sec.Res. Doc. 2016/50. v +47 p
- Hammill, M.O.,den Heyer, C.E., and Bowen, W.D. 2016. Grey Seal Population Trends in Canadian Waters, 1960-2016 and Harvest Advice. DFO Can. Sci. Advis. Sec. Res. Doc. 2017/052. vi + 30 p.
- Hammill, M.O., Young, R.A. and Mosnier, A and 2016. Evaluating impacts of flexible quota system on walrus harvesting. DFO Can. Sci. Advis. Sec. Res. Doc. 2016/112
- Hammill, MO, A Mosnier , J-F Gosselin, JW Higdon, DB Stewart, T Doniol-Valcroze, SH Ferguson & JB Dunn. 2016. Estimating abundance and total allowable removals for walrus in the Hudson Bay-Davis Strait and south and east Hudson Bay stocks. DFO Can. Sci. Advis. Sec.Res. Doc.2016/036. v + 37p.
- Hammill, M.O., and C. Sauvé. 2017. Growth and condition in harp seals-evidence of density dependent and density independent influences. ICES J. of Marine Science 74:1395-1407
- Hammill, M.O., J-F. Gosselin and G.B. Stenson. 2017. Pup production of Northwest Atlantic grey seals in the Gulf of St. Lawrence. DFO Can. Sci. Advis. Sec. Res. Doc. 2017/043. iv + 14 p.
- Hammill MO, Mosnier A, Gosselin J-F, Matthews CJD, Marcoux M, and Ferguson SH. 2017. Abundance of belugas in Hudson Bay. DFO Can. Sci. Advis. Sec. Res. Doc. 2017/nnn. vi + xx p.
- Hammill, M.O., Stenson, G.B., and Doniol-Valcroze, T. 2017. A management framework for Nunavik beluga. DFO Can. Sci. Advis. Sec. Res. Doc. 2017/060. v + 34 p.
- Harvey, J. and Bowen, D. 2016. Phoca vitulina ssp. concolor. The IUCN Red List of Threatened Species 2016: e.T17021A66991505.
- Harwood, L. A., Kingsley, M.C.S. and Pokiak, F. 2015. Monitoring beluga harvests in the Mackenzie Delta and near Paulatuk, NT, Canada: harvest efficiency and trend, size and sex of landed whales, and reproduction: 1970 to 2009. Canadian Manuscript Report Fisheries and Aquatic Sciences 3059
- Harwood, L. A., Smith, T. G., Auld, J. C., Melling, H. and Yurkowski, D. 2015. Seasonal movements and diving of ringed seals, Pusa hispida, in the western Canadian Arctic, 1999-2002 and 2010-2011. Arctic 68(2): 193-209
- Harwood, L.A., Smith, T.G., George, J.C., Sandstrom, S.J., Wojciech, W., and Divoky, G. J. 2015. Changes in the Beaufort Sea ecosystem: diverging trends in the body condition of marine mammals, seabirds and anadromous char revealed through long-term monitoring. Progress in Oceanography, Special Issue, Synthesis of Arctic Research (SOAR). http://dx.doi.org/10.1016/j.pocean.2015.05.003
- Harwood, L. A., Quakenbush L. T, Small R. J, George J. C., Pokiak, J., Pokiak, C. Heide-Jørgensen M. P., and Brower H. 2017. Movements, habitat use, and inferred foraging by bowhead whales in the Canadian Beaufort Sea during August-September, 2006-2012. Arctic 70(2): 161 - 176. https://doi.org/10.14430/arctic4648
- Harwood, L,A., Zhu, X., Angasuk, L., Emaghok, L., Ferguson, S., Gruben, C., Gruben, P., Hall, P., Illasiak, J., Illasiak, J., Inglangasuk, G., Lea, E.V., Loseto, L., Norton, P., Pokiak, C., Pokiak, F., Rogers, H., Snow, K., and Storr, W. 2017. Research, monitoring and hunter knowledge in support of the 2017 assessment of the status of Eastern Beaufort Sea Beluga stock. DFO Can. Sci. Advis. Sec. Res. Doc. 2017/nnn. vi + 16 p.
- Hays, G. C., L. C. Ferreira, et al. 2016. Key Questions in Marine Megafauna Movement Ecology. Trends in Ecology & Evolution 31(6): 463-475, doi:10.1016/j.tree.2016.02.015
- Higdon JW and SH Ferguson. 2017. Database of aerial surveys and abundance estimates for beluga whales (Delphinapterus leucas) and narwhals (Monodon monoceros) in the Canadian Arctic. Canadian technical report of fisheries and aquatic sciences no. 3211 https://waves-vagues.dfo-mpo.gc.ca/library-bibliotheque/4058544x.pdf
- Hoover, C., Ostertag, S., Hornby, C., Parker, C., Hansen-Craik, K., Loseto, L.L, Pearce, T. 2016. The Continued Importance of the Hunting for Inuit Food Security. Solutions, 7 (4): 40-51
- Hornby, C., Iacozza, J., Hoover, C., Barber, D., Loseto, L.L. 2016. Spring habitat use of beluga whales (Delphinapterus leucas) during arrival to the Mackenzie River Estuary. Polar Biology. DOI 10.1007/s00300-16-1899-9
- Hornby, C., Iacozza, J., Hoover, C., Barber, D., Loseto, L.L. 2017. Beluga whale Delphinapterus leucas late summer habitat use and support for foraging areas in the Canadian Beaufort Sea. Marine Ecology Progress Series 574: 243-257
- Houde, M., Wang, X., Ferguson, S.H., Gagnon, P., Brown, T.M., Tanabe, S., Kunito, T., Kwan, M. and Muir, D.C.G., 2017. Spatial and temporal trends of alternative flame retardants and polybrominated diphenyl ethers in ringed seals (Phoca hispida) across the Canadian Arctic. Environmental Pollution 223: 266-276
- Hussey, N.E., Hedges, K.J., Barkley, A.N., Treble, M.A., Peklova, I., Webber, D.M., Ferguson, S.H., Yurkowski, D.J., Kessel, S.T., Bedard, J.M. and Fisk, A.T., 2017. Movements of a deep‐water fish: establishing marine fisheries management boundaries in coastal Arctic waters. Ecological Applications 27(3), pp.687-704
- Ford, John K. B., James F. Pilkington, Brian Gisborne, Timothy R. Frasier, Robin M. Abernethy and Graeme M. Ellis. 2016. Recent observations of critically endangered North Pacific right whales (Eubalaena japonica) off the west coast of Canada. Marine Biodiversity Records 9:50
- Ford, JKB., James F. Pilkington, Amalis Riera, Mayuko Otsuki, Brian Gisborne, Robin M. Abernethy, Eva H. Stredulinsky, Jared R. Towers, and Graeme M. Ellis. 2017. Habitats of Special Importance to Resident Killer Whales (Orcinus orca) off the West Coast of Canada. CSAS Research Document 2017/035. viii + 57 p.
- Kelley TC, Stewart REA, Yurkowski DJ, Ryan A, Ferguson SH. 2015. Mating ecology of beluga (Delphinapterus leucas) and narwhal (Monodon monoceros) as estimated by reproductive tract metrics. Mar Mamm Sci 31: 479-500. DOI: 10.1111/mms.12165
- Kinda, B., Simard, Y., Gervaise, C., Mars, J.I., and Fortier, L. 2015. Arctic underwater noise transients from sea ice deformation: characteristics, annual time-series, and forcing in Beaufort Sea. The Journal of the Acoustical Society of America 138(4): 2034-2045. http://dx.doi.org/10.1121/1.4929491
- Koski WR, Gamage G, Davis AR, Mathews T, LeBlanc B, Ferguson SH. 2015. Evaluation of UAS for photographic re-identification of bowhead whales, Balaena mysticetus. Journal of Unmanned Vehicle Systems. 3: 22-29
- Kowarski, K., Evers, C., Moors-Murphy, H.B., Martin, B. and Denes, S.L. In press. Singing through winter nights: The seasonal and diel occurrence of humpback whale calls in and around the Gully MPA, offshore eastern Canada. Canadian Journal of Zoology
- Laidre KL, Stern H, Kovacs KM, Lowry L, Moore SE, Regehr EV, Ferguson SH, Wiig O, Boveng P, Angliss RP, Born EW, Litovka D, Quakenbush L, Lydersen C, Vongraven D, and Ugarte F. 2015. A circumpolar assessment of Arctic marine mammals and sea ice loss, with conservation recommendations for the 21st century. Conservation Biology 29: 724-737
- Lavoie, D., Chassé, J., Simard, Y., Lambert, N., Galbraith, P.S., Roy, N., Brickman, D. 2016. Large-scale atmospheric and oceanic control on krill transport into the St. Lawrence estuary evidenced with 3D numerical modelling. Atmosphere-Ocean 54: 299-325. http://dx.doi.org/10.1080/07055900.2015.1082965
- Lawson, J.W., and Gosselin, J.-F. In press. Distribution and preliminary abundance estimates for cetaceans seen during Canada’s 2016 NAISS marine megafauna survey. Department of Fisheries and Oceans. DFO Can. Sci. Advis. Sec. Res. Doc. 2017/in press
- Lawson, J.W., and Lesage, V. 2016. Modelling ship strike risks for marine mammals and sea turtles. Department of Fisheries and Oceans. DFO Can. Sci. Advis. Sec. Res. Doc. 2016/in press
- LeBot, O., Mars, J.I., Gervaise, C., and Simard, Y. 2015. Cross recurrence plot analysis-based method for TDOA estimation of underwater acoustic signals on hydrophone array. IEEE Proceedings of the International Workshop on Computational Advances in Multi-Sensor Adaptive Processing (CAMSAP). Cancun Mexico, Dec. 13-16. pp. 325-328
- LeBot, O., Mars, J.I., Gervaise, C., and Simard, Y. 2015. Rhythmic analysis for click train detection and source separation with examples on beluga whales. Applied Acoustics 95:37-49. DOI: 10.1016/j.apacoust.2015.02.005
- LeBot, O., Simard, Y., Roy, N., Mars, J.I., and Gervaise, C. 2016. Whistle source levels of free-ranging beluga whales in Saguenay-St. Lawrence marine park. Journal of the Acoustical Society of America 140: EL89-EL93
- Lesage, V., Gavrilchuk, K., Andrews, R.D., and Sears, R. 2016. Wintering areas, fall movements and foraging sites of blue whales satellite-tracked in the Western North Atlantic. DFO Can. Sci. Advis. Sec. Res. Doc. 2016/078. v + 38 p.
- Lesage, V., Gosselin, J.-F., Lawson, J.W., McQuinn, I., Moors-Murphy, H., Plourde, S., Sears, R., Simard, Y. 2016. Information relevant to the assessment of the critical habitat of blue whales (Balaenoptera musculus) in the Northwest Atlantic. DFO Can. Sci. Advis. Sec. Res. Doc. 2016/nnn. vi + xx p.
- Lesage V, Gavrilchuk K, Andrews RD, Sears R (2017) Foraging areas, migratory movements and winter destinations of blue whales from the western North Atlantic. Endangered Species Research 34:27-43. https://doi.org/10.3354/esr00838
- Lesage, V., Omrane, A., Doniol-Valcroze, T., & Mosnier, A. 2017. Increased proximity of vessels reduces feeding opportunities of blue whales in the St. Lawrence Estuary, Canada. Endangered Species Research 32:351-361
- Lillie, M.A., A.W. Vogl, S. Raverty, M. Haulena, W.A. McLellan, G.B. Stenson and R.E. Shadwick. In press. Controlling Thoracic Pressures in Cetaceans During a Breath Hold Dive: Importance of the Diaphragm. Journal of Experimental Biology
- Loseto, L.L., Stern, G.A., Macdonald, R.M. 2015. Distant drivers or local signals: where do mercury trends in western Arctic belugas originate? Science of the Total Environment, 509-510 (226-236)
- Maps, F., Plourde, S., McQuinn, I. H., St-Onge-Drouin, S., Lavoie, D., Chassé, J. and Lesage, V. (2015), Linking acoustics and finite-time Lyapunov exponents reveals areas and mechanisms of krill aggregation within the Gulf of St. Lawrence, eastern Canada. Limnology & Oceanography 60: 1965–1975. doi:10.1002/lno.10145
- Marcoux, M., V. Lesage, G.W. Thiemann, S.J. Iverson, S.H. Ferguson. 2015. Age estimation of belugas, Delphinapterus leucas, using fatty acid composition: A promising method. Marine Mammal Science 31: 944-962. DOI: 10.1111/mms.12212
- Marcoux, M., Ferguson, S.H., Roy, N., Bédard, J., and Simard, Y. 2016. Seasonal marine mammal occurrence detected from passive acoustics in Scott Inlet, Nunavut. Polar Biology 1-12. (on line 2016-10-19) DOI 10.1007/s00300-016-2040-9
- Marcoux, M., and Hammill, M.O. 2016. Model estimates of Cumberland Sound beluga (Delphinapterus leucas) population size and total allowable removals. DFO Can. Sci. Advis. Sec. Res. Doc. 2016/077. iv + 35 p.
- Marcoux, M, SH Ferguson, N Roy, JM Bedard, Y Simard (2017) Seasonal marine mammal occurrence detected from passive acoustic monitoring in Scott Inlet, Nunavut, Canada. Polar Biology 40 (5), 1127-1138
- Marcoux, M., Young, B., Asselin, N.C., Watt, C.A., Dunn, J.B., and Ferguson, S.H. (2016) Estimate of Cumberland Sound beluga (Delphinapterus leucas) population size from the 2014 visual and photographic aerial survey. DFO Can. Sci. Advis. Sec. Res. Doc. 2016/037. iv + 19 p.
- Martinez-Levasseur, L.M., C.M. Furgal, M.O. Hammill and G. Burness. 2016. Towards a Better Understanding of the Effects of UV on Atlantic Walruses, Odobenus rosmarus rosmarus: a Study Combining Histological Data with Local Ecological Knowledge. PLoS ONE 11(4): e0152122. doi:10.1371/ journal.pone.0152122
- Martinez-Levasseur, L.M., C.M Furgal, M.O. Hammill. 2017. Challenges and strategies when mapping local ecological knowledge in the Canadian Arctic : the importance of defining the geographic limits of participant’s common areas of observations. Polar Biology DOI 10.1007/s00300-016-2071-2
- Matthews C.J.D. and Ferguson S.H. 2015. Seasonal foraging behavior of Eastern Canada-West Greenland bowhead whales: an assessment of seasonal isotopic cycles along baleen. Marine Ecology Progress Series 522: 269-286
- Matthews C.J.D. and Ferguson S.H. 2015. Weaning age variation in beluga whales (Delphinapterus leucas). Journal of Mammalogy 96: 425-437
- Matthews, C.J., Longstaffe, F.J. and Ferguson, S.H., 2016. Dentine oxygen isotopes (δ18O) as a proxy for odontocete distributions and movements. Ecology and Evolution, 6(14), pp.4643-4653
- Matthews, C.J.D., Watt, C.A., Asselin, N.C., Dunn, J.B., Young, B.G., Montsion, L.M., Westdal, K.H., Hall, P.A., Orr, J.R., Ferguson, S.H., and Marcoux, M. 2017. Estimated abundance of the Western Hudson Bay beluga stock from the 2015 visual and photographic aerial survey. DFO Can. Sci. Advis. Sec. Res. Doc. 2017/061. v + 18 p.
- McQuinn, I.H., Gosselin, J.-F., Bourassa, M.-N., Mosnier, A., St-Pierre, J.-F., Plourde, S., Lesage, V., Raymond, A. 2016. The spatial association of blue whales (Balaenoptera musculus) with krill patches (Thysanoessa spp. and Meganyctiphanes norvegica) in the estuary and northwestern Gulf of St. Lawrence. DFO Can. Sci. Advis. Sec. Res. Doc. 2016/104. iv + 19 p.
- Moore, S.E., E. Logerwell, L. Eisner, E. Farley, L. Harwood, K. Kuletz, J. Lovvorn, J. Murphy, L. Quakenbush. 2014. Pg. 337-392, Marine Fishes, Birds and Mammals as Sentinels of Ecosystem Variability and Reorganization in the Pacific Arctic Region. Pg. 337-392, in: Grebmeier, J. M. and Maslowski, W. Eds., The Pacific Arctic Sector: Status And Trends. Springer.
- Moors-Murphy, H.B., Lawson, J.W., Gomez, C., Rubin, B., Marotte, E., and Renaud, G. 2016. Occurrence of blue whales (Balaenoptera musculus) off Nova Scotia, Newfoundland, and Labrador. DFO Canadian Science Advisory Secretariat Research Document. 2016/in press.
- Moors-Murphy, H.B. and J.A. Theriault. 2017. Review of Mitigation Measures for Cetacean Species at Risk During Seismic Survey Operations. DFO Can. Sci. Advis. Sec. Res. Doc. 2017/008. Vi + 38 p.
- Morgan, J., M. Koen-Alonso, R. Rideout. A.D. Buren & D. Maddock Parsons. In Press. Growth and condition in relation to the lack of recovery of the Northern cod. ICES Journal of Marine Science: Journal du Consei
- Morin, P.A., Parsons, K.M., Archer, F.I., Ávila-Arcos, M.C., Barrett-Lennard, L.G., Dalla Rosa, L., Duchêne, S., Durban, J.W., Ellis, G., Ferguson, S.H., Ford, J.K., Ford, M., Garilao, C., Gilbert, M.T.P., Kaschner, K., Matkin, C.O., Petersen, S.D., Robertson, K.M., Visser, I.N., Wade, P.R., Ho, S.Y.W., Foote, A.D., 2015. Geographic and temporal dynamics of a global radiation and diversification in the killer whale. Molecular Ecology 24, 3964-3979
- Mosnier, A, T. Doniol-Valcroze, J.-F. Gosselin, V. Lesage, L.N. Measures and M.O. Hammill . 2015. Insights into processes of population decline using an integrated population model: the case of the St. Lawrence Estuary beluga (Delphinapterus leucas). Ecological Modelling 314:15-31
- Mosnier, A., Gosselin, J.-F., Lawson, J.W., Plourde, S., and Lesage, V. In press. Predicting seasonal occurrence of leatherback turtles (Dermochelys coriacea) in eastern Canadian waters from turtle and sunfish (Mola mola) sighting data and habitat characteristics. Canadian Journal of Zoology
- Mosnier, A., Larocque, R., Lebeuf, M., Gosselin, J.-F., Dubé, S., Lapointe, V., Lesage, V., Lefaivre, D., Senneville, S., Chion, C. 2016. Définition et caractérisation de l’habitat du béluga (Delphinapterus leucas) de l’estuaire du Saint-Laurent selon une approche écosystémique. Secr. can. de consult. sci. du MPO. Doc. de rech. 2016/052. vi + 93 p.
- Mosnier, A., Hammill, M.O., Turgeon, S., and Postma L. 2017. Updated analysis of genetic mixing among beluga stocks in the Nunavik marine region and Belcher Islands area: information for population models and harvest allocation. DFO Can. Sci. Advis. Sec. Res. Doc. 2017/016. v + 15 p.
- Moxley, J.H., Bogomolni, A., Hammill, M., Moore, K., Polito, M. Sette, L., Sharp, B., Waring, G., Gilbert, J., Halpin, P., and Johnston, D.W. 2017. Google Haul Out: Earth-Observation Imagery and Digital Aerial Surveys in Coastal Wildlife Management and Abundance Estimation. Bioscience 67:760-768
- Newsome, S.D., Tinker, M.T., Gill, V.A., Hoyt, Z.N., Doroff, A., Nichol, L., Bodkin, J. 2015. The interaction of intraspecific competition and habitat on individual diet specialization: a near range-wide examination of sea otters. Oecologia, 178 (1): 45-59
- Nichol, L.M. Abernethy, R.M. Wright, B.M., Heaslip, S. Spaven L.D., Towers, J.R., Pilkington J.F., Stredulinsky E.H. and Ford J.K.B. 2017. Distribution, movements and habitat fidelity patterns of Fin Whales (Balaenoptera physalus) in Canadian Pacific Waters. DFO Can. Sci. Advis. Sec. Res. Doc. 2017/004. vii + 50 p.
- Nichol, L.M. Conservation in Practice. In: Sea Otter Conservation. Larson,S., Bodkin, J., VanBlaricom, G. Elsevier Inc. 2015. pp 365-389
- Nichol, L.M., Watson J.C., Abernethy, R, Rechsteiner, E., Towers, J. 2015. Trends in the abundance and distribution of sea otters (Enhydra lutris) in British Columbia updated with 2013 survey results. DFO Can. Sci. Advis. Sec. Res. Doc. 2015/039. vii + 31 p.
- Nichol, L.M., Ford, J.K.B. 2016. Information in Support of the Identification of Critical Habitat for Fin Whales (Balaenoptera physalus) in Canadian Pacific Waters. DFO Can. Sci. Advis. Sec. Res. Doc. 2016/nnn. vii + 35 p.
- Nichol, L.M., Wright, B.M., O’Hara, P., and Ford, J.K.B. 2017. Assessing the risk of lethal ship strikes to humpback (Megaptera novaeangliae) and fin (Balaenoptera physalus) whales off the west coast of Vancouver Island, Canada. DFO Can. Sci. Advis. Sec. Res. Doc. 2017/007. vii + 33 p.
- Nichol, L.M., Wright, B.M., O’Hara, P., and Ford, J.K.B. 2017. Risk of lethal vessel strikes to humpback and fin whales off the west coast of Vancouver Island, Canada. Endangered Species Research 32: 373-390
- O-Corry-Crowe, G., Mahoney, A. Suydam, R. Quakenbush, L., Whiting, A., Lowry, L., Ferreira, L., Tazruk, J., Saccheus, C., Harwood, L. 2016. Genetic profiling links changing sea ice to shifting beluga whale migration patterns. Biology Letters 12: 20160404. http://rsbl.royalsocietypublishing.org
- Payne, J.F., Andrews, C.D., Hanlon, J., Lawson, J.W., Mathieu, A., Wadsworth, A., and French, B. 2015. Effects of seismic air-gun sounds on lobster (Homarus americanus): Pilot laboratory studies with (i) a recorded track from a seismic survey and (ii) air-gun pulse exposures over 5 days. Environmental Studies Research Fund. 197: 38 p.
- Pedro S, A Fisk, G Tomy, SH Ferguson, N Hussey, ST Kessel, MA McKinney. 2017. Mercury and persistent organic pollutants in native and invading forage species of the Canadian Arctic: Consequences for food web dynamics. Environmental Pollution 229: 229-240
- Perry, E., G.B. Stenson & A.D. Buren. 2016. Attendance and nursing patterns of harp seals in the harsh environment of the northwest Atlantic. Polar Biology. DOI: 10.1007/s00300-016-1938-6
- Pike, D & T Doniol-Valcroze. 2015. Identification of duplicate sightings from the 2013 double-platform High Arctic Cetacean Survey. DFO Can. Sci. Advis. Sec. Res. Doc. 2015/034. v + 22 p.
- Pilkington, James, Eva Stredulinsky, Robin M. Abernethy, John K. B. Ford. Patterns of Fin Whale (Balaenoptera physalus) Seasonality and Relative Distribution in Canadian Pacific Waters Inferred from Passive Acoustic Monitoring. DFO Can. Sci. Advis. Sec. Res. Doc. 2017/XXX. vii + 29 p.
- Pleskach, K., Hoang, W., Chu, M., Haldorson, T., Loseto, L.L., Ferguson, S., Tomy G. 2016. Use of mass spectrometry to measure aspartic acid racemization for ageing beluga whales. Marine Mammal Science 32: 1370–1380
- Plourde, S., Lehoux, C., McQuinn, I.H., and Lesage, V. 2016. Describing krill distribution in the western North Atlantic using statistical habitat models. DFO Can. Sci. Advis. Sec. Res. Doc. 2016/111. v + 34 p.
- Pomerleau C, Heide-Jørgensen, MP, Ferguson, SH, Stern, H., Høyer, J.L., Stern, GA. 2017. Reconstructing variability in West Greenland ocean biogeochemistry and bowhead whale (Balaena mysticetus) food web structure using amino acid isotope ratios. Polar Biology in press doi:10.1007/s00300-017-2136-x
- Puryear, Wendy B., M. Keogh, N. Hill, J. Moxley, E. Josephson, K.R. Davis, C. Bandoro, D. Lidgard, A. Bogomolni, M. Levin, Lang S.,Hammill, M.,Bowen,W.D., Johnston, D.W., Romano, T., Waring, G. , and Runstadler. 2016. Prevalence of influenza A virus in live-captured North Atlantic gray seals: a possible wild reservoir. Emerging Microbes and Infections 5. e81; doi:10.1038/emi.2016.77
- Rice, Ally, Volker B. Deecke, John K. B. Ford, James F. Pilkington, Erin M. Oleson, John A. Hildebrand, Ana Sirovic. 2017. Spatial and temporal occurrence of killer whale ecotypes off the outer coast of Washington State, USA. Marine Ecology Progress Series 572: 255-268
- Roy, N., et Simard, Y. 2015. Bruit ambiant et fréquentation de la région de Cacouna par le béluga du Saint-Laurent à l’été 2014 par monitorage acoustique continu. Rapp. tech. can. sci. halieut. aquat. 3141: vi+22 pp. publications.gc.ca/collections/collection_2015/mpo-dfo/Fs97-6-3141-fra.pdf
- Salewski, V., and Watt, C.A. (2016) Bergmann’s rule – a biophysiological rule examined in birds. Oikos. Doi: 10.1111/oik.03698
- Sauvé,CC, G Beauplet, MO Hammill, and I Charrier. 2015. Acoustic analysis of airborne, underwater, and amphibious mother attraction calls by wild harbor seal pups (Phoca vitulina). Journal of Mammalogy DOI:10.1093/jmammal/gyv064
- Sauvé,CC, G Beauplet, MO Hammill, and I Charrier. 2015. Mother-pup vocal recognition in harbour seals: influence of maternal behaviour, pup voice and habitat sound properties. Animal Behaviour 105:109-120
- Savenkoff, Claude, Jacques A. Gagné, Michel Gilbert, Martin Castonguay, Denis Chabot, Joël Chassé, Sophie Comtois, Jean-Denis Dutil, Peter S. Galbraith, Jean-François Gosselin, François Grégoire, Richard Larocque, Pierre Larouche, Diane Lavoie, Michel Lebeuf, Véronique Lesage, Frédéric Maps, Ian H. McQuinn, Arnaud Mosnier, Claude Nozères, Patrick Ouellet, Stéphane Plourde, Bernard Sainte-Marie, Louise Savard, Michael Scarratt, Michel Starr. Le concept d’approche écosystémique appliqué à l’estuaire maritime du Saint-Laurent (Canada). 2017. Environmental Reviews 25(1): 26-96, doi.org/10.1139/er-2015-0083
- Scheuhammer, A., Braune, B., Chan, H-M., Frouin, H., Krey, A., Letcher, R., Loseto, L., Noel, M., Ostertag, S., Ross, P., Wayland, M. 2015. Recent progress on our understanding of the biological effects of mercury in fish and wildlife in the Canadian Arctic. Science of the Total Environment, 509-510: 91-103
- Sciullo L, GW Thiemann, NJ Lunn, SH Ferguson. In press. Intraspecific and temporal variability in the diet composition of female polar bears in a seasonal sea ice regime. Arctic Science
- Seymour, A.C., J. Dale, M. Hammill, P.N. Halpin, and D.W. Johnston.2017. Automated detection and enumeration of marine wildlife using unmanned aircraft systems (UAS) and thermal imagery. Scientific Reports 7 :000-000. http://dx.doi.org/10.1038/srep45127. Published online 24 March 2017
- Simard, Y., Bandet, M., Gervaise, C., Roy N., and Aulanier, F. 2016. Soundscape cube: A holistic approach to explore and compare acoustic environments. In: Proceedings of Meeting on Acoustics 27(1):070012. pp. 1-8. Fourth International Conference on the Effects of Noise on Aquatic Life, Dublin, Ireland. 10-15 July. http://dx.doi.org/10.1121/2.0000319
- Simard, Y., Roy N., Aulanier, F., and Giard, S. 2016. Blue whale continuous frequentation of the St. Lawrence system from multi-year PAM time series. DFO Can. Sc. Adv. Sec. Res. Doc. 2016/091. v + 14 p. http://www.dfo-mpo.gc.ca/csas-sccs/Publications/ResDocs-DocRech/2016/2016_091-eng.html
- Simard, Y., Roy, N., Gervaise, C., Giard, S. 2016. A seaway acoustic observatory in action: The St. Lawrence Seaway. Chapter 128. In: Popper, A. N. and Hawkins, A. eds. The effects of noise on aquatic life II. Springer Science+Business Media, LLC, New York. Series: Advances in Experimental Medicine and Biology, Vol. 875. Chapter 128. pp. 1031-1040. (Proc. Third International Conference on The Effects of Noise on Aquatic Life, August 11-16, 2013, Budapest, Hungary.) DOI 10.1007/978-1-4939-2981-8
- Simard, Y., Roy, N., Gervaise, C., Giard, S. 2016. Analysis and modeling of 255 ship source levels from an acoustic observatory along St. Lawrence Seaway. Journal of the Acoustical Society of America 140(3):2002-2018. http://dx.doi.org/10.1121/1.4962557
- Simond, AE, Magali Houde Véronique Lesage Jonathan Verreault. 2017. Temporal trends of PBDEs and emerging flame retardants in belugas from the St. Lawrence Estuary (Canada) and comparisons with minke whales and Canadian Arctic belugas. Environmental Research Volume 156: 494-504
- Smith AJ, JW Higdon, P Richard, J Orr, W Bernhardt, SH Ferguson. In press. Beluga whale summer habitat associations in the Nelson River Estuary, western Hudson Bay, Canada. PlosOne
- Stanistreet, J.E., Nowacek, D.P., Baumann-Pickering, S., Bell, J.T., Cholewiak, D.M., Hildebrand, J.A., Hoidge, L.E.W., Moors-Murphy, H.B., Van Parijs, S.M. and Read, A.J. 2017. Using passive acoustic monitoring to document the distribution of beaked whale species in the western North Atlantic Ocean. Canadian Journal of Fisheries and Aquatic Sciences. E-first article: 1-12 pp.
- Stanistreet, J.E., Nowacek, D.P., Read, A.J., Baumann-Pickering, S., Moors-Murphy, H.B. and Van Parijs, S.M. 2016. Effects of duty-cycled passive acoustic recordings on detecting the presence of beaked whales in the Northwest Atlantic. Journal of Acoustical Society of America. 140: EL31, 7 pp.
- Stenson, G.B., A.D. Buren and M. Koen-Alonso. 2016. The impact of changing climate and abundance on reproduction in an ice-dependent species, the Northwest Atlantic harp seal, Pagophilus groenlandicus. ICES. Journal of Marine Science 73:250-262
- Stewart, R.E.A., Stewart, D.B. and Higdon, J.W. 2017. Report of the 2016 workshop to inform the DFO five-year research plan for Atlantic walruses in Canada. Canadian Technical Report of Fisheries and Aquatic Sciences 3200: vi + 90 p.
- Stocki, T.J., Gamberg, M., Loseto, L., Pellerin, E., Bergman, L., Mercier, J., Genovesi, L., Cooke, M., Todd, B., Whyte, J., Wang, X. 2016. Measurements of cesium in Arctic beluga and caribou before and after the Fukushima accident of 2011. Journal of Environmental Radioactivity 2016: 162-163: 379-387
- Stredulinsky EH (2016) Determinants of group splitting: an examination of environmental, demographic, genealogical and state-dependent factors of matrilineal fission in a threatened population of fish-eating killer whales (Orcinus orca). MSc thesis, University of Victoria.
- Swain, DP, H Benoit and MO Hammill. 2015. Spatial distribution of fishes in a Northwest Atlantic ecosystem in relation to risk of predation by a marine mammal. Journal of Animal Ecology 84: 1286-1298. DOI: 10.1111/1365-2656.12391
- Themelis, D., Harris, L., and Hayman, T. 2016. Preliminary analysis of human-induced injury and mortality to cetaceans in Atlantic Canada. DFO Can. Sci. Advis. Sec. Res. Doc. 2016/085. v + 15 p.
- Theriault, J.A. and Moors-Murphy, H.B. 2015. Species at Risk criteria and seismic survey noise thresholds for cetaceans. DFO Can. Sci. Advis. Sec. Res. Doc. 2015/078. v + 42 p.
- Trana, M.R., Roth, J.D., Tomy, G.T., Anderson, W.G. and Ferguson, S.H., 2016. Increased blubber cortisol in ice-entrapped beluga whales (Delphinapterus leucas). Polar Biology, 39(9), pp.1563-1569
- Trzcinski, M. K. and W. D. Bowen 2016. The recovery of Atlantic halibut: a large, long-lived, and exploited marine predator. ICES Journal of Marine Science 73(4): 1104-1114
- Ure, D.L., W.D. Bowen, and C.E. den Heyer. 2016. Grey seal population status and trends, Sable Island National Park Reserve, in State of Park Assessment Technical Report
- Watt CA, and SH Ferguson. 2015. Fatty acids and stable isotopes (δ13C and δ15N) reveal temporal changes in narwhal (Monodon monoceros) diet linked to migration patterns. Marine Mammal Science 31: 21-44
- Watt CA, JR Orr, MP Heide-Jorgensen, NH Nielsen, SH Ferguson. 2015. Differences in dive behavior among the world’s three narwhal Monodon Monoceros populations correspond with dietary differences. Marine Ecology Progress Series 525: 273-285
- Watt, C.A., Orr, J.R., and Ferguson, S.H. 2015. A shift in foraging behaviour of beluga whales Delphinapterus leucas from the threatened Cumberland Sound population may reflect a changing Arctic food web. Endangered Species Research. 31: 259-270. Doi: 10.3354/esr00768.
- Watt, C.A., Marcoux, M., Asselin, N.C., Orr, J.R., and Ferguson, S.H. 2015. Instantaneous availability bias correction for calculating aerial survey abundance estimates for narwhals (Monodon monoceros) in the Canadian High Arctic. DFO Can. Sci. Advis. Sec. Res. Doc. 2015/044. vi +13 p.
- Watt, C.A., Marcoux, M., Leblanc, B., and Ferguson, S.H. 2015. Instantaneous availability bias correction for calculating aerial survey abundance estimates for bowhead whales (Balaena mysticetus) in the Canadian High Arctic. DFO Can. Sci. Advis. Sec. Res. Doc. 2015/046. vi +21 p.
- Watt, C.A., Orr, J.R., Heide-Jørgensen, M.P., Nielsen, N.H., and Ferguson, S.H. 2015. Differences in dive behaviour among the world’s three narwhal (Monodon monoceros) populations correspond with dietary differences. Marine Ecology Progress Series 525: 273-285
- Watt, C.A., Petersen, S.D., and Ferguson, S.H. 2015. Genetics and fatty acids assist in deciphering narwhal (Monodon monoceros) social groupings. Polar Biology 38: 1971-1981. DOI: 10.1007/s00300-015-1756-2
- Watt, C.A., Orr, J.R., and Ferguson, S.H. 2017. Spatial distribution of narwhal (Monodon monoceros) diving for Canadian populations helps identify important seasonal foraging areas. Canadian Journal of Zoology 95: 41-50
- Watt, C.A., Marcoux, M., Dunn, J.B., Hodgson, R., Moore, R., and Ferguson, S.H. In press. Effect of the 2015 narwhal (Monodon monoceros) entrapment on the Eclipse Sound narwhal stock. DFO Can. Sci. Advis. Sec. Res. Doc. 2017/XXX
- Watt CA, Witting, L., Marcoux, M., Doniol-Valcroze, T., Guldborg Hansen, R., Hobbs, R., Lee, D.S., Ferguson, S.H., and Heide-Jørgensen, M.P. 2017. Harvest allocation modelling for narwhal (Monodon monoceros) stocks shared between eastern Canada and West Greenland. DFO Can. Sci. Advis. Sec. Res. Doc. 2017/nnn. vi + xx p.
- Weitzman. J., C. den Heyer, and W. D. Bowen 2017. Factors influencing and consequences of breeding dispersal and habitat choice in female grey seals (Halichoerus grypus) on Sable Island, Nova Scotia. Oecologia 183: 367-378, doi:10.1007/s00442-016-3764-5
- Wells, N.J., G.B. Stenson, P. Pepin and M. Koen-Alonso. 2017. Identification and Descriptions of Ecologically and Biologically Significant Areas in the Newfoundland and Labrador Shelves Bioregion. DFO Can. Sci. Advis. Sec. Res. Doc. 2017/013
- Wells, N.J., Warren, M.A., Gullage, L., Pretty, C., Koen-Alonso, M., Lawson, J.W., Wareham, V., Tucker, K., Allard, K., Robertson, G., Fifield, D., Gjerdrum, C., Hedd, A., and Wilhelm, S. In press. Recommended design strategies for the development of a marine protected area network in the Newfoundland and Labrador shelves bioregion. Department of Fisheries and Oceans. DFO Can. Sci. Advis. Sec. Res. Doc. 2017/XXX
- Westdal KH, Davies J, MacPherson A, Orr J, Ferguson SH. 2016. Behavioural changes in belugas (Delphinapterus leucas) during a killer whale (Orcinus orca) attack in southwest Hudson Bay. Canadian Field-Naturalist 130(4): 315-319
- Westdal, K.H., Higdon, J.W. and Ferguson, S.H., Review of killer whale (Orcinus orca) ice entrapments and ice-related mortality events in the Northern Hemisphere. Polar Biology pp.1-7.
- Williams, R., Lacy, R.C., Ashe, E., Hall, A., Lehoux, C., Lesage, V., McQuinn, I., Plourde, S. 2017. Predicting responses of St. Lawrence beluga to environmental change and anthropogenic threats to orient effective management actions. DFO Can. Sci. Advis. Sec. Res. Doc. 2017/027. v + 44 p.
- Wright BM, Stredulinsky EH, Ellis GM, and Ford JKB. 2016. Kin-directed prey sharing promotes lifetime natal philopatry of both sexes in a population of fish-eating killer whales, Orcinus orca. Animal Behaviour 115:81-95
- Wright BM, Ford JKB, Ellis GM, Deecke VB, Shapiro AD, Battaile BC, Trites AW. 2017. Fine-scale foraging movements by fish-eating killer whales (Orcinus orca) relate to the vertical distributions and escape responses of salmonid prey (Oncorhynchus spp.). Movement Ecology 5:3
- Young, BG, SH Ferguson, NJ Lunn. 2015. Variation in indices of ringed seal density and abundance in western Hudson Bay determined from aerial surveys, 1995 to 2013. Arctic 68: 301-309
- Young, B.G. and Ferguson, S.H. 2016. Comparison of photographic and visual surveys of ringed seals in western Hudson Bay. Can. Tech. Rep. Fish. Aquat. Sci. 3153: iii + 11 p.
- Yurkowski DJ, NE Hussey, C Semeniuk, SH Ferguson, and AT Fisk. 2015. Effects of lipid-extraction and the utility of lipid-normalization models on δ13C and δ15N values in arctic marine mammal tissues. Polar Biology 38: 131–143
- Yurkowski, D.J., Ferguson, S., Choy, E.S., Loseto, L.L., Brown, T.M., Muir, D.C., Semeniuk, C.A. and Fisk, A.T., 2016. Latitudinal variation in ecological opportunity and intraspecific competition indicates differences in niche variability and diet specialization of Arctic marine predators. Ecology and Evolution 6(6), pp.1666-1678
- Yurkowski DJ, SH Ferguson, CAD Semeniuk, TM Brown, DCG Muir, AT Fisk. 2016. Spatial and temporal variation of an ice-adapted predator’s feeding ecology in a changing Arctic marine ecosystem. Oecologia 180: 631–644. DOI 10.1007/s00442-015-3384-5
- Yurkowski, D.J., Semeniuk, C. A. D., Harwood, LA., Asvid-Rosing, A., Dietz, R., Brown, T. M., Clackett, S. Grgicak-Mannion, A. G., Fisk, A., and Ferguson, S. H. 2016. The influence of sea ice phenology on the movement ecology of ringed seals across their latitudinal range. Marine Ecology Progress Series 562: 237-250. doi: 10.3354/meps11950
- Date modified: