
Center of Expertise in Marine Mammalogy: Scientific Research Report 2006-2008
Table of Contents
- Acknowlegements
- Message from the Director of CEMAM
- 1.0 Overview
- 2.0 Population Dynamics
- 2.1 Abundance
- 2.1.1 SPLASH: International Study on Humpback Whales of the North Pacific (John Ford)
- 2.1.2 Abundance of Western Hudson Bay Beluga (Pierre Richard)
- 2.1.3 Abundance of St. Lawrence Estuary Beluga (Jean-François Gosselin)
- 2.1.4 Age Structure, Growth, Mortality, and Density of Beluga in the Canadian Arctic (Steve Ferguson)
- 2.1.5 Continued Reduction in Population Growth of Grey Seals at Sable Island (Don Bowen and Mike Hammill)
- 2.1.6 Timing of Pupping and Abundance of Northwest Atlantic Hooded Seals (Garry Stenson and Mike Hammill)
- 2.1.7 Abundance of Stellar Sea Lions in British Columbia (Peter Olesiuk)
- 2.1.8 Abundance of Eastern Arctic Bowhead Whales (Larry Dueck)
- 2.2 Identifying Population Structure Using Molecular Genetics
- 2.2.1 Distinguishing East Hudson Bay vs. West Hudson Bay Belugas Using Molecular Markers (Lianne Postma)
- 2.2.2 Molecular Genetics for the Identification of Stocks of Narwhal in Nunavut (Lianne Postma)
- 2.2.3 Patterns of Genetic Differentiation in Bowhead Whales from the Eastern Canadian Arctic and Western Greenland (Lianne Postma)
- 2.3 Reproduction and Mortality
- 2.3.1 Condition-Dependent Male Mating Tactics in the Grey Seal: The Importance of Body Size (Don Bowen)
- 2.3.2 An Evaluation of Steller Sea Lion Pup Counts from 35mm Oblique Images (Peter Olesiuk)
- 2.3.3 Life History and Population Dynamics of Northern Resident Killer Whales in British Columbia (Peter Olesiuk, Graeme Ellis and John Ford)
- 2.4 Role of Disease in Marine Mammal Populations
- 2.1 Abundance
- 3.0 How Marine Mammals Fit Into the Ecosystem
- 4.0 Human Impacts on Marine Mammals
- 5.0 Publications 2006-2008
2.0 Population Dynamics
2.1 Abundance
2.1.1 SPLASH: International Study on Humpback Whales of the North Pacific
John Ford

Figure 1. Locations of sightings of over 6,000 humpback whales off the coast of British Columbia, 1982-2007.
Like many of the world's populations of great whales, humpback whales in the North Pacific were severely depleted by whaling in the early to mid 20th century. About 28,000 humpback whales were killed in the eastern North Pacific alone, and by the end of commercial whaling in 1965 an estimated 2,000 or fewer whales remained. In recent years, the humpback has been showing some signs of recovery, but no good estimates of population abundance or trends have been available for the North Pacific. The species is still considered Threatened under Canada's Species at Risk Act.
In the early 2000s, a group of whale researchers from several Pacific Rim countries, including Canada, proposed an ambitious study to determine the status of humpback whales throughout the North Pacific. Called SPLASH (Structure of Populations, Levels of Abundance and Status of Humpbacks), this initiative ultimately became the largest whale study ever attempted. It involved a three-year field effort with over 400 researchers in ten countries: Canada, the US, Russia, Japan, Mexico, Philippines, Guatemala, Nicaragua, El Salvador and Costa Rica. The field study was based primarily on two approaches: photo-identification of individual whales using natural markings on the tail flukes, to determine population abundance and migratory linkages between breeding and feeding areas, and DNA analysis of skin biopsy samples to determine population genetic structure.
The SPLASH study has been a tremendous success. More than 8,000 individual humpbacks were catalogued, and mark-recapture analyses of this dataset yielded an abundance estimate of about 18,000 whales in the North Pacific. Skin samples were obtained from more than 6,000 whales and these have revealed a complex genetic structure among the various regions of the North Pacific.

Humpback flukes and Canadian Coast Guard Service vessel
Photo: John Ford
Scientists from DFO played a major role in SPLASH, from the early planning stages through completion of intensive field research off the B.C. coast (e.g. Fig. 1), to analysis of thousands of identification photos. As with other areas of the North Pacific, the humpback whale population that feeds off Canada's Pacific coast is growing rapidly at an estimated annual rate of about four percent per year due to recruitment and a high survival rate approaching 98 percent per year. The best estimate of abundance for humpback whales in B.C. waters is about 2,000 whales.
Humpback whale photo-IDs collected in British Columbia waters during summer and fall were matched to IDs collected on subtropical breeding grounds, where these whales congregate in winter. This revealed that humpbacks in B.C. migrate primarily to two different destinations: those found off Vancouver Island tend to migrate to waters off Mexico's west coast, while those found off B.C.'s north coast migrate mostly to Hawaii.
SPLASH has shed much new light on the status of humpback whales across the North Pacific as well as in Canadian waters. It has been particularly timely, as DFO is currently developing a Recovery Strategy for humpback whales in Canadian Pacific waters. Humpback whales appear to be recovering well, though they are not yet out of danger. Current threats to survival and recovery of this humpback whale population include vessel strikes, entanglement in fishing gear, increasing underwater noise, and prey limitation. However, none of these threats appears to be currently affecting the population's strong growth rate.
2.1.2 Abundance of Western Hudson Bay Beluga
Pierre Richard

Beluga whale pod
Photo: Véronique Lesage
The Western Hudson Bay beluga population summers in the coastal waters of Manitoba; the largest aggregations occur in the estuaries of the Seal, Churchill, and Nelson rivers. Two surface population estimates of 23,000 and 25,100 were obtained based on visual and aerial photographic surveys in 1987.
Aerial surveys were flown in western and southern Hudson Bay in 2004. A combination of aerial visual line-transect surveys and photographic surveys were used to estimate the numbers of beluga, with a correction for availability bias (animals missed by observers because they were diving out of sight). The new estimate was 57,300 (95 percent C.L.: 37,700-87,100). Past survey estimates, once adjusted for availability bias, yield similar numbers, suggesting that the population has not experienced a detectable change in numbers since 1987.
2.1.3 Abundance of St. Lawrence Estuary Beluga
Jean-François Gosselin

Beluga whale survey photograph
Photo: Jack Orr
Surveys to evaluate St. Lawrence beluga abundance have used a variety of methods, including boats, helicopters, airplanes, visual, and photographic surveys. The 1995 St. Lawrence beluga recovery plan recommended that a standard method be adopted to estimate abundance and improve the monitoring of the population. Since 1988, seven surveys of belugas in the St. Lawrence estuary have followed a systematic aerial photographic survey method. The latest of these surveys was conducted in 2003 and correcting for animals that were diving while the planes passed overhead provided an abundance index of 1,300 (rounded to nearest 100). Using the photographic estimates since 1988, a population model suggests that, in spite of 30 years of protection from hunting, the St. Lawrence estuary beluga shows no sign of recovery with a current population of approximately 1,100 (rounded to nearest 100).
Considerable variability has been observed between abundance indices since 1988, which is thought to result from challenges in trying to survey a small population with a clumped distribution. In 2005, 19 visual line transect surveys conducted to evaluate the effect of altitude on abundance estimates using this method, along with five visual line transect surveys conducted in 2003 were used to capture some of the variability associated with the clumping distribution of belugas in the St. Lawrence and to compare estimates from the two survey methods. The abundance index of the 2003 photographic survey was lower, representing 68% of the combined estimate of the five visual line transect surveys of that same year, but was not different than the combined estimates of the 2005 visual surveys. Although abundance indices from the two methods were not different, additional comparisons should be completed to ensure calibration of these two techniques.
2.1.4 Age Structure, Growth, Mortality, and Density of Beluga in the Canadian Arctic
Steve Ferguson

Beluga whale and calf
Photo: W. Klenner
Polar and sub-polar marine ecosystems display the world's largest seasonal variations and extremes in physical characteristics of the environment. Where the environment is such a strong force, life history strategies are often viewed as adaptations to different degrees of seasonality and/or predictability of resources, typically food. Environmental constraints are expected to increase with seasonality in resources such as food and appropriate breeding habitat.
Comparisons of age structure and growth among beluga populations have been limited in geographical scope to test predictions about the influence of environmental factors and density. A comprehensive comparison is needed, considering that two Canadian stocks are classified as endangered, two as threatened, and two as special concern under SARA.
In this study, age structure, body length distribution, mortality, and population density were compared between four beluga populations of the Canadian Arctic: Baffin Bay, Cumberland Sound, Western Hudson Bay, and Eastern Hudson Bay. Growth, but not mortality, showed a significant positive relationship with latitude. Age distributions differed in shape between populations, with animals at the highest latitude (Eastern Beaufort Sea) being the oldest and attaining the longest adult body lengths. Although differences in hunting selectivity and pressure may have played a role in the observed responses, the variation in adult body size suggests that environmental seasonality may impose stronger constraints on life history traits of beluga with increasing latitude.
2.1.5 Continued Reduction in Population Growth of Grey Seals
Don Bowen and Mike Hammill

North beach of the Sable Island grey seal colony
Photo: Don Bowen
One of the longest series of estimates of seal pup production comes from a study which began in 1962 at Sable Island, Nova Scotia. The number of grey seal pups born at Sable Island has increased exponentially over the past four decades. Within its Canadian range, the grey seal forages widely throughout the Scotian Shelf and the Gulf of St. Lawrence during the non-breeding season. Major grey seal breeding colonies are located on the sea ice in the southern Gulf of St. Lawrence and on Sable Island.
A digital-photographic aerial survey was conducted on Sable Island in January 2007 to estimate grey seal pup production. A total of 48,036 pups were counted on the digital imagery. Corrections were made for the proportion of pups that died prior to the survey and for those born after the survey was completed; the new estimate was 54,500. For the non-Sable Island component of the population, visual strip transect surveys were flown over the whelping patches on the ice in the Gulf of St. Lawrence, and counts were completed at islands in the Gulf and along the Nova Scotia Eastern Shore. Aerial searches were also conducted along the south and southwest coast of Newfoundland and Anticosti Island. Counts were corrected for the proportion of pupping that took place after the survey was completed.
Where possible, counts were corrected for the proportion of pupping completed when the survey was completed. Changes in age-specific pelage-stage durations resulted in a 17 percent change in pup production estimates. Total non Sable Island pup production, rounded to the nearest thousand, is estimated to be 13,000 animals. The proportion of pups born on Sable Island has increased from less than five percent in the mid-1980s to about 70 percent in 2007.
The 2007 estimate indicates that pup production on Sable Island has continued to increase, but the rate of increase has declined over the past two surveys. The proportion of females giving birth at ages four to seven years, from the 1998-2002 cohorts, were significantly lower than those in the mid- to late- 1980s. The new estimate of pup production and new data on age of primiparity provide further indication of changes in vital rates of this population. Pup production of the non-Sable Island component has not shown the same increase as on Sable Island. This may be due to higher and more variable pup mortality rates for animals born on the ice in the Gulf of St. Lawrence.
The survey data were incorporated into a population model along with data on reproductive rates as well as information on reported catches. The total estimated population size at the end of the 2007 breeding season (i.e., including pups) was 304,000.
2.1.6 Timing of Pupping and Abundance of Northwest Atlantic Hooded Seals
Garry Stenson and Mike Hammill

Male hooded seal
Photo: Mike Hammill
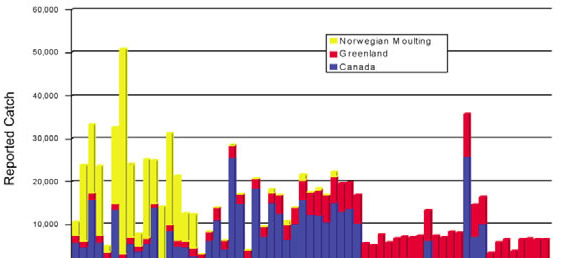
Figure 2. Reported catches of Northwest Atlantic hooded seals, 1946-2006.
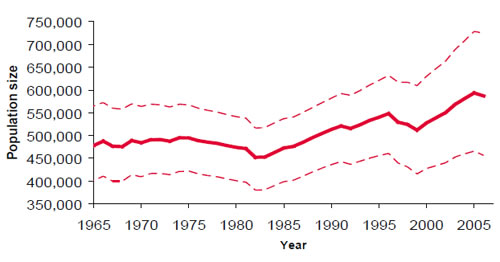
Figure 3. Estimated abundance of Northwest Atlantic hooded seals, 1865-2006.
Whelping of hooded seals occurs on pack ice around Jan Mayen Island, in the Davis Strait, off the northeast coast of Newfoundland (called the Front), and in the Gulf of St. Lawrence. The relationships between the different breeding groups are poorly understood; some analyses using DNA techniques support the hypothesis of a single population.
Surveys have been flown during the breeding season to look at the timing of births during the spring. At the Front, the mean date by which pupping had finished was 28 March, with a range of 18 March to 4 April. In the Gulf, pupping in most years had finished by the start of April, with the exception of 1994, when the model predicted that pupping continued until May. Excluding this data, births would have finished by 28 March, with a range of 25 March to 31 March.
Nursing hooded seals are first observed early in March. This indicates that hooded seal births are spread over a longer time period than seen among harp seals that pup in the same area. Taking into consideration the possibility of late births, particularly in heavy ice years, nursing should be complete by 8-10 April.
Using sequential population analyses or survival indices, researchers estimated hooded seal pup production at the Front to be approximately 30,000 in the early 1980s. However, independent aerial survey estimates of pup production in mid 1980s indicated that pup production was approximately 62,000 during the 1980s and 83,000 in 1990. Unfortunately, there is less known about the historical abundance of animals in Davis Strait and in the Gulf. A survey flown in 1984 estimated pup production in Davis Strait to be approximately 18,600. Relatively few pups are born in the Gulf of St Lawrence, with estimates from aerial surveys being 2,000 and 4,000 animals in 1990 and 1994, respectively.
The most recent estimates of pup production were obtained from surveys of the Front in 2004 and from all three whelping areas in 2005. In 2004, pup production at the Front was estimated to be 123,862. In 2005, pup production at the Front was estimated to be 107,013, while 6,620 pups were estimated to have been born in the Gulf. Pup production in the Davis Strait whelping concentration was estimated to be 3,346. Combining these areas resulted in an estimated pup production in the three northwest Atlantic whelping areas of 116,900. Comparison with previous estimates suggests that pup production may have increased since the mid 1980s.
A population model incorporating hooded seal pup production estimates since the 1980s, reproductive rates and human induced mortality (reported catches and struck and lost) were used to estimate total abundance for the period 1965 – 2005 (Fig. 2).
Fitting to pup production estimates from all herds and making assumptions about numbers of hooded seals in the Davis Strait herd for years when this area was not included in the survey program, resulted in an estimated total population of 593,500 in 2006 (Fig. 3). However, there is considerable uncertainty associated with these estimates owing to our lack of understanding of the relationship between the Davis Strait, Front and Gulf pupping areas, few surveys of all three areas, limited reproductive data and uncertain harvest statistics.
2.1.7 Abundance of Stellar Sea Lions in British Columbia
Peter Olesiuk

Sea lions are the only Otariid (the family containing fur seals and sea lions) that reside year-round and breed on the B.C. coast
Photo: UBC-DFO Research Cruise
Steller sea lions breed along the North Pacific Rim. Two distinct populations are recognized: a western population that breeds in Russia, the Aleutian Islands and Gulf of Alaska, and an eastern population that breeds in Southeast Alaska, British Columbia, Oregon and north-central California. DFO has conducted aerial surveys every two to five years since the early 1970s to monitor populations in B.C. Since 1994, the DFO surveys have been coordinated with agencies in Alaska, Washington, Oregon, California and Russia to obtain range-wide abundance estimates.
Surveys are flown in late June – early July to coincide with the end of the pupping season. Most pups have been born by this time, but they are still too young to have left the rookeries, so the surveys provide an estimate of total annual pup production. Haul-out sites used by non-breeding animals are also surveyed. Although some non-pups are at sea and missed during surveys, the surveys provide information on the relative distribution of animals and importance of haul-out sites.
The B.C. surveys indicate an increasing trend in both pup production and non-pup counts since the early 1970s, with most of the increases taking place since the 1980s. Abundance of Steller sea lions has also increased in SE Alaska, Washington and Oregon. Because the largest rookeries are situated near the B.C. – SE Alaska border, its difficult to separate populations in these two regions, but both show increasing trends. Indeed, the combined abundance of Steller sea lions in B.C. and SE Alaska has increased about four-fold since the species was protected in the early 1970s.
Although province-wide surveys in B.C. were not initiated until the early 1970s, there are counts for breeding rookeries dating back to the early 1900s. Recent surveys indicate that a fairly constant proportion of the total population occurs on rookeries, so the historic rookery counts probably provide a fairly good index of overall population trends. The historic counts indicate that abundance of sea lions in B.C. in the early 1970s had been reduced to about 25-33 percent of the number present when the first surveys were conducted in 1913. The declines can be attributed to predator control programs and experimental harvests. Approximately 55,000 Steller sea lions were killed in B.C. during 1912-1968. These kills eradicated a rookery on the Sea Otter Group off the central B.C. coast, and reduced numbers on the remaining three rookeries.
The recent increases in B.C. and neighbouring waters represent the recovery of populations that had been depleted prior to being protected in the early 1970s. The species has resumed breeding on the Sea Otter Group, and by 2006 sufficient numbers of pups were born to re-classify it as a rookery. In recent years, Steller sea lion populations in B.C. and SE Alaska appear to exceeded peak historic levels, and the reason for continued increase is unknown. In 2002, the total eastern Steller sea lion population was estimated to number 46,000-58,000, 34 percent of which breed on the B.C. coast.
2.1.8 Abundance of Eastern Arctic Bowhead Whales
Larry Dueck

Bowhead whale at the surface
Photo: Larry Dueck
The abundance of bowhead whales is notoriously difficult to assess. Not only do they have a widespread distribution, they occur in relatively low densities, tend to spend a majority of their time out of sight beneath the surface of the water, and are often difficult to detect due to their dark colouration. Surveys need to be conducted in as short a timeframe as possible and can be further complicated by weather and visibility conditions, such that significant portions of the survey area are ultimately missed.
Previous surveys of bowhead whales in the eastern Arctic covered only small fractions of their known range due to the costly nature of aerial surveys and tended to differ significantly, likely due to factors of differing coverage and survey conditions. Earlier surveys also underestimated the numbers of whales, since they typically did not correct for submerged animals. Information on bowhead behaviour, specifically time spent below the surface, was not yet known at the time.
A major effort to survey was possible in 2002-2004, with the help of funding from the Species at Risk program. To obtain the best possible information, aerial surveys were conducted from Twin Otter aircraft with two observers on each side of the aircraft. This “double-observer” approach allows a more complete estimate of the number of animals as it allows researchers to document which whales were seen by the front observer and missed by the rear observer, and vice versa. Knowing the rate at which observers miss animals provides the ability to estimate the overall proportion of animals missed (because they were below the surface) is also essential to the calculation of the abundance of whales.
The analysis of this data, including correction for missed animals and animals below the surface, indicates that the abundance of bowhead whales for the eastern Arctic lies somewhere between 4,800 and 43,000 whales, with a mean estimate of 14,400 whales. Although we cannot know precisely where within this range the actual number lies, the estimate indicates that the numbers are larger than previously thought and provides quantitative support for the claims of Inuit in many communities that numbers have increased in recent decades.
Footnote: A recent review by an IWC Scientific Sub-committee suggested that the above estimate may be biased upwards. A review is underway to address those concerns.
2.2 Identifying Population Structure Using Molecular Genetics
2.2.1 Distinguishing East Hudson Bay vs. West Hudson Bay Belugas Using Molecular Markers
Lianne Postma
The definition of beluga stocks in Hudson Bay and elsewhere in Canadian waters has relied heavily on genetic information. This information has been used to discriminate among summer aggregations of beluga that share maternal lineages. Early analyses of this data supported the identification of at least two stocks of beluga in Hudson Bay, generally referred to as the East Hudson Bay and West Hudson Bay stocks. These stocks are thought to interbreed on wintering grounds in eastern Hudson Strait/Baffin Bay.

Examining DNA profiles in the lab
Photo: Denise Tenkula, Melissa Lindsay and Robert Bajno
The definition of beluga stocks in Hudson Bay and elsewhere in Canadian waters has relied heavily on genetic information. This information has been used to discriminate among summer aggregations of beluga that share maternal lineages. Early analyses of this data supported the identification of at least two stocks of beluga in Hudson Bay, generally referred to as the East Hudson Bay and West Hudson Bay stocks. These stocks are thought to interbreed on wintering grounds in eastern Hudson Strait/Baffin Bay.
The samples were collected from local harvests and are a mixture of migrating animals and summering animals. The first step is to identify the number of stocks in the population by isolating the summer samples. The next step is to look at the samples from migrating animals and perform a mixed stock analysis to quantify the proportions of animals from the summer stocks that make up the harvest.
Preliminary results from these analyses indicate that there are more than two stocks of beluga in Hudson Bay. There is also strong evidence that samples taken from James Bay represent a separate population of beluga that are not interbreeding with beluga harvested at other locations in Hudson Bay and Hudson Strait.
2.2.2 Molecular Genetics for the Identification of Stocks of Narwhal in Nunavut
Lianne Postma

Small group of narwhal in open water
Photo: Larry Dueck
Results of narwhal genetics analyses for samples collected in the eastern Canadian Arctic between 1982 and 2001 revealed that there was weak differentiation of narwhal stocks in the High Arctic. It was also concluded that the choice of markers should have been sufficient to reveal stock differences.
Recent work with beluga and walrus has focussed on increasing the amount of genetic information used to examine stock differences and migration patterns. This has been increasing the power of statistical analyses and has been very informative for these species.
Over the last few years, analytical approaches have changed drastically. Recently developed, more powerful methods are able to more rigorously identify population structure, quantify gene flow, provide information on the importance of current migration relative to historical associations among populations, as well as demographic information on population history, growth and variability. These types of information are critical for the development of management plans and recovery plans for endangered stocks.
These methods come with limitations, including a large amount of computational power and the need for large data sets. In this project the number of relevant samples analyzed was expanded to 20 micro-satellite markers to increase the amount of genetic information available. The focus is on analyzing 50 samples from each of the four locations – Repulse Bay, Pond Inlet, Grise Fiord and Kikitarjuaq. Results are pending for this study.
2.2.3 Patterns of Genetic Differentiation in Bowhead Whales from the Eastern Canadian Arctic and Western Greenland
Lianne Postma

DFO researchers tagging bowhead whale from a boat
Photo: DFO
Biopsy samples from bowhead whales were collected from animals in Nunavut, Canada and western Greenland and were analyzed for 34 nuclear DNA micro-satellite loci. Individual sample sizes were eight for Pelly Bay, 143 for Igloolik, 16 for Repulse Bay, 82 for Pangnirtung and 80 for Disko Bay.
Results may indicate stock structure but it could also be the result of a number of factors such as inbreeding, non-random mating, natural selection, bottleneck effects from severe population decline due to commercial whaling, or data-scoring errors. An Analysis of Molecular Variance (AMOVA) revealed significant differences in allele frequencies among samples from different years at each location. These results are most likely influenced by sample sizes and the variation in the sample sexes and ages in the collection from year to year.
The molecular genetic evidence from micro-satellite analyses of bowhead samples from Baffin Bay-Davis Strait and Hudson Bay-Foxe Basin areas does not provide strong support for two distinct populations. This conclusion is supported by the results of satellite tracking studies showing extensive movements of bowheads between these two areas. However, the genetic differences that were detected and limited information on sex and age class segregation among the sampling locations indicate that there is some structuring of bowheads throughout their range that may have management implications for this population.
2.3 Reproduction and Mortality
2.3.1 Condition-Dependent Male Mating Tactics in the Grey Seal: The Importance of Body Size
Don Bowen

Male grey seal fight stalemate
Photo: Don Bowen
Grey seals are size dimorphic, with males being 1.5 times larger than females. In dimorphic species, larger males are often thought to have an advantage in obtaining mates. This study examined the importance of body size and body composition as determinants of mating tactics exhibited in males. Behavioral observations, along with measures of energy expenditure and reproductive success, were obtained from 42 known-age individuals during the breeding seasons of 1997–2001 at Sable Island, Canada.
Males with a large body mass arrived at the breeding grounds with more body fat and body energy and spent less body protein than smaller males. Males with a smaller percentage of body fat had higher rates of food intake. The amount of body energy on arrival was positively correlated with the duration of the breeding period. Males that exhibited the primary mating tactic of defending females were heavier, had absolutely more body fat and body energy, and sustained breeding longer than those males that did not exhibit the primary tactic. Amongst all males, intermediate-sized males mated with the most females and achieved the highest success. Intermediate body size may be optimal during breeding due to greater agility in male combat.
2.3.2 An Evaluation of Steller Sea Lion Pup Counts from 35mm Oblique Images
Peter Olesiuk

Steller sea rookeries are photographed while circling at steep angles and the small, dark pups counted from high-resolution 35mm images
Photo: Peter Olesiuk
For many pinnipeds, including Steller sea lions, counts of pups provide the best method for tracking population trends and estimating abundance. Other age-classes tend to be widely distributed, and an unknown proportion is at sea and missed during surveys. In contrast, pups are born at traditional rookeries, and confined to land for the first month of life. Censuses of breeding sites can thus provide estimates of total pup production, and population models used to extrapolate total population size.
Steller sea lion pups are difficult to count from boats or aircraft. They are dark and small, tend to blend in with the substrate, and can be hidden behind rocks, other animals or in crevices. Traditionally, pup counts have been made by landing people on rookeries at the peak of the breeding season, driving non-pups into the water, and walking through the rookery and tallying the number of pups present. These drive-counts are highly disruptive, displacing bulls from their breeding territories, and separating young pups from their mothers or chasing them into the ocean. In one study that monitored changes in the rookery before and after drive-counts, a third fewer females maintained contact with pups following the disturbance.
In British Columbia, aerial surveys have been used to monitor Steller sea lion trends since the 1970s. Pups have been counted from oblique 35mm photographs taken as aircraft circled the rookery. While aerial surveys avoid the disturbance associated with ground drive-counts, there has been some concern over the accuracy of counts made from the air. In the 1990s, DFO researchers teamed-up with scientists from Alaska Department of Fish and Game (ADF&G), National Marine Mammal Laboratory and Southwest Fisheries Science Center to compare and calibrate counting techniques for Steller sea lion pups. During 1994-1998, DFO flew surveys at Forrester Island in SE Alaska – where more pups are born than anywhere else – a day or two before ADF&G conducted drive-counts on the ground. The comparison indicated that while the aerial and ground counts were highly correlated, about 20 percent of the pups were consistently missed in the oblique 35mm photographs.
In subsequent study, it was found that vertical medium-format images taken from belly-mounted cameras provided counts that were statistically indistinguishable from ground drive-counts. In 1998 and 2002, rookeries in B.C. were surveyed using both vertical medium-format and oblique 35mm photography. Counts using each method were highly correlated, but a small number (four percent) of the pups were missed in the oblique photographs. Its believed that a smaller proportion of pups were hidden and missed in the oblique photographs on the B.C. rookeries than on Forrester Island because the B.C. breeding sites tend to be smaller or spread along beaches, such that they can be flown and photographed at more acute angles. Based on these studies, a small correction (1.05) is now applied to the oblique 35mm pup counts in B.C. to adjust for hidden animals. All agencies in North America have now adopted aerial photography to census Steller sea lion pups, greatly reducing the level of disturbance caused by researchers.
2.3.3 Life History and Population Dynamics of Northern Resident Killer Whales in British Columbia
Peter Olesiuk, Graeme Ellis and John Ford

Resident killer whales remain in natal groups for life and travel as a cohesive unit
Photo: John Ford
Killer whale population studies and photo-identification techniques were pioneered in the early 1970s by the late Dr. Michael A. Bigg. Despite the early skeptics, Mike quickly learned that each whale could be recognized from unique natural markings, and recognized that photo-identification was a powerful tool for long-term population studies. Before his premature death in 1990, he left us with two seminal papers that would chart the course for the next generation of whale researchers. The first paper on social organization and genealogy showed that resident killer whales of both sexes remain in their natal groups for life, and described the genealogical relationships among individuals within each of the matrilineal groups of resident whales on the B.C. coast.
This paved the way for a second paper on life history and population biology of resident killer whales. Using sophisticated numerical techniques, much like an actuary would use to calculate insurance risks; age-specific life history parameters were derived from the long-term sighting records, and incorporated into life tables and matrix projection models. The models indicated that killer whales were much longer-lived and slower-reproducing than previously believed. Females typically mature at 14 years of age, produce an average of five calves over a 25 year reproductive lifespan, but may live to about 80 years of age. Males reach sexual maturity at 13 years of age, but aren't physically mature until 18 years of age, and may live as long as 60-70 years.
The photo-identification surveys have been continued annually, and the records of births and deaths in the resident killer whale populations now extends over three decades. This long-term study has provided a rare opportunity to assess how the killer whales have faired through both favorable periods of population growth and less favorable periods of population decline. Interestingly, it's been found that population status is driven mainly by changes in survival rates, with reproductive rates remaining fairly stable. The stability of reproductive parameters may be due to the very limited reproductive potential of females, who only produce an average of five calves over their lifespan. Even more interesting, animals of both sexes and all ages exhibited elevated mortality rates during less favorable periods when populations declined. In most other species the young and inexperienced animals, or the old and feeble animals, are most vulnerable during less favorable periods. The pattern in killer whales may be explained by the fact that, unlike other species, animals of both sexes and all ages travel as a cohesive unit in their natal pods, and experience the same conditions and suffer the same prey shortages.
2.4 Role of Disease in Marine Mammal Populations
2.4.1 Diseases of Importance to Wild Marine Mammal Populations
Lena Measures

Ferret PDV histology slide
Photo: Lena Measures
The most significant pathogens causing massive mortalities in marine mammal populations worldwide are morbilliviruses such as phocine distemper virus (PDV) infecting pinnipeds, and cetacean morbillivirus (CMV) infecting cetaceans. PDV is responsible for mortalities estimated at 20,000 harbour seals and several hundred grey seals in Europe in 1987-1988 and in 2002. CMV has killed dolphins in Europe and in the eastern USA but mortalities appear to be more limited in number. PDV is prevalent in Canadian pinnipeds including harp and grey seals, which are believed to be reservoirs for the virus. The absence of large scale mortalities in Canadian pinniped populations from PDV is believed to be due to natural herd immunity.
A few mortalities due to PDV have been reported in harbour seals in the New England area, the most recent being in 2006-2007. Only one harp seal in Canadian waters has been reported dead of PDV. Antibodies against PDV have been detected in Canadian pinnipeds as early as 1972 but the virus has not been isolated from Canadian pinnipeds despite recent efforts, nor have studies on its pathogenicity and pathogenesis in harp or grey seals been conducted. Recent studies by Ole Nielsen and Lena Measures of DFO, and collaborators at the National Center for Foreign Animal Disease, Canadian Food Inspection Agency, and the University of Montréal, examined a new method to isolate and characterize an isolate of PDV from the 1988 seal epizootic in Europe using experimentally infected ferrets. A stable transfected Vero cell line (Vero.DogSLAMtag) expressing canine “signalling lymphocyte activation molecules” (SLAM) or CD150 receptors offered faster viral replication resulting in primary viral isolation in a shorter period of time, with higher yield of virus compared to traditional cell culture methodologies (Vero and primary seal kidney cells).
A reverse transcriptase polymerase chain reaction (RT-PCR) test was developed to detect a portion of the nucleocapsid gene found only in PDV. This RT-PCR methodology was used to confirm the identity of the virus that was subsequently isolated from the ferrets. Viral isolates from the infected ferrets as well as cultures of virus originally isolated from a dolphin and a porpoise and maintained in Vero cells also replicated faster and produced higher titres of virus when propagated in Vero.DogSLAMtag cells.
2.4.2 Zoonotic Diseases of Marine Mammals
Lena Measures

GiardiaTrophozoites
Photo: L. Measures and A. Applebee
Giardia and Cryptosporidium are protozoan parasites known to cause enteric disease in terrestrial wildlife species and are also zoonotic - able to infect humans. Recent studies have reported cysts of Giardia in the faeces of Canadian pinnipeds from the western Arctic and the east coast of Canada. The objective of this new study conducted at the Maurice Lamontagne Institute with Lena Measures by Amber Applebee as part of her doctoral research at Murdoch University, Perth, Australia was to determine the prevalence and genotype of Giardia and Cryptosporidium in two species of pinnipeds, harp seal (Phoca groenlandica) and hooded seal (Cystophora cristata), from the Gulf of St. Lawrence.
Faecal samples were collected from pup and adult seals and examined for the presence of cysts of Giardia and oocysts of Cryptosporidium using microscopy and immunofluorescent staining. Tissues from the small intestine of adult seals were also collected and examined for infections using the polymerase chain reaction (PCR) technique. Giardia cysts were found in faeces of 42 percent (16/38) of adult harp seals, but in none of the harp seal pups (0/20). Although Giardia cysts were not detected in faeces of adult hooded seals (0/10) using microscopy, 80 percent of their intestinal tissues were infected with Giardia using the PCR technique.
Both harp and hooded seals harbored infections with the zoonotic strain, Giardia duodenalis Assemblage A, as determined using a two-step nested PCR technique to amplify a small subunit ribosomal (SSU-rRNA) gene of Giardia. Cryptosporidium was not detected using microscopy nor the PCR technique on intestinal tissues from any of the 68 seals examined. Trophozoites of Giardia were observed on histological sections of intestinal tissues from harp and hooded seals confirming that Giardia was excysting and developing in seals.
2.4.3 Marine Mammal Strandings and Mortality Events – Monitoring and Investigations
Lena Measures

Live stranded pilot whale
Photo: Lena Measures

Beluga whale necropsy
Photo: Lena Measures
A monitoring and necropsy program on the threatened St. Lawrence Estuary (SLE) beluga population has been conducted since 1982. An average of 15 mortalities are reported annually with 3 to 12 carcasses transported to the University of Montreal, Faculty of Veterinary Medicine for a complete necropsy to determine cause of death and collect tissues for a variety of research projects investigating the health, diet, and chemical contaminants in stranded animals from this population. In 2006 and 2007, 11 and 17 mortalities were documented with three and ten necropsies performed, respectively.
Recent work with Michel Lebeuf at DFO has shown that some contaminants in tissues of SLE beluga are declining while new ones are being detected. For the period 1983 to 2007, 365 mortalities have been documented. Of 148 carcasses (all sexes and ages combined) sufficiently fresh for necropsies from 1983 to 2002, infectious etiology (bacterial and parasitic infections) caused 38 percent of deaths, terminal neoplasia or cancer 15 percent with almost 30 percent dead of unknown causes. In stratifying the age groups, 58 percent of calves (<1 yr) died perinatally, 81 percent of juveniles (one to ten or 14 yr based on sex) died of infectious etiology (56 percent due to verminous pneumonia) and 32 percent of adults (>10 or 14 yr based on sex) died of infectious etiology. Terminal neoplasia was only seen in 22 adults (18 percent) with a mean age of 33 yr (range 22 – 59) (GLG/1 yr).
An overview of the SLE beluga population entitled “What's killing the white whales of the St. Lawrence” is available as part of the DFO Science Feature Articles at www.dfo-mpo.gc.ca/science/Story/feature_e.htm. Despite the implementation of various protective management measures, an apparent absence of predators such as killer whales, and enforcement of environmental regulations on toxic chemicals, the population has failed to rebuild. This article discusses the importance of disease in this population, particularly chronic diseases such as cancer affecting animals that can live to be over 80 years old.
- Date modified: