
Fisheries and Oceans Canada - Quarterly financial report for the quarter ended June 30, 2026
Table of contents
- Introduction
- Highlights of the fiscal quarter results
- Risks and uncertainties
- Significant changes in relation to operations, personnel and programs
- Approval by senior officials
- Appendix
1. Introduction
This quarterly financial report has been prepared as required by section 65.1 of the Financial Administration Act. The quarterly report should be read in conjunction with the current year’s Main Estimates.
This quarterly report has not been subject to an external audit or review.
Further details on Fisheries and Oceans Canada’s authority, mandate and programs may be found in the Departmental Plan.
1.1 Basis of presentation
This quarterly report has been prepared using an expenditure basis of accounting. The accompanying Statement of Authorities includes Fisheries and Oceans Canada’s spending authorities granted by Parliament and those used by the Department consistent with the 2026-27 Main Estimates.
The authority of Parliament is required before money can be spent by the Government. Approval is given in the form of annually approved limits through appropriation acts or through legislation in the form of statutory spending authority for specific purposes.
The Department uses the full accrual method of accounting to prepare and present its annual departmental financial statements that are part of the departmental results reporting process. However, the spending authorities voted by Parliament remain on an expenditure basis.
2. Highlights of the fiscal quarter results
The following section highlights the financial results and provides explanations for the fiscal quarter ended June 30, 2026, compared to the same period last year.
| 2025-26 Authorities as at June 30, 2025 | 2026-27 Authorities as at June 30, 2026 | Variance in Authorities | 2025-26 Expenditures as at June 30, 2025 | 2026-27 Expenditures as at June 30, 2026 | Variance in Expenditures | |
|---|---|---|---|---|---|---|
| Vote 1 – Operating expenditures | 2,266,709 | 1,129,593 | (1,137,116) | 455,922 | 256,274 | (199,648) |
| Vote 5 – Capital expenditures | 2,650,017 | 312,652 | (2,337,365) | 693,961 | 31,810 | (662,151) |
| Vote 10 – Grants and Contributions | 913,847 | 328,497 | (585,350) | 52,406 | 29,451 | (22,955) |
| Statutory | 221,974 | 117,191 | (104,783) | 56,114 | 20,713 | (35,401) |
| Total | 6,052,547 | 1,887,933 | (4,164,614) | 1,258,403 | 338,248 | (920,155) |
2.1 Significant changes in authorities
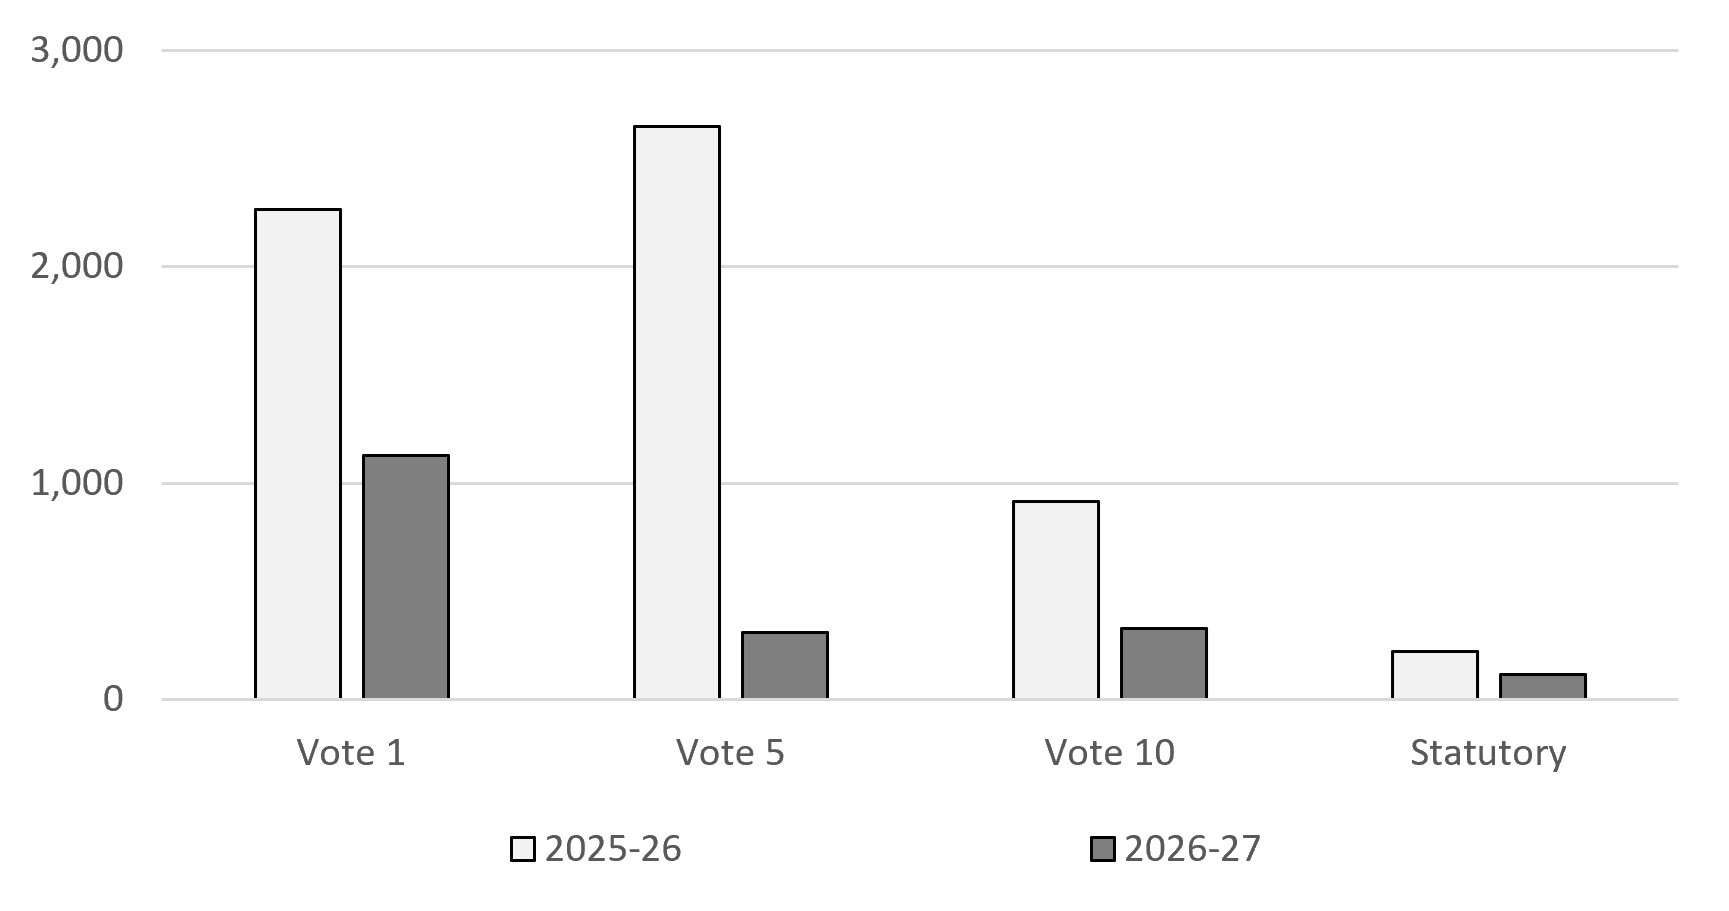
In the first quarter of 2026-27, total budgetary authorities available for use decreased by $4,164.6 million (68.8%) compared to the same period in the previous year:
- Vote 1 authorities decreased by $1,137.1 million
- Vote 5 authorities decreased by $2,337.4 million
- Vote 10 authorities decreased by $585.3 million
- Statutory authorities decreased by $104.8 million
Comparison of net budgetary authorities, by Vote, as at June 30 of fiscal years 2025-26 and 2026-27 (in millions of dollars)
Text version
| Dates | 2025-26 | 2026-27 |
|---|---|---|
| Vote 1 | 2,267 | 1,130 |
| Vote 5 | 2,650 | 313 |
| Vote 10 | 914 | 328 |
| Statutory | 222 | 117 |
Note: Funding presented reflects approved reference levels at the time of Main Estimates.
The following table provides a detailed explanation of these changes.*
| Explanation of Changes (2026-27 compared to 2025-26) |
Change (thousands of dollars) |
|---|---|
| Vote 1 – Operating | |
| Funding for signed collective bargaining agreements | 8,171 |
| Funding for Indigenous programs | 5,741 |
| Planned funding profile change to repair and maintain small craft harbours | (4,528) |
| Planned funding profile change to modernize the Fisheries Act | (4,965) |
| Planned funding profile change related to the Comprehensive Expenditure Review exercise | (6,315) |
| Planned funding profile change for species at risk | (10,961) |
| Planned funding profile change to conserve Canada’s lands and freshwater, protect species, advance Indigenous reconciliation and increase access to nature | (11,472) |
| Planned funding profile change related to the Refocusing Government Spending exercise | (13,210) |
| Planned funding profile change for extending the lease of the emergency towing vessels on the West Coast and completing the National Strategy on Emergency Towing | (13,794) |
| Planned funding profile change to protect and promote the health of Canada’s priority at-risk whale populations | (18,423) |
| Planned funding profile change for the Pacific Salmon Strategy Initiative | (74,957) |
| Planned funding profile change for Marine Conservation Targets | (97,440) |
| Transfer of authorities to the Department of National Defence as part of the Canadian Coast Guard transition | (889,393) |
| Other Departmental Adjustments | (5,570) |
| Sub-total Operating | (1,137,116) |
| Vote 5 – Capital | |
| Funding to repair and maintain small craft harbours | 42,994 |
| Funding to design, construct, and maintain a small craft harbour in Arctic Bay in the Qikiqtani Region, Nunavut | 21,264 |
| Planned funding profile change related to the Refocusing Government Spending exercise | (7,821) |
| Planned funding profile change for the Oceans Protection Plan | (10,775) |
| Planned funding profile change for the Pacific Salmon Strategy Initiative | (37,219) |
| Transfer of authorities to the Department of National Defence as part of the Canadian Coast Guard transition | (2,342,173) |
| Other Departmental Adjustments | (3,635) |
| Sub-total Capital | (2,337,365) |
| Vote 10 – Grants and Contributions | |
| Planned funding profile change to conserve Canada’s lands and freshwater, protect species, advance Indigenous reconciliation and increase access to nature | (10,449) |
| Planned funding profile change for the Oceans Protection Plan | (10,952) |
| Planned funding profile change related to the Comprehensive Expenditure Review exercise | (12,392) |
| Planned funding profile change for species at risk | (13,747) |
| Planned funding profile change for Marine Conservation Targets | (35,243) |
| Planned funding profile change for the Fish Funds | (46,213) |
| Planned funding profile change for the Pacific Salmon Strategy Initiative | (62,507) |
| Planned funding profile change for Indigenous programs | (73,786) |
| Planned funding profile change for the Qikiqtani Inuit Association | (288,554) |
| Transfer of authorities to the Department of National Defence as part of the Canadian Coast Guard transition | (29,673) |
| Other Departmental Adjustments | (1,834) |
| Sub-total Grants and Contributions | (585,350) |
| Statutory | |
| EBP Adjustment | 26,592 |
| Planned funding profile change related to the Refocusing Government Spending exercise | (2,725) |
| Planned funding profile change for species at risk | (2,832) |
| Planned funding profile change for Marine Conservation Targets | (8,441) |
| Planned funding profile change for the Pacific Salmon Strategy Initiative | (11,048) |
| Transfer of authorities to the Department of National Defence as part of the Canadian Coast Guard transition | (102,704) |
| Other Departmental Adjustments | (3,625) |
| Sub-total Statutory | (104,783) |
| Total Authorities | (4,164,614) |
* Some explanation of changes refer to Coast Guard initiatives or projects. These are included as DFO is required to report on these items up until the coming into force of the Order in Council on September 2, 2025.
2.2 Significant changes in expenditures
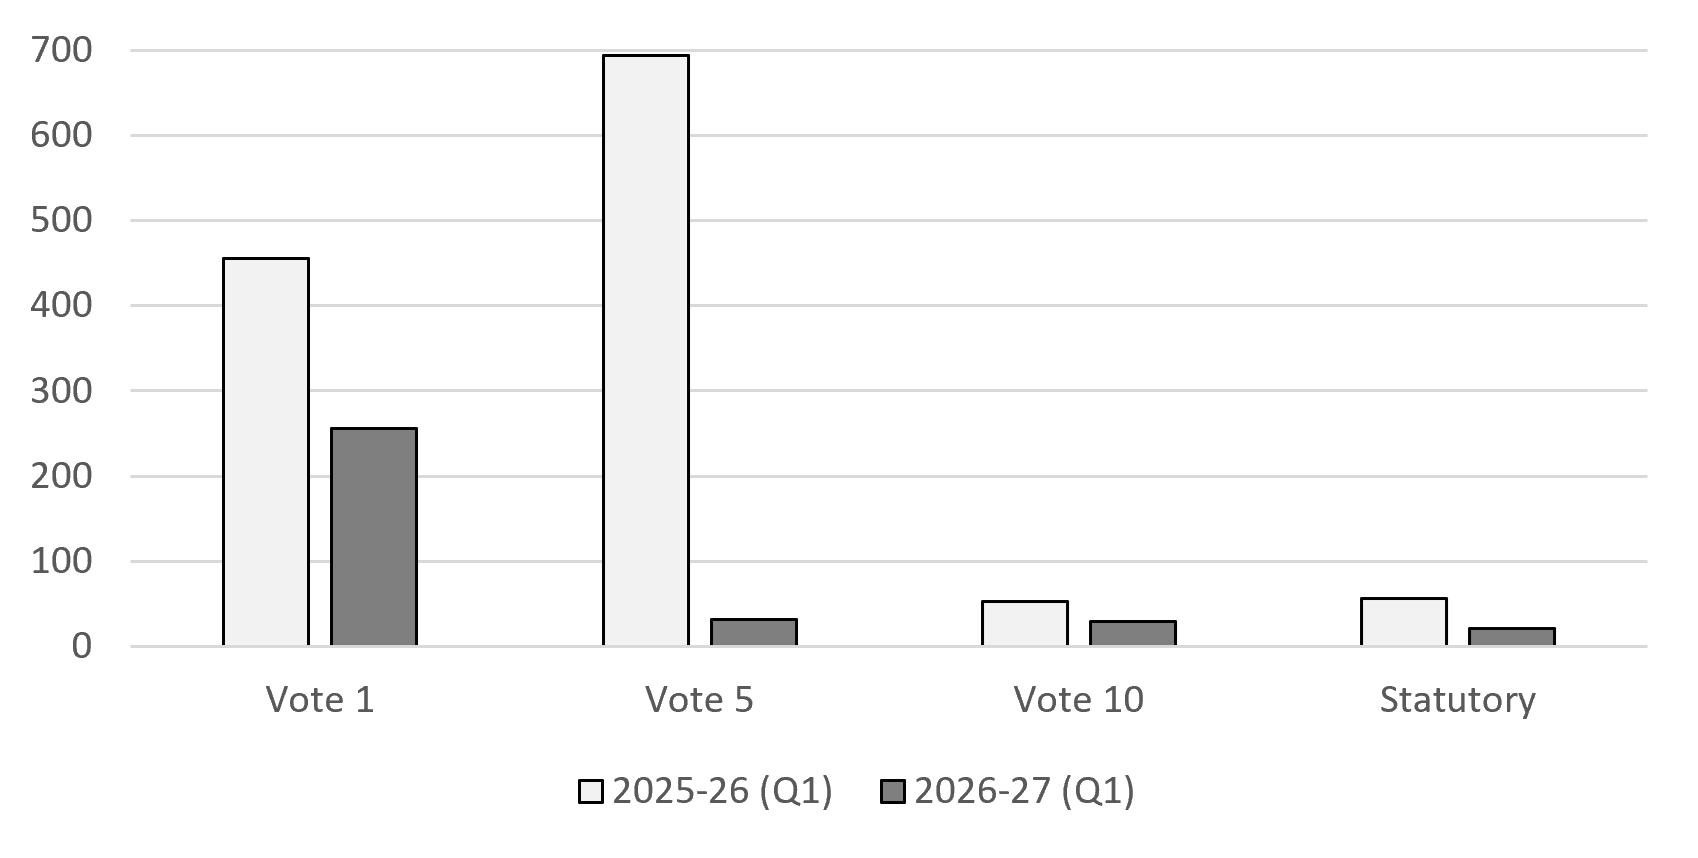
In the first quarter of 2026-27, total budgetary expenditures amounted to $338.2 million compared to $1,258.4 million reported in the same quarter of 2025-26. This represents a decrease of $920.2 million, or 73.1%.
Decreases are largely due to the transfer of the Canadian Coast Guard (CCG) to the Department of National Defence (DND) and are explained as follows:
- Vote 1 - Operating expenditures (decrease of $199.6 million or 43.8%)
This variance is mainly attributed to a decrease in personnel salary costs and vessel fuel expenditures due to the transfer of the CCG to the DND.
- Vote 5 - Capital expenditures (decrease of $662.2 million or 95.4%)
This variance is mainly attributed to a decrease in expenditures associated with the procurement activities related to the Polar Max vessel, as well as construction engineering and architectural service expenditures related to the Canadian Coast Guard fleet projects.
- Vote 10 - Grants and Contributions expenditures (decrease of $23.0 million or 43.8%)
This variance is mainly explained by a timing difference in payments related to the Fish Funds and Pacific Salmon Strategy Initiative. Additionally, there was a decrease in payments related to moderate livelihood fishing, as well as the transfer of the CCG to the DND.
- Statutory – Authorities used (decrease of $35.4 million or 63.1%)
This variance is mainly attributed to a decrease in contributions to Employee Benefit Plans which is related to the reduction in resources and salary expenditures.
Comparison of authorities used, by Vote, during the first quarter of fiscal years 2025-26 and 2026-27 (in millions of dollars)
Text version
| Dates | 2025-26 (Q1) | 2026-27 (Q1) |
|---|---|---|
| Vote 1 | 456 | 256 |
| Vote 5 | 694 | 32 |
| Vote 10 | 52 | 29 |
| Statutory | 56 | 21 |
As reflected in Table 2: Departmental Budgetary Expenditures by Standard Object (unaudited), the net decrease by standard object is mainly attributed to:
Decreases are largely due to the transfer of the Canadian Coast Guard (CCG) to the Department of National Defence (DND) and are explained as follows:
- Personnel (decrease of $203.7 million)
This variance is mainly explained by a decrease in personnel salary costs due to the transfer of the CCG personnel to the DND.
- Transportation and Communications (decrease of $11.7 million)
This variance is mainly explained by a decrease in travel expenditures.
- Professional and Special Services (decrease of $231.4 million)
This variance is mainly explained by a decrease in construction engineering and architectural service expenditures related to the Canadian Coast Guard fleet projects.
- Rentals (decrease of $6.2 million)
This variance is mainly explained by a decrease in rental costs for software licenses and the use of ships, buildings and facilities.
- Repair and Maintenance (decrease of $15.2 million)
This variance is mainly explained by a decrease in repair and maintenance expenditures related to refit work associated with the Canadian Coast Guard fleet.
- Utilities, Materials and Supplies (decrease of $18.7 million)
This variance is mainly explained by a decrease in the use of vessel fuel. In addition, fewer personnel and assets were deployed in operations, resulting in lower requirements for material and supplies.
- Acquisition of Machinery and Equipment (decrease of $423.0 million)
This variance is mainly explained by a decrease in expenditures associated with the procurement activities related to the Polar Max vessel.
- Transfer Payments (decrease of $23.0 million)
This variance is mainly explained by a timing difference in payments related to the Fish Funds and Pacific Salmon Strategy Initiative. Additionally, there was a decrease in payments related to moderate livelihood fishing, as well as the transfer of the CCG to the DND.
- Sales of Goods and Services (decrease of $9.4 million)
This variance is mainly explained by a decrease in the collection of marine service and wharf fees.
3. Risks and uncertainties
Fisheries and Oceans Canada operates in a dynamic environment that is affected by a number of factors, including: northern development; evolving relationships with Indigenous partners; climate change; demographics; technological advances; and global geopolitical and economic conditions. The Department maintains a Departmental Risk Profile which assesses corporate strategic risks, which if not managed and mitigated, could impair DFO’s ability to deliver on its mandate and achieve results under the Department’s core responsibilities. Additional information regarding the Department’s key risk areas is presented in the 2026-27 Departmental Plan.
Certain risks would have financial impacts should they materialize such as affecting the timing of transfer payments, which lie outside the control of the Department and could require funds to be shifted to future years to meet program requirements. To minimize these impacts, the Department continuously monitors program funding and expenditures throughout the year. In addition, the Department has put strategies in place such as the Centralized Financial Prioritization Model to ensure accountability and objectives are met.
As the Government maintains its efforts to manage growth and ensure efficient use of taxpayer money, Fisheries and Oceans is focused on reducing spending in strategic areas, with minimal impact to service standards. With continued fiscal constraint measures on the horizon, the focus on efficiency and value for money will be at the forefront to reflect an evolving financial and socio-economic landscape, as well as the continual support of regional representation, including a diverse public service workforce.
4. Significant changes in relation to operations, personnel and programs
The following changes in relation to operations, personnel and programs were made since the last published quarterly report:
- The appointment of Paul MacKinnon, as Deputy Minister of Fisheries and Oceans Canada, as of April 1, 2026.
5. Approval by senior officials
Approved by:
Original signed by
Paul MacKinnon,
Deputy Minister
Ottawa, Canada
Original signed by
Patrick Amyot, CPA,
Chief Financial Officer
Ottawa, Canada
6. Appendix
Table 1: Statement of authorities (unaudited)
(in thousands of dollars)
| Fiscal year 2025-26 | Fiscal year 2026-27 | |||||
|---|---|---|---|---|---|---|
| Total available for use for the year ending March 31, 2026* | Year to date used at quarter-end | Used during the quarter ended June 30, 2025 | Total available for use for the year ending March 31, 2027* | Year to date used at quarter-end | Used during the quarter ended June 30, 2026 | |
| Vote 1 – Operating expenditures | 2,266,709 | 455,922 | 455,922 | 1,129,593 | 256,274 | 256,274 |
| Vote 5 – Capital expenditures | 2,650,017 | 693,961 | 693,961 | 312,652 | 31,810 | 31,810 |
| Vote 10 – Grants and Contributions | 913,847 | 52,406 | 52,406 | 328,497 | 29,451 | 29,451 |
| Statutory | ||||||
| Statutory - Contributions to employee benefit plans | 221,872 | 55,468 | 55,468 | 114,912 | 20,685 | 20,685 |
| Statutory - Minister of Fisheries and Oceans – Salary and motor car allowance | 102 | 25 | 25 | 106 | 26 | 26 |
| Statutory - Spending of proceeds from the disposal of surplus Crown assets | 0 | 9 | 9 | 2,173 | 0 | 0 |
| Statutory - Refunds of amounts credited to revenues in previous years | 0 | 612 | 612 | 0 | 2 | 2 |
| Total Statutory | 221,974 | 56,114 | 56,114 | 117,191 | 20,713 | 20,713 |
| Total Authorities | 6,052,547 | 1,258,403 | 1,258,403 | 1,887,933 | 338,248 | 338,248 |
* Includes only Authorities available for use and granted by Parliament at quarter-end.
Table 2: Departmental budgetary expenditures by standard object (unaudited)
(in thousands of dollars)
| Fiscal year 2025-26 | Fiscal year 2026-27 | |||||
|---|---|---|---|---|---|---|
| Planned expenditures for the year ending March 31, 2026* | Year to date used at quarter-end | Expended during the quarter ended June 30, 2025 | Planned expenditures for the year ending March 31, 2027* | Year to date used at quarter-end | Expended during the quarter ended June 30, 2026 | |
| Expenditures: | ||||||
| Personnel | 1,672,113 | 424,103 | 424,103 | 816,107 | 220,444 | 220,444 |
| Transportation and communications | 92,610 | 19,450 | 19,450 | 36,811 | 7,706 | 7,706 |
| Information | 9,100 | 1,746 | 1,746 | 7,631 | 2,475 | 2,475 |
| Professional and special services | 1,620,268 | 257,366 | 257,366 | 278,648 | 26,009 | 26,009 |
| Rentals | 75,576 | 12,125 | 12,125 | 32,689 | 5,934 | 5,934 |
| Repair and maintenance | 178,221 | 24,825 | 24,825 | 66,587 | 9,658 | 9,658 |
| Utilities, materials and supplies | 159,154 | 21,542 | 21,542 | 47,345 | 2,880 | 2,880 |
| Acquisition of land, buildings and works | 424,686 | 19,283 | 19,283 | 190,085 | 18,773 | 18,773 |
| Acquisition of machinery and equipment | 920,593 | 429,006 | 429,006 | 67,201 | 5,966 | 5,966 |
| Transfer payments | 913,847 | 52,406 | 52,406 | 328,497 | 29,451 | 29,451 |
| Other subsidies and payments | 26,390 | 6,274 | 6,274 | 16,332 | 9,308 | 9,308 |
| Public Debt Charges | 0 | 0 | 0 | 0 | 0 | 0 |
| Total gross budgetary expenditures | 6,092,558 | 1,268,126 | 1,268,126 | 1,887,933 | 338,604 | 338,604 |
| Less Revenues netted against expenditures: | ||||||
| Sales of goods and services | 40,011 | 9,723 | 9,723 | 0 | 356 | 356 |
| Total Revenues netted against expenditures | 40,011 | 9,723 | 9,723 | 0 | 356 | 356 |
| Total net budgetary expenditures | 6,052,547 | 1,258,403 | 1,258,403 | 1,887,933 | 338,248 | 338,248 |
* Includes only Authorities available for use and granted by Parliament at quarter-end.
- Date modified: