
Socio-economic Overview of the Southampton Island Area of Interest
On this page
- Summary
- Introduction
- Methodology
- Demographic profile of the study area
- Overview of economic activities in or near the area of interest (AOI) by sector
- Overview of ecosystem services
- Overview of social and cultural values
- Bibliography
- Annexes
- Matrix 1: Total economic valuation flowchart and definitions
- Contact us
Summary
The goal of this report is to provide a socio-economic overview of the Southampton Island AOI. Specifically, the report included a snapshot overview of the current and potential future economic activities linked to the Southampton Island AOI. The report uses the best available knowledge/information at the time the socio-economic overview report was finalized. The report is intended to provide information to DFO and partners to support their consideration of long-term marine conservation within the AOI. More information from partners and stakeholders will be considered during future protection evaluations and discussions. DFO will continue to collaborate with partners and stakeholders to ensure accurate acknowledgement and understanding of activities that occur within the boundaries of the AOI.
Baselines values (by sector) or magnitude of economic activities linked to the AOI have been estimated either quantitatively or provided qualitative descriptions of the ecosystem services. Secondly, supplementary reports, and consultations with subject matter experts have been used to provide a quantitative and/or qualitative overview of the future economic activities linked to the AOI.
The report found that the AOI provides invaluable direct and indirect services to society through maintaining ecosystems and biodiversity. Direct services (for example, subsistence harvesting) are captured with the corresponding direct benefits to the community. The AOI provides considerable subsistence, social, cultural, and spiritual benefits to regional residents and contributes significantly to the economy.
The report identifies recreational and tourism activities within the AOI. This included:
- wildlife viewing (for example, whale and bird watching)
- dogsledding
- canoeing
- kayaking
- cruises
- fishing
- hunting
- cultural tours
- camping
- hiking
The report highlighted nearby mining and exploration activities, along with vessel activities of all types within the AOI, are critically important from a socio-economic perspective for adjacent communities and Nunavut at large. The development of many resource extraction projects in the Kivalliq Region of Nunavut is likely to create new employment and income opportunities for communities around the AOI both directly and indirectly. Additionally, the report highlights importance of vessel-based transportation within the AOI and the surrounding areas as there are limited transportation alternatives.
Introduction
The Southampton Island Area of Interest (AOI) is in the marine area surrounding Southampton Island, Coats Island and Chesterfield Inlet (see Annex 1 for the spatial scale of the Southampton Island AOI) and covers 93,087 square kilometers (km2). This area is a potential for designation as a new Marine Protected Area (MPA) under Canada’s Oceans Act. It captures important portions of 3 identified Ecologically and Biologically Significant Areas (EBSAs) (Fisheries and Oceans Canada (DFO), 2011a):
- Southampton Island
- Repulse Bay/Frozen Strait
- Western Hudson Bay Coastline
The AOI was identified based on:
- its ecological and biological significance
- diversity of marine wildlife including the use of the area by:
- seals
- walrus
- bowhead whales
- belugas
- polar bears
- narwhal
- seabirds
- orcas
- the increase of human activity
- community and Regional Inuit Association support
The AOI is in proximity to the Repulse Bay/Roes Welcome Sound area bordering the existing Ukkusiksalik National Park, an area identified by Parks Canada’s National Marine Conservation Areas (NMCA) system plan as being a “preferred representative marine area.” This means that the area has not been selected for an NMCA process, but there may be future interest in an NMCA process for the area. In addition, a notable ice bridge occasionally forms across Roes Welcome Sound – this bridge allows for caribou migration between Southampton Island and the mainland and is considered an important feature to both Inuit and wildlife (Babb et al., 2022).
The Southampton Island AOI has a number of ecologically significant features (Loewen et al., 2020a). The marine area around Southampton Island provides a migration pathway for marine mammals, important haul-out sites for walrus, and denning areas and summer refuge for polar bears. The Eastern Canada-West Greenland bowhead whale population can also be found in the area. The marine area supports colonies of nesting Common Eiders and other seabirds. Most of the Southampton Island EBSA is captured in the AOI. Repulse Bay/Frozen Strait is a summer marine mammal and seabird feeding area. The Western Hudson Bay Coastline area is particularly important during the ice-free season for Beluga, seabirds, and important Arctic Char stocks feed in the area. A southern portion of the Repulse Bay/Frozen Strait EBSA is captured in the AOI on the north side of Southampton Island. The northern portion of the Western Hudson Bay Coastline EBSA is also captured in the AOI.
In addition to the important ecological features of the AOI, the AOI supports the ongoing tradition of the Kivallarmiut. This involves socio-economic activities that have immense value to those who participate or benefit from them. In addition to the areas previously stated, AOI stakeholders have expressed the desire for conservation efforts to the Duke of York Bay, as the bay has significant cultural, economic, and ecological value to Kivallarmiut. The Bay is extensively used for sport hunting and subsistence harvesting providing significant socio-economic value to the communities within the AOI.
Once an AOI is identified, the MPA designation process requires that a socio-economic analysis be conducted at the early stages of AOI selection and MPA designation to support the refinement of geographic boundaries, the assessment of regulatory options for cost-effectiveness, to facilitate consultations, and to supplement the ecological information and other relevant information (DFO, 2016).
Report objective
The socio-economic overview of the Southampton Island AOI provides an early identification of past, current, and potential (limited to 10 years into the future) social and economic activities linked to the geographic area within which the AOI is located.
The overview is guided by the DFO framework for integrating socio-economic analysis in the MPAs designation process, and by the Treasury Board of Canada Secretariat’s Canadian Cost-Benefit Analysis Guide For Regulatory Proposals. DFO has consulted communities on this report to ensure that it is an accurate description of the activities that have taken and may take place within the AOI.
The information contained in the report will in part inform the regulatory triage statement, as required by federal regulatory policy, and may be used to inform consultations regarding potential MPA designation. Additionally, this report in conjunction with the Ecosystem Overview Report (Loewen et al., 2020a), will serve as the policy and economic baseline for the Cost-Benefit Analysis (CBA) in the subsequent steps of the MPA designation process. The CBA, which evaluates the incremental impacts (costs and benefits) of the regulatory intent for the proposed MPA Regulations, will be finalized and will assist in informing the development of the Regulatory Impact Analysis Statement (see Annex 2). The Socio-Economic Overview Report is also intended to provide information to partners to support their consideration of long-term marine conservation in the area.
It is to note that the information in this report represents the best available information at the time of its writing. This report does not represent a legally binding document that will restrict the gathering or consideration of other information throughout the analyses, establishment, and monitoring of any potential future marine protections.
Methodology
The Framework for Integrating Socio-Economic Analysis in the MPA Establishment process (DFO, 2016) is aligned with the federal regulatory policy encapsulated in the Cabinet Directive on Regulations and the accompanying guidance documents developed by Treasury Board of Canada Secretariat (TBS, 2007). This also informs the scope and content of the overview.
In terms of valuation, this report adopts the Total Economic Valuation (TEV) technique (see Matrix 1 for definitions), which relates all benefits to human welfare measures.
To determine economic activities within the AOI, the Socio-Economic Overview Report considers past, present, and future activities. The current activities occurring within the AOI are those that have occurred within about the last 5 years. However, relevant historical activities were also included in the report, where appropriate. Additionally, potential future economic activities within the next 10 years which have evidence of intent (for example, leases, permits, submission of plans for approvals, etc.) were included in the report where information was available.
The socio-economic overview of the Southampton Island AOI was developed in consultation with the Marine Planning and Conservation Program of DFO, in terms of scope of the study and boundaries.
Data sources
The data used to develop the community profiles around the AOI primarily came from demographic surveys conducted by the Nunavut Bureau of Statistics and the Canada 2021 Census. Other sources of information and data came from:
- Government of Canada
- Government of Nunavut
- industry and corporations
- boards
- academic researchers
- consultants
While the extant literature provides limited data on the AOI, where appropriate, the report used information available at relevant publicly accessible websites and in the literature as secondary sources of information.
Supplementary reports and consultations with subject matter experts have been used to provide a quantitative and/or qualitative overview of the future economic activities linked to the AOI. DFO, the Government of Nunavut, and the Kivalliq Inuit Association also gathered primary information on relevant economic activities from community consultations. Additionally, information and expert opinions were also obtained from various sources such as, DFO’s Arctic Region’s Fisheries Management Programs and Ontario and Prairie Region’s Marine Planning and Conservation and Science programs.
Of note, the COVID-19 pandemic saw restrictions and subsequent impacts to social and economic activities across the globe. These impacts were also seen in:
- Nunavut
- the Kivalliq Region
- the AOI
From 2020 to 2022, government restrictions and various personal preferences had influenced the ability or desire to participate in activities. As such, data from 2020 to 2022 within this report may not be representative of a typical year. As an example, travel restrictions in 2020 did not allow for the Atlantic walrus sport hunt to take place, resulting in lost wages and participation.
For all materials consulted or cited in the creation of this socio-economic overview:
Demographic profile of the study area
Communities
The AOI is adjacent to the communities of Coral Harbour and Chesterfield Inlet. Communities outside but also part of the Kivalliq Region include:
- Naujaat
- Rankin Inlet
- Baker Lake
- Arviat
- Whale Cove Footnote 1
According to the 2021 Statistics Canada census (Statistics Canada, 2021), 1035 individuals live in Coral Harbour, of which 62% are ages 15 and over and 94% of the population is Inuit (see Table 1). Coral Harbour’s population is growing, with an increase of 144 people (16%) between 2016 and 2021 censuses. Median employment income is $15,300, less than half the territorial median income ($38,000), with an employment rate of 37%. Most of the labour force works in:
- sales and service
- education
- law and social
- community and government services
- trades
- transport
- equipment operator occupations.
Coral Harbour continues to rely on traditional self-employment, including:
- hunting
- fishing
- sewing
- carving in bone, ivory, and stone
Outfitters in the community are becoming more involved with eco-tourism opportunities.
According to the 2021 census, 397 individuals live in Chesterfield Inlet, of which 68% are ages 15 and over and 93% of the population is Inuit. Chesterfield Inlet’s population is shrinking, with a decline in population of 40 people (9%) between the 2016 and 2021 censuses. Median employment income is $33,200, less than that of the territory ($38,000), with an employment rate of 48%. Most of the labour force works in:
- sales and service
- education
- law and social
- community and government services
- trades, transport
- equipment operator occupations
Of the nearby communities, Rankin Inlet, a regional hub, is the largest with 2,975 people. Arviat, Baker Lake, and Naujaat, are all larger than Coral Harbour and Chesterfield Inlet with 2,864, 2,061, and 1,225 people, respectively. Whale Cove is larger than Chesterfield Inlet, but smaller than Coral Harbour with a population of 470. The population in Baker Lake remains fairly steady with an insignificant (0.3%) drop in population from the 2016 to 2021 censuses. Four of these communities experienced population growth in the same period:
- Rankin Inlet (5%)
- Naujaat (13%)
- Arviat (8%)
- Whale Cove (8%)
Nunavut had an overall population growth of 3% between the 2 censuses. Growth within the communities, and Nunavut at large, can exasperate infrastructure challenges and shortcomings they already face such as, but not limited to:
- housing
- healthcare
- internet access (Nunavut Tunngavik Incorporated, 2020)
Without more infrastructure to accommodate the growth, real barriers will continue to exist for economic, health, and educational opportunities for Nunavut Inuit (Nunavut Tunngavik Incorporated, 2020).
The population of Nunavut and all the included communities are relatively young, ranging from 30% to 42% of the population being under the age of 15, compared to 16% for Canada as a whole. This presents both opportunity and challenges for Nunavut and the communities in and around the Southampton Island AOI. One of the greatest opportunities is that there will be an available, young labour force when they come of age. However, with this cohort’s relatively low employment and participation rates, there may not be enough jobs or job training available. In addition, one of the greatest challenges that faces Nunavut’s younger population is housing affordability – this does not only impact youth, but younger populations have a significantly higher affordability challenge. In 2020, 76% of Nunavut households with a younger population were unable to secure housing in 2020 (CMHC, 2022). The Canada Mortgage and Housing Corporation found that in Nunavut in 2020, the minimum household income required to afford a bachelor rental unit was $70,000 and that the minimum household income required to afford a single-detached home was $166,000 (CHMC, 2022). Housing affordability challenges persist in the territory in part due to limitations of development of new housing – new development has been restricted due to high costs of construction and inadequate availability of land (CMHC, 2022).
Median incomes are lower than the Nunavut median in:
- Baker Lake ($39,200)
- Naujaat ($17,600)
- Arviat ($20,200)
- Whale Cove ($20,200)
Rankin Inlet’s median income ($50,000) is higher than in Nunavut.
Employment rates in Coral Harbour, Chesterfield Inlet are 37% and 48%, respectively. Both are lower than in Nunavut (49%). Baker Lake, Naujaat, Arviat, and Whale Cove are also have lower averages than in Nunavut (40%, 36%, 40%, and 40%, respectively). Rankin Inlet (59%) is higher than in Nunavut.
In all 6 communities, sales and service, education, law and social, community and government services, and trades, transport and equipment operator’s occupations are the 3 largest occupational categories and make up a majority of the employed.
When assessing Gross Domestic Product (GDP) of provincial and territorial economies from 2021-2022, Stats Canada found that Nunavut’s economy advanced 1.6% following growth of 7.9% in 2021 (Bossé, 2023), such as:
- mining, quarrying, and oil and gas extraction rose 5.3% as all industries expanded
- the construction sector registered a decline of 9.2%. Regarding service sectors, the largest gains were in industries that were recovering from the COVID-19 pandemic related restrictions
- transportation and warehousing had a 35.5% increase and accommodation and food services increased by 25%
- real estate and rental leasing, wholesale trade, and retail trade all declined by 7.2%, 32.6% and 6.1%, respectively (Bossé, 2023)
Nunavut communities typically have a mixed economy which includes both a wage-based market economy and a social economy of land-based activities. In addition to earning wages from employment, Inuit engage in traditional land-based activities, such as:
- hunting
- fishing
- crafting
- artwork (Conference Board of Canada (CboC), 2023)
The high price of importing goods into these communities due to their remoteness means individuals often supplement their incomes and diets with traditional country foods and crafting.
| Coral Harbour | Chesterfield Inlet | Baker Lake | Rankin Inlet | Naujaat | Arviat | Whale Cove | Nunavut | Canada | |
|---|---|---|---|---|---|---|---|---|---|
| Population (2021) | 1,035 | 397 | 2,061 | 2,975 | 1,225 | 2,864 | 470 | 36,858 | 36,991,981 |
| Population (2016) | 891 | 437 | 2,069 | 2,842 | 1,082 | 2,657 | 435 | 35,944 | 35,151,728 |
| Age 15+ (%) | 62 | 68 | 68 | 70 | 58 | 63 | 63 | 67 | 84 |
| Inuit (%) | 94 | 93 | 91 | 83 | 98 | 95 | 96 | 84 | 0.19 |
| Labour Force Participation Rate (%) | 56 | 67 | 55 | 70 | 51 | 50 | 50 | 59 | 64 |
| Employment Rate (%) | 37 | 48 | 40 | 59 | 36 | 40 | 40 | 49 | 57 |
| Median Employment Income ($) | 15,300 | 33,200 | 39,200 | 50,000 | 17,600 | 20,200 | 20,200 | 38,000 | 37,200 |
Source: Statistics Canada, 2021
Government and other organizations
There are many levels of government and governmental organizations, non-government, and community organizations with potential relevance to the AOI. Details of the relationship between these organizations and the AOI are highlighted in Annex 3.
It is important to note that on January 18, 2024, the Government of Nunavut, Nunavut Tunngavik Incorporated, and the Government of Canada co-signed the Nunavut Lands and Resources Devolution Agreement. This Devolution Agreement will transfer responsibilities over lands, resource management, and rights with respect to waters. Associated with this agreement are provisions to assist with:
- timelines
- management of resources (human resources, assets, records, etc.)
- funding to support the transfer
Lastly, royalties from any resource development of Nunavut’s minerals, oil, and/or gas would be directed towards the Government of Nunavut. The parties involved will continue to collaborate to complete the transfer of responsibilities by April 1, 2027. This is notable as the implications of devolution will have socio-economic impacts on Nunavut and the AOI.
Infrastructure
Typical capital assets for subsistence and commercial activities in these communities include:
- freezers
- carving equipment
- carpentry items
- sewing machines
- skin stretchers
- drying racks
- equipment repair tools
- camping equipment
Larger capital assets, generally used for harvesting purposes include:
- boats
- snowmobiles
- all-terrain vehicles (ATV)
- motors
- rifles
- fishing nets
- anchors (Kennedy, 2010)
Limiting factors to community development of infrastructure include challenges relating to construction within the Arctic – as an example, the lack of gravel for foundations of buildings and housing create cascading impacts to the territorial economy (Canadian Ecotourism Services, 2023).
Marine infrastructure in Nunavut’s population centers is very minimal and is designed primarily for basic community freight needs. This infrastructure is critical as communities depend on the annual marine supply for food, vehicles, construction materials and other commodities that are not economically feasible to be shipped by airplane (Government of Nunavut, 2012). Both Coral Harbour and Chesterfield Inlet have some marine infrastructure, including docks (Aarluk Consulting Inc., 2010; Vard, 2016); however, Territorial Government officials anecdotally believe these are outdated and no longer able to service the region adequately. Chesterfield Inlet and Naujaat were specifically identified in the 2006 Nunavut Small Craft Harbours report (Government of Nunavut, 2006) as 1 of 7 communities that would benefit from a small craft harbor, but also anticipates that eventually all Nunavut communities will require harbour infrastructure. Current work is underway to improve sealift barge ramps and laydown areas in:
- Rankin Inlet
- Arviat
- Chesterfield Inlet
- Baker Lake (Canada-Nunavut Geoscience Office, 2020) Footnote 2
However, at present, only 7 Nunavut communities have harbours built, under construction, or in planning. While building a deep-sea port near the community might have been viewed as a way to reduce the potential effects of increased shipping through the inlet (Nunatsiaq News, 2020), the feasibility of it and the subsequent socio-economic impacts are yet to be determined. An MPA has the potential to increase ecotourism due to the preservation of natural ecosystems. It is estimated that ecotourism is among the largest sectors with respect to the ocean economy, making up about 50% of all global tourism (Morse et al., 2024). To ensure that communities in and around the MPA can capitalize on the economic benefits of the MPA, dock infrastructure will be critical to tourism activities such as offloading tourists seeking ecotourism opportunities.
As the communities within the AOI are primarily connected via marine or air travel, a few road projects have been considered. One important road within the AOI is an access road connecting Coral Harbour to the Duke of York Bay – the road allows residents and potential tourists to access cabins and significant hunting grounds (Nunami, 2008 and Coral Harbour, Website). In 2012, the Nunavut and Manitoba Governments continued discussions regarding an all-weather road connecting the territory to the province; however, a business case developed in 2010 showed that the economic costs outweighed the benefits (Nishi-Khon and SNC Lavalin, 2010 and CBC, 2012). In 2017, the Nunavut government further considered a proposal for connecting Manitoba and Nunavut through a winter road (Westhaver, 2017). Future winter road development and usage will need to consider reduced functionality due to warming temperatures caused by climate change – although considered, no action has been taken to establish this winter road. In August 2019, Transport Canada announced a $4.5 million (M) study and design of a 450-km all-season road in the Kivalliq Region. The proposed road would connect Arviat, Chesterfield Inlet, Rankin Inlet and Whale Cove (Nunavut News, 2019). To connect Baker Lake to the Rankin Inlet/Chesterfield Inlet zone, a ferry crossing must be made of either the Thelon River, Baker Lake, or Chesterfield Inlet. The initial route selection and engineering and environmental assessments were to commence in 2021 (Canada-Nunavut Geoscience Office, 2020). Should this potential road come to fruition, it would likely impact the frequency of marine vessel transport through the AOI.
Air transport infrastructure provides a critical component to the region’s economy. It allows for inter-community passenger flights, the movement of freight, and air ambulances (Government of Nunavut, 2021a). With limited road infrastructure and sealifts being restricted to summer to early fall, air transportation provides the only dependable year-round transportation option (Government of Nunavut, 2021a). Arviat, Baker Lake, Coral Harbour, Naujaat, Whale Cove, and Chesterfield Inlet have airports with gravel runways suitable for smaller aircraft (Aarluk Consulting Inc., 2010; Vard, 2016; and Government of Nunavut, 2021a). Whereas the Rankin Inlet airport is the only airport within the Kivalliq Region that has an asphalt runway suitable for servicing larger aircraft such as a Boeing 737-400 Footnote 3. Construction has begun for replacement air terminal buildings in Naujaat, Chesterfield Inlet, Whale Cove and as well, construction has begun on a major expansion of the Rankin Inlet air terminal building with its construction starting in 2022 (Canada-Nunavut Geoscience Office, 2021). Beyond the upgrade to the Rankin Inlet terminal building, the Government of Nunavut and the Department of Economic Development and Transportation have released a 20-year capital needs assessment update (2020-2040) that outlines the investments needed for safe, effective, and reliable air transportation systems (Government of Nunavut, 2021a).
The Kivalliq Inuit Association and Nukik Corporation are developing the Kivalliq Hydro-Fibre Link. The link will be a 150MW transboundary transmission infrastructure connecting Gillam, Manitoba grid to the Kivalliq Region of Nunavut; the link will deliver reliable renewable energy from Manitoba Hydro and broadband internet service to Kivalliq communities (Nukik, Website). This project will help in the efforts to shut down diesel engines with a vision to connect the communities of Arviat, Baker Lake, Chesterfield Inlet, Rankin Inlet, and Whale Cove, along with Agnico Eagle’s Meliadine and Meadowbanks mines to Manitoba Hydro (Above and Beyond, 2019). The Kivalliq Inuit Association received $1.6 M from the federal government in February 2019 to update past feasibility work on the project (Nukik, Website). The 2021 federal budget included an endorsement of the Kivalliq Hydro-Fibre Link to connect Kivalliq to Manitoba and $40 M over 3 years to support hydroelectric and grid interconnection projects in the north (Pameolik, 2021). The proposed added power and infrastructure has the potential to increase mineral exploration and extraction within the region. A recent prospectivity exercise demonstrated that there are less explored areas within the Kivalliq Region that have potential for future mines within 50 to 100 kilometers (km) of the proposed hydro/fiber optic line (GeoVector, 2020 and 2022) – demonstrating the applicability and need of the hydro/fiber optic line. In 2023, the Government of Canada included this project in the 2023 Federal Budget as being an important project; Nukik intends to advance towards construction planned for 2026 with the goal of commissioning and energizing the line by the end of 2030 (Nukik, Website). There is potential for this line to traverse through the AOI, however, this has yet to be confirmed and would have minimal implications to the socio-economic costs and benefits of the project or on the AOI itself.
Qulliq Energy Corporation proposed to the territory’s Utility Rates Review Council to upgrade Chesterfield Inlet’s power plant, proposing a $35 M update to the 1975 power plant. $22.4 M of the proposed $35 M would come from the Arctic Energy Fund, a federal program; the remaining $12.6 M would be covered through an application for higher power rates (Nunavut News2022). This project would allow for the new plant to have the capability to integrate potential future renewable energy resources (Quilliq Energy Corporation, 2021). If adoption and integration of renewables occurs, it is within reason to believe that there could be potentially less demand for fossil fuel-based energy, and therefore, reduced fuel resupply efforts relating to local energy needs.
Kivalliq Alternative Energy Ltd. Is proposing a solar energy project in Coral Harbour. The project has gone through a public comment period through the Nunavut Impact Review Board (NIRB) in September 2022. The project could provide up to 31% of the community’s energy needs; resulting in an estimated 360,000 litres of diesel diverted annually and more than 10 M litres of diesel over the 30-year life of the project (NEC, 2022a). The project is proposed to span an approximate 6.5 acres and is located about 10.3 km northwest from Coral Harbour. The project would host 2,070 fixed tilt solar modules that would connect to the community’s micro grid. Construction for the project is proposed to start in 2024 (NEC, 2022b). If successful, this project has the potential to reduce the community’s tanker resupply efforts, thus reducing the potential vessel traffic within the AOI.
Quintillion Global Communications is currently working on a Subsea Fiber Optic Cable System (broadband connectivity) (Quintillion, Website). The project requires the installation of a 15,600 km subsea fiber optic cable network that would connect to Asia and Western Europe via the Northwest Passage’s southern channel in the Canadian Arctic, and will be completed over 3 phases (Gavrilchuk and Lesage, 2014 and Sponagle, 2016). These phase were as followed:
- phase 1, the construction through Alaska was completed as of December 2017
- phase 2 of the project will connect the network to Asia
- phase 3 will connect the network from Alaska to Canada
- phase 4 will connect Canada to the United Kingdom (Quintillion, 2020)
A ship to install the underwater cable would have to move through northern Canadian waters. The proposed route for phase 4 could be built in waters north of the Southampton Island AOI but may pass through the eastern tip of the AOI. Quintillion has not yet announced a timeline for phase 4 or which communities they will connect to the system. No submission has been made to NIRB to date regarding this potential project. The Government of Nunavut’s Department of Community and Government Services proposed an undersea fibre optic cable installation linking:
- Greenland
- Nunavut
- Quebec
The submarine fiber optic system would have connected Iqaluit, Kimmirut and Kinngait with an international connection to Nuuk, Greenland. The installation would have concluded the future capability to connect to northern Baffin Island and the Kivalliq Region. The scope of the project included:
- construction
- operation
- maintenance
- decommissioning
- abandonment of a fibre optic cable system
About 2,400 km of fibre optic cable would have been installed including:
- all submarine and cable-landing infrastructure
- fibre optical cable
- powered repeaters
- line terminating equipment
- power-feeding equipment
- monitoring equipment (Nunavut Impact Review Board, 2019)
In 2021, Nunavut changed plans and will instead focus on connecting Iqaluit to Quebec through Nunavik. The first portion of this fibre optic cable network had begun installation in July of 2021 and is expected to be completed by end of 2021, installing cable along the eastern coast of Hudson Bay (Nunatsiaq News, 2021 and Arctic Today, 2021). The fibre optic system could potentially extend through the AOI to other communities in the Kivalliq Region.
Potential corridors for the undersea fibre optic cable would include an installation from the east of the AOI right into Coral Harbour and then an installation from Coral Harbour due southwest towards Chesterfield Inlet. The fibre optic cable installation could consist of a combination of laying the cable flat on the seabed and burying under the seabed. From a cost perspective, burial is much more expensive than laying cable on ocean bed. Footnote 4
Baseline management measures
Marine wildlife and habitat within the AOI are managed through a combination of legislation, regulatory and non-regulatory measures, Integrated Fisheries Management Plans (IFMP), land use plans and other measures. These measures and plans pertain to:
- fishing
- harvesting
- conservation
- resource use
- resource extraction
- marine transportation
Key federal legislation and regulations with management authority over the waters of the AOI include:
- Oceans Act
- Fisheries Act
- Marine Mammal Regulations and Northwest Territories Fishery Regulations (enabled by the Fisheries Act)
- Species at Risk Act
- Canada Shipping Act, 2001
- Arctic Waters Pollution Prevention Act
- the Migratory Birds Contraventions Act
- Nunavut Planning and Project Assessment Act (NUPPAA)
- Nunavut Act
In addition to key federal legislation and regulations, identified key territorial legislation and regulations include the:
- Nunavut Wildlife Act
- Scientists Act
- Tourism Act
There are IFMPs for Atlantic walrus and narwhal. IFMPs generally contain management measures such as:
- stock status
- harvest levels
- shared stewardship arrangements
- monitoring and reporting
- licensing
- sale and transportation
- habitat/ecosystem protection
The Nunavut Planning Commission (NPC) currently implements the approved Keewatin Regional Land Use Plan (KRLUP). The land use plan provides guidance and direction for the conservation, development, and land use within their respective planning regions. The KRLUP contains a policy framework that recognizes the importance of conserving natural and cultural resources, and establishing protected areas. In June 2023, a recommended Nunavut Land Use Plan was submitted for acceptance to:
- Government of Canada
- Government of Nunavut
- Nunavut Tunngavik Inc
If approved, the plan would come into force and replace application of the KRLUP. The recommended plan includes certain restrictions on land and marine use in parts of the AOI.
The NIRB assists with the assessment of development within the Nunavut Settlement Area. The NIRB utilizes potential biophysical and socio-economic impacts of proposals and makes recommendations and decisions on which projects may proceed; projects with potential impacts on marine wildlife and habitat, such as mining projects, are required to develop a Shipping Management Plan in accordance with:
- Canada Shipping Act
- Arctic Waters Pollution Prevention Act
- associated regulations
The NIRB also has the authority to impose terms and conditions on a project certificate. Proponents are required to comply with these conditions and provide regular reports. This process aims to ensure that adverse social, economic, and environmental impacts of projects are effectively mitigated.
The most relevant treaties, codes, and agreements for the Southampton Island AOI include:
- Convention on Biological Diversity (CBD)
- Migratory Bird Treaty
- Agreement on the Conservation of polar bears
- Convention on Persistent Organic Pollutants
- International Code for Ships Operating in Polar Waters (Polar Code)
- Agreement on Cooperation on Aeronautical and Maritime Search and Rescue in the Arctic
- Agreement on Cooperation on Marine Oil Pollution Preparedness and Response in the Arctic (MOSPA)
- Agreement on Enhancing International Arctic Scientific Cooperation
Additionally, in December 2016, the Government of Canada announced that the Canadian Arctic Ocean will be indefinitely off limits to new oil and gas exploration licensing. The Government of Canada has committed to reviewing this freeze every 5 years through a science based, life-cycle approach, considering marine and climate change science. Consultations will inform the 5-year assessment (Prime Minister of Canada, Dec. 20, 2016). This moratorium applies to the area in which the AOI is located. The moratorium has been extended until December 31, 2028, at which point it is expected to be extended (SOR/2022-274).
Overview of economic activities in and around the AOI by sector
Commercial and emerging fisheries
The fishing industry in Nunavut, which includes both commercial and subsistence fisheries, is a fundamental aspect of the health and well-being of Nunavummiut (Government of Nunavut, 2016).
Nunavut’s large scale commercial fisheries for Greenland halibut (turbot) and Northern and striped shrimp occur in:
- Baffin Bay
- Davis Straight
- Hudson Strait
There are no turbot or shrimp fisheries within or near the AOI boundary.
There are, however, commercial Arctic char quotas within the AOI (see figure 1). These quotas are established within the Northwest Territories Fishery Regulations, Schedule V (Sections 17, 18, and 19) and may be subject to variation order.
Anadromous Arctic char are distributed throughout the AOI during the summer months for migration and marine feeding in the region. There are no updated scientific data available for char along the Western Hudson Bay coastline (including Chesterfield Inlet) despite past and present fishing activity in the region, however models developed by Roff et al. (2020) predict extensive use of coastlines within the AOI (DFO, 2020).
Many rivers within Chesterfield Inlet proper appear to support movements of anadromous char from freshwater to marine feeding areas based on subsistence and commercial harvesting activities in the region (DFO, 2020) (see figure 2). These freshwater systems are likely used for overwintering, rearing of young and reproduction within the region and drain directly into the SHI AOI. Past fisheries (late 1980’s and 1990’s) at Uvajuq, Akuq, Qimatujuarvik, Qasigiarsiurvik and Sungaarnarsivik rivers had fisheries that brought in 25,000 pounds of fish annually, however, these numbers are no longer observed (DFO, 2020).
DFO has recorded data of minor commercial fishing for Arctic char within the AOI, particularly on the Cleveland and Thomsen Rivers and in the Coral Harbour area. Some in the community have expressed interest in establishing a viable commercial fishery. Sporadic test and commercial fishing effort has occurred in the area since 1988 . Limited to no data are available regarding the success of these test and commercial fishing efforts. A 2011 Land Use Strategy report suggested that the completion of the Duke of York Bay access road could potentially increase the economic viability of this Arctic Char commercial fishery (Coral Harbour, 2011) – however, this has not happened as of February 2024.
In 2018, Kivalliq Arctic Foods processed 9,000 lbs. of char from the Western Hudson Bay Coastline EBSA community members. Footnote 5 Most of the char sold to the plant had a whiter coloured flesh which makes the fish less marketable (DFO, 2020). The Kivalliq Arctic Foods processing facility in Rankin Inlet produces a wide range of products from meat and fish supplied to the plant from harvesters and fishers across Nunavut. Arctic char products include:
- whole frozen
- fillets
- char cubes
- dried and smoked char
The facility employs 7-12 local meat cutters and processors (Nunavut Development Corporation, 2019).
Efforts by DFO, Fisheries Management, Arctic Region and partnered stakeholders are underway to implement commercial logbooks in the Kivalliq Region to improve harvest/data reporting through commercial licence conditions. Data collected in logbooks will improve the shared understanding of commercial harvest and support sustainable management. Footnote 6 However, due to the current lack of commercial harvest information, the valuation of the existing commercial fishing within the AOI is considered to be infeasible for the purpose of the study. However, if the total regulatory set Footnote 7 commercial quota of 73,100 kg for Arctic char within the AOI Footnote 8 were to be harvested, the total estimated landed value (price paid to fishers) and market values (retail price) would be about $193,389.50 – $805,789.57 Footnote 9 and $2.35 M Footnote 10, respectively. In addition to commercial quota sold to fish plants, in accordance with rights stipulated in the Nunavut Agreement, Arctic char is also sold (for example, to Nunavut Country Food Store located in Iqaluit, through Facebook, etc.), bartered, exchanged, and given.
In and around Chesterfield Inlet, Arctic char fishing occurs in the winter and summer. From November into December, winter fishing occurs at Josephine Lake. In the summer, fishing starts in mid-July after ice break-up, and continues until early September. The community commercially fishes Arctic char with gillnets in Fish Bay with nets being set along the east and west sides of the inlet. There is no opportunity to use a weir. Footnote 11 Char biomass and population numbers have not been assessed and little is known about char for this region (both abundance and life history). Community members have reported a decline in the ability to capture char from Fish Bay (DFO, 2020).
In Chesterfield Inlet, the Iqalukpik fish plant, essentially a holding facility Footnote 12, is where fresh caught Arctic char are frozen and prepped for shipment to Kivalliq Arctic Foods fish plant in Rankin Inlet for processing. One person works at the Iqalukpik fish plant (employed by Kivalliq Arctic Foods), purchasing local fish, and then cleaning, freezing, bagging, and shipping the fish to Rankin Inlet Footnote 13.
Food fisheries are often supported by the small-scale commercialization of country food such as the selling of Arctic char to processing plants and using the income to continue to go out fishing and hunting. There is a large and growing amount of intersettlement trade of country food. A viable and growing territorial trade in sustainably harvested marine country food represents a significant economic opportunity for Nunavut harvesters (Government of Nunavut, 2016). The potential high costs for freight transport of country foods poses a challenge to the viability of Arctic food processing in Nunavut (Aarluk Consulting Inc., 2005). As of December 2023, Calm Air, an airline that operates within the Kivalliq Region, offers free shipment of country foods to communities within the Kivalliq, however, only for personal consumption; no price estimates for commercial transport were found (Calm Air, website). Another airline, Canadian North, provided DFO a price estimate of $1.31 per kg to ship country food within any route that they service that operates within Canada. Non-regional routes can require chartered shipments which would carry a higher freight cost. To support Country Food access, the Government of Nunavut provides a Country Food Distribution Program. This program helps communities build and maintain energy-efficient community freezers and support the harvesting infrastructure (Government of Nunavut, Website). This program supports both commercial distribution and subsistence harvests of country foods. Other financial support programs have been available over the years to support the distribution of country foods – it is expected that similar programs will continue due the socio-economic importance of country food harvests and consumption within Nunavut.
In Coral Harbour, Arctic char is largely a winter-based fishery (Government of Nunavut, 2016). Coral Harbour participated in the Nunavut Community Aquatic Monitoring Program (N-CAMP) in 2013, where members met with Coral Harbour residents who expressed interest in pursuing a commercial fishery. N-CAMP stated that the program can provide support by investigating the health of local fish stocks and training residents in the sampling procedures needed to maintain a fishery (N-CAMP website). The program was planned to run for 5 years, however, due to a lack of funding, interest in the program from community members diminished and the program ceased operations following the 2013 year.
During November 2019, August 2022 and August 2023 community meetings regarding the Southampton Island AOI, both Chesterfield Inlet and Coral Harbour expressed particular interest in developing commercial fisheries. Since the late 1980s, test fishing (Stage 1 feasibility emerging fisheries licences) has occurred in the Coral Harbour and Chesterfield Inlet areas for various species, including:
- Arctic char (fishing gears: Conduit Weir, Twine Weir, Angling, 139 mm (5-1/2”) Mesh Gillnets)
- Greenland halibut (Turbot) (fishing gear: Longline)
- snail
- striped shrimp
- snow crab (fishing gear: traps or nets)
- green urchin
- sea urchins (fishing gear: scuba). Footnote 14
Fisheries opportunities for scallops and mussels have also been identified near Chesterfield Inlet (Government of Nunavut, 2016). No known records of the success of these test fisheries are available at the time of this writing. Coral Harbour community members have also jigged for Snow Crab. Footnote 15 The Chesterfield Inlet community believes that commercial fishing can be a key sustainable economic opportunity, now, and in the future, as highlighted in the community’s economic development plan (Canadian Ecotourism Services, 2023).
An interview with a Mr. Voisey was conducted by DFO, Resource Management, Arctic Region. Mr. Voisey was a participant of the Chesterfield Inlet Scallop test fishery of the mid 1990’s. In the interview he indicated that the program ran each summer for 3 years starting from July until September. The scallops were found all along where the ocean drops off, but the best harvesting location was 24 miles off Whale Cove at depths of 30-35 fathoms deep (55 to 64 m). He believes that there would be high abundance within the AOI as there are high concentrations of walrus within the area, however, no test fishing was conducted in the area due to high levels of sea ice. Throughout the efforts, average catch per tow was 21.8 kg, with 23 of 96 tows resulting in a catch of 40 kgs or greater (Keewatin Meat and Fish Ltd., 1994). Bycatch was limited to:
- worms
- sculpins
- unidentified gray fish
- cod
- unidentified small fish
- yellow and green sea peaches
- sea cucumbers
Mr. Voisey identified a lot of sea cucumbers were caught off Marble Island. When asked about current interest of this fishery, he mentioned that there is some within the community who would wish to harvest scallops, however, it is cost prohibitive to start (requirement for a large boat and expensive pots).
It is noted that mobile bottom contact fishing gears are part of the MPA Protection Standard announced in 2019, with scope clarified in 2023 Footnote 16. The clarified scope includes both general and specific exemptions, and the application of the MPA Protection Standard to the Southampton Island AOI potential future MPA is beyond the scope of this socio-economic overview, but will be developed and made clear in the phase of outlining the MPA design, meaning, in the MPA Proposal, which is informed by the socio-economic overview report and other assessments of the area.
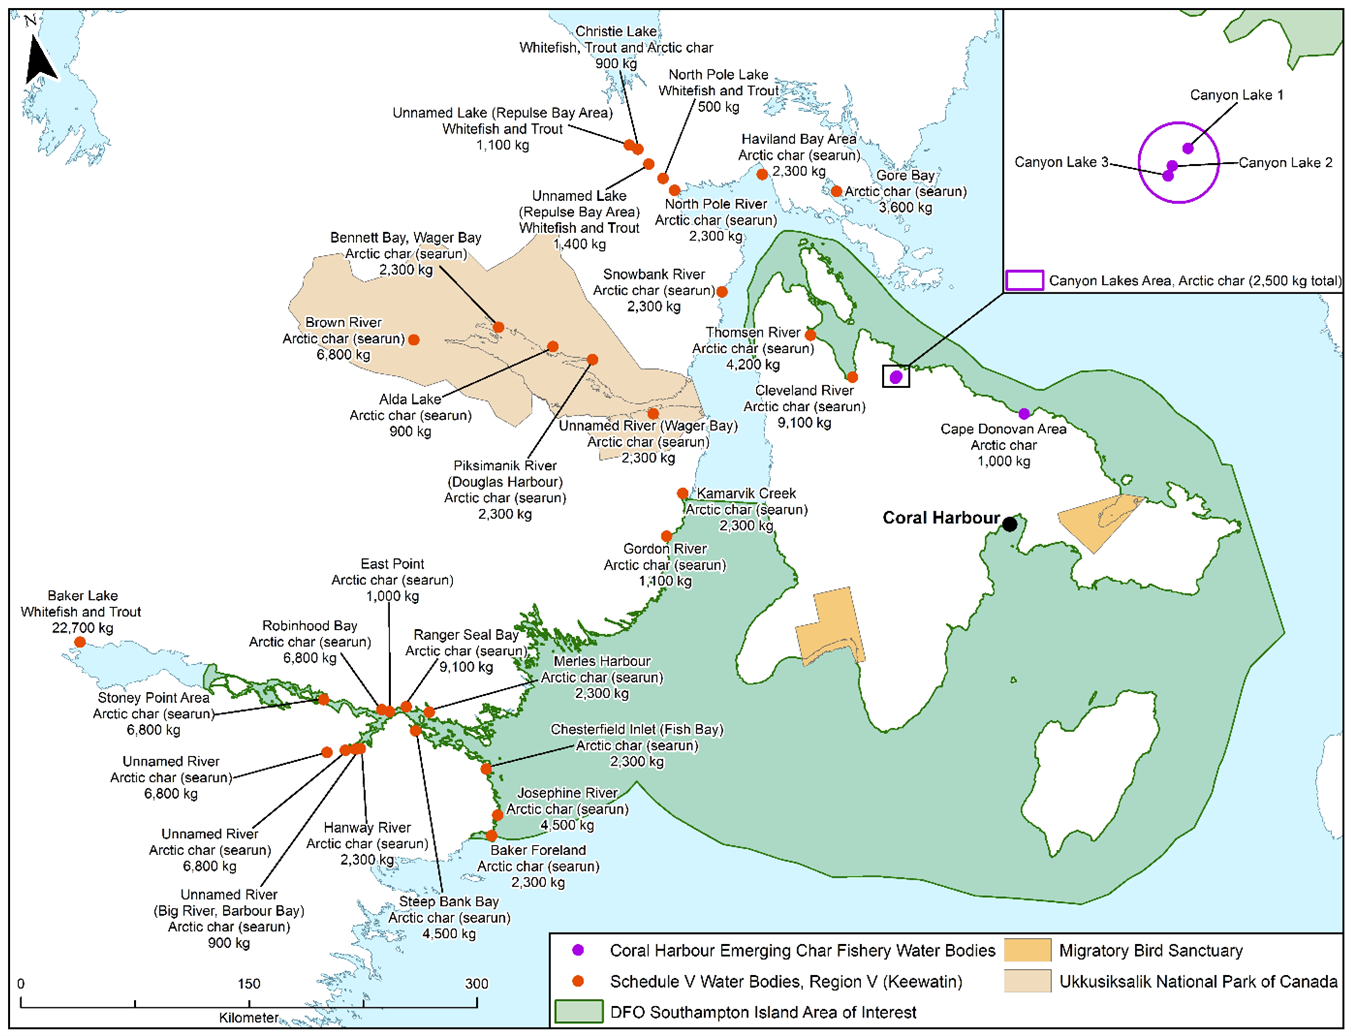
Figure 1: Arctic char quotas within the Southampton AOI, January 2020
Source: DFO Arctic Region, Marine Conservation and Planning and GIS programs
Long description
Locations of Southampton AOI sectors and Arctic char quotas.
- Canyon Lakes Area (including Canyon Lake 1, 2 and 3), Arctic Char, 2,500 Kg total
- Christie Lake, Whitefish, Trout and Arctic Char, 900kg
- Unnamed Lake (Repulse Bay Area), Whitefish and Trout, 1,100kg
- North Pole Lake, Whitefish and Trout, 500kg
- Haviland Bay Area, Arctic Char (Searun), 2,300 Kg
- Gore Bay, Arctic Char (Searun), 3,600 Kg
- Unnamed Lake (Repulse Bay Area), Whitefish and Trout, 1,400 Kg
- North Pole River, Arctic Char (Searun), 2,300 Kg
- Snowbank River, Arctic Char (Searun), 2,300 Kg
- Bennett Bay, Wager Bay, Arctic Char (Searun), 2,300 Kg
- Brown River, Arctic Char (Searun), 6,800 Kg
- Alda Lake, Arctic Char (Searun), 900 Kg
- Unnamed River (Wager Bay), Arctic Char (Searun), 2,300 Kg
- Piksimanik River (Douglas Harbour), Arctic Char (Searun), 2,300 Kg
- Thomsen River, Arctic Char (Searun), 4,200 Kg
- Cleveland River, Arctic Char (Searun), 9,100 Kg
- Cape Donovan Area, Arctic Char, 1,000 Kg
- Coral Harbour Kamarvik Creek, Arctic Char (Searun), 2,300 Kg
- Gordon River, Arctic Char (Searun), 1,400 Kg
- Merles Harbour, Arctic Char (Searun), 2,300 Kg
- Ranger Seal Bay, Arctic Char (Searun), 9,100 Kg
- East Point, Arctic Char (Searun), 1,000 Kg
- Robinhood Bay, Arctic Char (Searun), 6,800 Kg
- Baker Lake, Whitefish and Trout, 22,700 Kg
- Stoney Point Area, Arctic Char (Searun), 6,800 Kg
- Unnamed River, Arctic Char (Searun), 6,800 Kg
- Unnamed River, Arctic Char (Searun), 6,800 Kg
- Unnamed River (Big River, Barbour Bay), Arctic Char (Searun), 900 Kg
- Hanway River, Arctic Char (Searun), 2,300 Kg
- Steep Bank Bay, Arctic Char (Searun), 4,500 Kg
- Baker Foreland, Arctic Char (Searun), 2,300 Kg
- Josephine River, Arctic Char (Searun), 4,500 Kg
- Chesterfield Inlet (Fish Bay), Arctic Char (Searun), 2,300 Kg
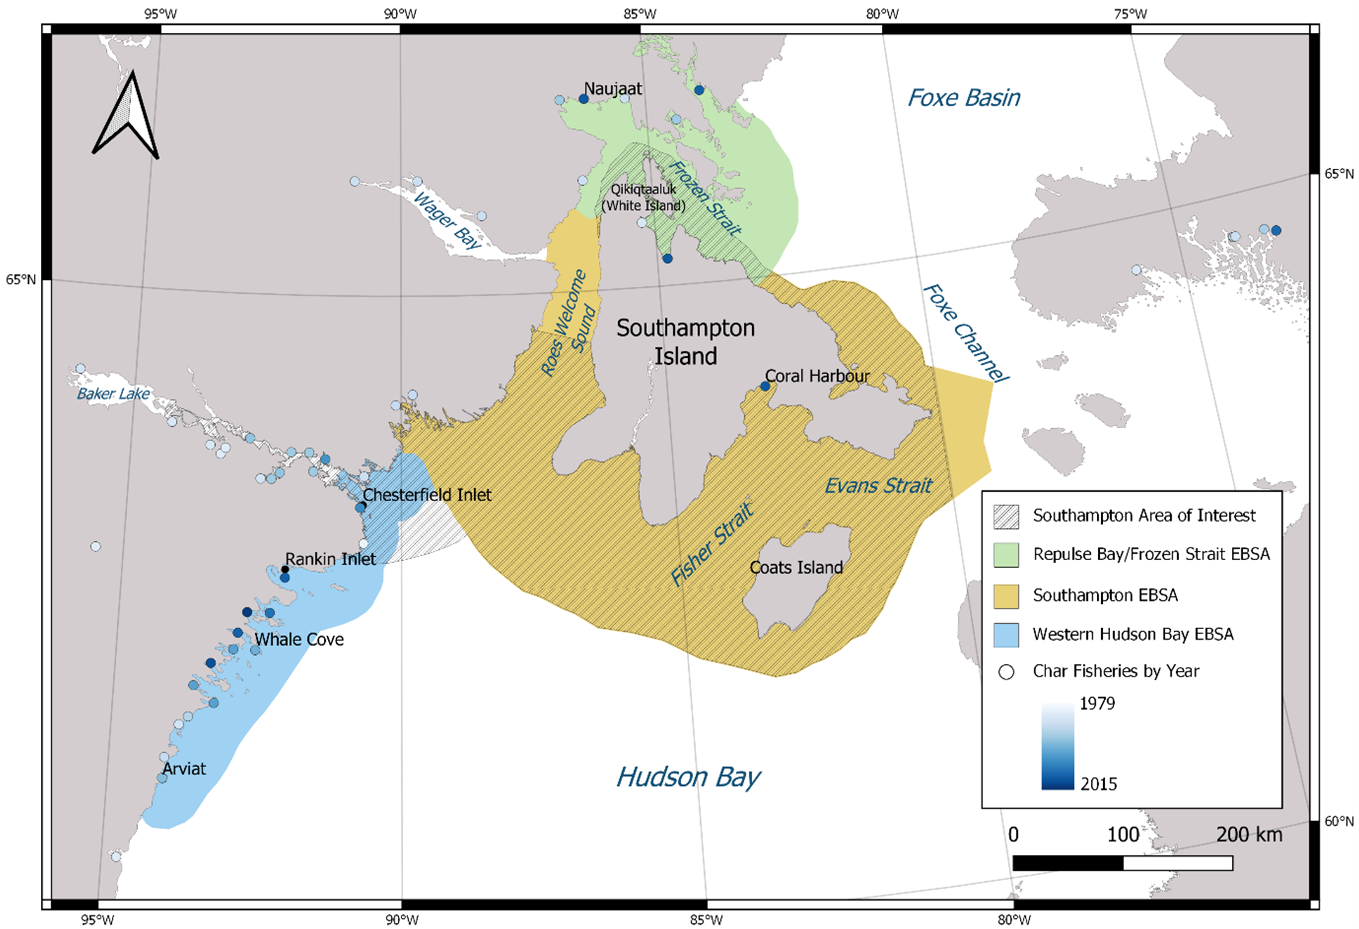
Figure 2: Southampton Area of Interest and EBSAs.
Source: Arctic char Fisheries by Year Source: Fisheries and Oceans Canada, Ecosystems and Oceans Science, Ontario and Prairie Region, 2020.
Long description
This map focuses on the area surrounding Southampton Island and the western Hudson Bay, with a north arrow pointing up.
- Geographical Layout (Top to Bottom):
- The top-center-right area is Foxe Basin.
- The top-left area is Baker Lake.
- Naujaat is an eastern community in the north.
- Southampton Island is the central geographical feature. Coral Harbour is on its eastern side.
- Coats Island is southeast of Southampton Island.
- On the mainland to the west: Wager Bay is in the upper area, and communities from top to bottom include Chesterfield Inlet, Rankin Inlet, Whale Cove, and Arviat.
- The southern area of the map is Hudson Bay.
- Legend and Overlap Descriptions:
- The Southampton Area of Interest is outlined in a dashed black line and filled with a diagonal gray hatch pattern, covering Southampton Island and a large surrounding body of water.
- The Repulse Bay/Frozen Strait EBSA (Ecologically Significant Area) is a light green area immediately north of Southampton Island, in Frozen Strait.
- The Southampton EBSA is a solid yellow-orange area encompassing the southwestern part of Southampton Island and the waters around Fisher Strait and Evans Strait.
- The Western Hudson Bay EBSA is a light blue area along the western mainland coast, from Wager Bay down past Arviat.
- Overlap: The Southampton Area of Interest (gray hatch) overlaps with the Southampton EBSA (yellow-orange) across a large central area.
- Char Fisheries by Year are plotted as small circles, with the color gradient from 1979 (light blue/empty) to 2015 (dark blue/full), showing clusters of activity along the Western Hudson Bay EBSA coast, especially near Whale Cove and Arviat.
Subsistence harvesting
Where the Government of Canada is responsible for implementing obligations under Land Claims Agreements or self-government agreements, Oceans Act MPAs will be implemented in a manner consistent with those obligations. Unless for a valid conservation purpose, public health or safety, or other treaty-based reasons, an MPA will not interfere with Inuit harvesting rights set forth by the Nunavut Agreement.
Key aquatic species harvested within the AOI include:
- Arctic char
- seals
- beluga
- narwhal
- walrus
- bowhead Footnote 17
Food insecurity is a major concern in Nunavut: compared to the national average it is 8 times higher in the territory (Council of Canadian Academies, 2014). Subsistence harvesting provides an arguably healthier, food option relative to food purchased in a grocery store (Chan et al., 2006). However, it was found that Country foods are expensive to acquire relative to store-bought foods – this is due to the increased costs of equipment (gas, guns, ammunition, and transport) and that store-bought foods are subsidized by national taxpayers, while country foods costs fall directly on the individual hunter or immediate family (Hoover et al., 2016). Traditional food costs may be less expensive than market bought food if (1) the harvester has hunting supplies and equipment and/or (2) if community members share harvesting costs or receive free food – in these situations the use of traditional food stretches income allowing families to spend their limited income on other necessities that would otherwise be spent on store bought groceries (Chan et al., 2006). The benefits of Nunavut’s country food economy are valued at more than $200 M a year (Awan et al., 2023). To help combat high food costs, Arctic communities such as Chesterfield Inlet and Coral Harbour can access the subsidy program, Nutrition North Canada.
However, it was found that this subsidy isn’t adequately addressing high food costs, it hasn’t addressed the quality of perishable foods and subsequent food waste, and that there is a lack of clarity regarding the program objectives (Canadian Ecotourism Services, 2023). Hoover et al., (2016) also notes that there a general lack of awareness when it comes to food subsidy programs and often individuals who could benefit are not able to.
Even with the importance and a desire for country foods, the advancement in technologies have increased the costs for equipment used in hunts, ultimately putting more strain on Inuit hunters and communities. It is estimated that capital start-up costs for seasonal hunters in Nunavut have been estimated between $20,000 to $30,000 and an all-season hunting outfit can cost upwards of $70,000 (Awan et al., 2023). Harvesters from Coral Harbour noted the importance of transportation in their subsistence efforts, utilizing boats when sea ice permits, snowmobiles when ice and snow permits, and occasionally their all-terrain vehicles throughout the year.
For hunting beluga and narwhal, it was determined that the greatest costs are access to boats, followed by fuel, guns, and then ammunition (Hoover et al., 2013) Footnote 18. This concern with increasing costs of subsistence hunts was noted by community members during SHI AOI consultations (Fisheries and Oceans, 2022 and Fisheries and Oceans 2023a). However, to support the harvest, distribution, and consumption of traditional foods, often communities will purchase harvested animals from local hunters – as an example, in 2015/16, the Hamlet of Chesterfield Inlet paid $30,000 to hunters for harvesting food (Canadian Ecotourism Services, 2023). To support communities, as of the time of the writing of this report, Calm Air, a regular air transport provider within the Kivalliq, offers free shipping across their scheduled serviced routes to send and/or receive country foods to other communities within the Kivalliq Region (Calm Air, website); this includes:
- shipment of caribou
- muskox
- duck
- Ptarmigan
- beluga
- Arctic char/fish
- seal
- polar bear
In addition, Canadian North, another airline that operates in Nunavut, offers a rate of $1.31/kg plus taxes to ship country food across all routes the airline operates.
In consulting community members from Coral Harbour, one individual highlighted the seasonal harvest cycle of the community. In the spring, the focus is on egg picking, cod fishing and sealing. During the summer months the focus shifts to marine mammal harvesting. In the fall, the community’s attention turns to fishing and caribou hunts and in the winter the focus is on:
- fish
- seals
- foxes (DFO, 2022)
Community members from Chesterfield Inlet, had said that about 50% of meals consisted of country food (Newell, 2018). It was also observed that preferences varied across the community, finding that younger generations are eating more store-bought food and even older generations are eating less country foods than when they were younger. Furthermore, it was also to note that country foods provide a cultural value that is more challenging to quantify – the community survey found that country food made community members:
- feel warm and relaxes their bodies
- caused less stress
- made them feel more full
- reduced bloating
- decreased stresses caused by food insecurity (Newell, 2018 and DFO, 2022)
The harvest statistics reported below (Annex 4) are by community, not by the geographical borders of the AOI. While these harvest statistics may be an overestimation of the harvests that take place within the AOI, these may be relevant, because the Southampton Island EBSA is a migration corridor for beluga, bowhead, and narwhal as they move between overwintering areas in Hudson Strait, Labrador Sea, and Ungava Bay to coastal waters of Western Hudson Bay and/or regions near Repulse Bay, Lyon Inlet, Foxe Basin, and Frozen Strait. This approach was used to attempt the proxy estimate of harvests quantitatively within the AOI, as opposed to having a qualitative discussion only. Due to data limitations the aforementioned approach was deemed to be most appropriate.
Narwhal
Narwhal have high economic, social, cultural, and nutritional significance for communities. The species is an important staple in the traditional subsistence economy. The ivory tusk of males has economic value and is an important source of cash income for some communities (DFO, 2011b).
Narwhal are a source of food for both humans and dogs, they provide a secondary source of income, and are a source of materials for day-to-day living. Narwhal meat is generally used as food for dogs but is also eaten by humans unless other meat is available. Narwhal are usually hunted for their:
- ivory
- skin
- blubber (mattaaq)
In addition to its protein and caloric value, skin is a highly valued food because of its richness in:
- vitamin C
- zinc
- retinol
- other essential nutrients (COSEWIC, 2004)
The gross edible weight values from narwhal landings estimated in this report are based on narwhal landings and the most recent edible weight estimates are found in Ashley (2002).
It should be noted that in general the food replacement value for the marine species in this report does not account for other benefits of subsistence harvests such as:
- improving individual and community health, food security
- strengthening social connections
- supporting cultural values and practices (Government of Nunavut, 2016)
The formula used to calculate the gross edible weight is as follows:
The gross edible weight value = landings x edible weights estimate (in kg per narwhal) x value of weight per kg Footnote 19
Ashley (2002) reported the lowest and highest edible weight estimates of narwhal of 191 kg and 595 kg, respectively. A number of factors give rise to the difference in edible weight values. For example, some of the studies consider only the edible weight estimates of mattaaq excluding meat and wastage.
Another key factor is the cultural variation in edibility. Unlike commercial meat harvest yields for non-traditional consumers, Indigenous tastes, and cultural preferences to consume non-meat parts and meat parts result in a higher yield. This study, therefore, considers the most recent Footnote 20 estimated value of edible weight reported by Ashley (2002). The edible weight estimates used in this study to estimate the total edible weights of narwhal landings is 496 kg per animal Footnote 21 (DFO, 2011b).
In the AOI, narwhal are often harvested from the area just north of Southampton Island, in the area around White Island and the Duke of York Bay (Figure 3). Narwhals that occur in the AOI belong to the Northern Hudson Bay population with the most recent abundance calculations estimating 19,232 individuals, less abundant than the genetically distinct Baffin Bay population (DFO, 2015 and Watt et al., 2020). From 2017 to 2021, the following communities reported a total harvest of 526 narwhal (see Annex 4):
- Arviat
- Baker Lake
- Chesterfield Inlet
- Coral Harbour
- Kinngait
- Naujaat
- Rankin Inlet
- Whale Cove
The large majority were harvested in Naujaat, which harvested a total of 460 narwhal, over a 5 year period:
- Arviat harvested a total of 1 narwhal
- Baker Lake 2 narwhal
- Chesterfield Inlet 15 narwhal
- Coral Harbour 27 narwhal
- Kinngait 0 narwhal
- Rankin Inlet 20 narwhal
- Whale Cove 1 narwhal
The average harvest per year for all communities combined was 105 narwhal. The narwhal quota for 2023 is a cumulative total of 147 for the Northern Hudson Bay Management Unit (NHBMU), which in addition to the above communities of:
- Arviat
- Baker Lake
- Chesterfield Inlet
- Coral Harbour
- Kinngait
- Naujaat
- Rankin Inlet
- Whale Cove and Kinngait
- the communities of Sanirajak
- Kimmirut
- Igloolik also harvest from the NHBMU (DFO, 2023b)
However, it is unknown how many of the NHBMU narwhal are directly within the AOI.
Using the NHBMU quota to determine total potential value of narwhal harvests within the AOI is challenging due to the stock being migratory and harvested by other communities, likely outside of the AOI. However, the following is an estimation of the edible weight value from harvests of communities in and around the AOI. A review of relevant literature found that 45% of edible weight of beluga may be used for human consumption and the remaining 55% may be used as dog food. Of the total edible weight:
- outer dermis, and skin (maktak) comprises 25%
- loin meat and flippers 40%
- organs and some blubber 35% (Symbion Consultants, 2009)
Using a food replacement or substitution cost approach, the value of the portion of edible weight used for human consumption was in the amount of $27.8/kg and the portion used as dog food was in the amount of $4.36/kg (Symbion Consultants, 2009 and DFO, 2017a). In the absence of information specific to narwhal, using the above approach, and an edible weight of 496 kg, it was estimated that the total gross edible weight value of harvest was in the amount of $4.63 M during the 5 years from 2017-21 ($0.93 M per year). Footnote 22
The ivory tusk of the narwhal is also a valuable commodity and an important source of cash income for some coastal communities (DFO, 2011b). It was reported that the average tusk length of narwhal killed in 2009 was 168.5cm (5.53 feet). A tusk of that size, with an intact tip, has an estimated value of almost $1000 (DFO, 2017a). Based on 2013-14 receipts received by DFO for narwhal tusks harvested primarily in Repulse Bay and Floe Edge and purchased by Naujaat Co-op, Taqqut Co-op, and the Repulse Bay Northern Store, the average tusk length of narwhal was 5.22 feet. A tusk of that size has an estimated value of $633.
Utilizing an average of these 2 price proxies Footnote 23 in conjunction with reported tusk quantities between 2013 and 2017 Footnote 24, and when adjusting for inflation Footnote 25, the sale of narwhal tusks yielded an average annual income of $265,000. Other sources vary on price when assessing the sale of narwhal tusks – in 2008, Repulse Bay hunters were paid $100 per foot for tusks up to 6 feet long plus $15 per inch for every extra inch (Hoover et al., 2013).
Beluga
The harvesting and consumption of beluga has provided social, cultural, health and economic benefits to communities since time immemorial (Symbion Consultants, 2009).
Populations of Beluga are found in:
- Hudson Bay Strait Complex
- Western Hudson Bay (WHB)
- Eastern Hudson Bay
- James Bay
- Cumberland Sound
- Belcher Islands (Parent et al., 2023)
The COSEWIC WHB designatable unit Footnote 26 has an approximate size of 54,473 animals (Matthews et al., 2017) and is the population that is found within the AOI. Some belugas remain in the AOI throughout the summer until they migrate back out beyond the AOI in early to late September at which point they are joined by larger numbers returning from western Hudson Bay. During their occupation of the AOI belugas feed and migrate along the southern part of Southampton Island in Fisher and Evans Straits including South Bay, and have been spotted around Duke of York Bay, East Bay, Gordon Bay, and from Junction Bay to Allinataaq Lake (Loewen et al., 2020a, b and Idlout 2020). East Bay, Duke of York Bay, and possibly Roes Welcome Sound are calving grounds for these animals (Idlout 2020). The recommended Potential Biological Removal Footnote 27 estimate for WHB belugas would be 753 animals with a recovery factor of 0.75 (DFO, 2018). However, harvesting beluga from the WHB is not limited by quotas (Hammill et al., 2017).
From 2017 to 2021, the communities of Arviat, Whale Cove, Coral Harbour, Chesterfield Inlet, Baker Lake, Rankin Inlet, Naujaat and Kinngait reported a total harvest of 1,284 beluga (see Annex 4). Total of harvested belugas over a 5 year period in :
- Arviat 360 beluga
- Baker Lake 11 beluga
- Coral Harbour 206 beluga
- Chesterfield Inlet 36 beluga
- Kinngait 85 beluga
- Naujaat 77 beluga
- Rankin Inlet 306 beluga
- Whale Cove 203 beluga
The average harvest per year for all communities was 257 beluga. Using the formula and beluga information mentioned above, and an edible weight of 378 kg per animal (Symbion Consultants, 2009), it was estimated that the total edible weights value of harvest was in the amount of $8.51 M during the 5 years from 2017-21 ($1.7 M per year). Footnote 28
Walrus
Inuit harvest Atlantic walrus. They are highly valued as a traditional source of food and other products. Communities hunt walrus for its meat, ivory tusks and baculum. Molluscs found in walrus stomachs are considered delicacy in Inuit communities (DFO, 2017b). The Inuit hunt provides opportunities to maintain cultural traditions and for experienced hunters to pass on their skills and knowledge to younger generations. The tusk and baculum of the Atlantic walrus are valuable economic commodities and provide important sources of cash income, particularly, for the hunting communities (DFO, 2013a). Walrus ivory is either sold raw or carved into fine art pieces such as jewelry or sculptures. Some communities engage in a small-scale sport hunt conducted by non-Inuit hunters (DFO, 2017b).
Atlantic walrus are managed via Management Units. The Management Unit that is found in the AOI is the Hudson Bay-Davis Strait stock (HBDS) (AW-05). The HBDS has been distinguished from 5 other stocks based on:
- distances
- movements
- differences in growth patterns
- differences in genetics, contaminants, and lead isotope ratios (DFO 2002, COSEWIC 2006, and Stewart 2008)
Results from 2017 aerial surveys have determined that the HBDS Sock has a total abundance of 12,100 animals (Mosiner et al., 2023). The Potential Biological Removal estimate for the HBDS stock is 360, assuming a Recovery Factor of 1 (Mosiner et al., 2023). Walruses occur in the AOI year-round, undertaking primarily local movements around Southampton Island. Known terrestrial haul-out locations within the AOI boundary include islands in Fisher and Evans Straits (meaning, Bencas, Coats, and Walrus Islands) and the south coast of Southampton Island, NW Southampton Island, and Depot Island near Chesterfield Inlet. They are known to occupy mobile pack ice and polynyas in Roes Welcome Sound and at the mouth of Chesterfield Inlet in the winter. It is to note that this stock is shared as it occurs in both the Nunavut Settlement Area and the Nunavik Marine Region (DFO, 2013a) and extends to the East of Baffin Island. A community quota of 60 walruses per year has been allocated to Coral Harbour (DFO, 2013a). The number of walrus Sport Hunt licences is reviewed and determined by the Nunavut Wildlife Management Board (NWMB) based on the number of applicants (see Annex 7 for number of licences issued by the NWMB).
From 2017 to 2021, the communities of Arviat, Baker Lake, Chesterfield Inlet, Coral Harbour, Kinngait, Naujaat, Rankin Inlet, and Whale Cove reported a total harvest of 248 walrus Footnote 29 (see Annex 4). The average reported harvest per year for all communities combined was 50 walrus. Utilizing the previous edible weight methodology for narwhal and beluga as a proxy, and an edible weight of 462 kg per animal (Loring, 1996 and Ashley, 2002), it was estimated that the total edible weight value of harvest was in the amount of $2.03 M during the 5 years from 2017-21 ($0.41 M per year). Footnote 30
Bowhead
Bowhead provides significant subsistence values to Arctic communities, particularly, those involved in hunting. Bowhead is hunted for its meat and as a source of materials for hunting and daily living (DFO, 2013b). In addition to providing maktak, blubber was also traditionally harvested from bowhead, and used as a food source, medicine, and as a source of oil for heating and lighting. Bones were used for tools, house and tent frames, sled runners, kayak and sled frames, and carving. Bowhead hunting was important aspect of Inuit culture, and many Inuit are worried about the loss of the knowledge and cultural impact from the former ban on bowhead hunts. Footnote 31 As such, they wished to renew bowhead hunts and involve youth in them, and once again make use of maktak and bowhead bones, however, some do not think bowhead hunting remains relevant. It was generally thought that bowhead hunting should be carefully and properly managed to ensure numbers continue to increase (Hay et al., 2000).
While bowhead numbers declined due to commercial whalers in the early 1900’s, Inuit observers noticed an increase in bowhead in the latter years of the 20th century, including in Hudson Bay in and near the AOI, due to a whaling ban and Inuit voluntarily forgoing their hunting rights. Coral Harbour community members had informed the NWMB that bowhead are regularly seen in late summer and autumn at 2 locations, Aqiarunnaq/Duke of York Bay, and the Bell Peninsula of southeastern Southampton Island (Hay et al., 2000). Inuit observers are divided on whether snowmobiles and small watercraft disturb bowhead, although generally they believe it disturbs them less than beluga and narwhal. There are worries that large vessel traffic, oil spills, and hunting may disturb them (Hay et al., 2000).
The bowhead population that is harvested by the communities in and around the AOI is the Eastern Canada-West Greenland (EC-WG) population. The fully adjusted abundance estimate for the EC-WG population was 6,446 (Doniol-Valcroze et al., 2020 and Higdon et al., 2023). The current Total Allowable Harvest for EC-WG whales within Nunavut is 5 whales per year with 2 whales allocated to the Kivalliq and Qikiqtaaluk Regions and 1 for the Kitikmeot Region (Nunavut Wildlife Management Board, 2015 and Higdon et al., 2023). DFO and partners are currently exploring the possibility to allow for an approach that would allow Inuit to carry over unfilled annual EC-WG quota to subsequent harvest seasons (Higdon et al., 2023); Higdon et al. (2023) had found that this approach was sustainable, this research is a first step in co-management discussions on establishing a carry-over system
From 2017 to 2021, the communities of Baker Lake, Chesterfield Inlet, Coral Harbour, Kinngait, Naujaat, Rankin Inlet, Arviat, and Whale Cove harvested a total of 6 bowhead:
- Coral Harbour harvested 3 bowhead
- Naujaat harvested 2
- Baker Lake had harvested 1 (Annex 4)
Bowhead harvests are relatively rare compared to other marine mammals, but due to their large size, they can provide a significant amount of meat and materials even when harvested in limited numbers.
There is no accepted methodology to calculate the edible weight of bowhead whales, however, as a proxy, the following values are based on the methodologies used previously. Utilizing the harvest statistics, an edible weight of 31,500 kg (Whitford, 2006) it was estimated that the total edible weight value of harvest was in the amount of $3.39 M during the 5 years from 2017-21 ($0.68 M per year). Footnote 32
Arctic Char
Arctic char are harvested both for food and as a traditional social and cultural activity and are one of the most sought-after fishes for subsistence by Inuit. About 80% of Arctic char harvests are returned immediately to the domestic economy. Advantages of Arctic char as a source of subsistence include:
- predictable harvesting times and locations
- ease of catch
- quick growth
- relative absence of parasites
Subsistence fisheries are usually concentrated near communities and are traditionally harvested from well-developed estuarine and coastal fisheries with gill nets or weirs.
Arctic char is a healthy (meaning, typically low in contaminants such as mercury) (Evans et al., 2015) and nutritious subsistence food source available in every Nunavut community (Priest and Usher, 2004). Given the overall accessibility across Nunavut communities, limited resources required to harvest this species and the overall sharing culture within and among norther communities, Arctic char continues to underpin food security in the territory as it provides a high quality and reliable country food source. Footnote 33
For residents of Coral Harbour, anadromous Arctic char are an important food. In the study area, Arctic char are harvested from the Thomsen and Cleveland rivers in northwest Southampton Island. They are also harvested in Chesterfield Inlet and Daly Bay (Hurtubise, 2016; NCRI, 2014; Roux et al., 2011; Stewart and Lockhart, 2005). Most of the subsistence fishing for Chesterfield Inlet occurs during the fall upstream run near Josephine River. Footnote 34
The collection of data on subsistence harvests is limited due to the remote nature of the fisheries, lack of internet access while harvesting, and the harvests not being regulated (no requirement to report harvests). From 1996 to 2001 the annual average Arctic char harvest was:
- 4,262 fish in Arviat
- 552 fish in Baker Lake
- 2,481 fish in Chesterfield Inlet
- 6,658 fish in Coral Harbour
- 13,695 fish in Kinngait
- 4,283 fish in Naujaat
- 2,552 fish in Rankin Inlet
- 1,223 fish in Whale Cove (Priest and Usher, 2004)Footnote 35 (see Annex 4)
Priest and Usher (2004), estimated that the food replacement value for char harvested for subsistence value across all Nunavut was about $5 M, adjusting this value for inflation, this value in 2022 would be $7.54 M. Footnote 36
Seal
Seal (ringed, bearded, harbour, hooded, and harp) are harvested and used for food, clothing, and arts and crafts. Seal continues to be a valuable and preferred food source for Inuit. The cash value of seal skins as by-products of the hunt is critical to hunters for financing the subsistence hunt. This money is used to purchase harvesting supplies and other necessary equipment. Seal hunting has always been an important foundation of Inuit culture and it sustains traditional sharing customs. Seal hunting also provides a unique knowledge of the seal resource and ecosystem, and the passing of skills and values from elders to youth. It is estimated that 40,000 seals are harvested per year in Nunavut (Government of Nunavut, 2021b). The replacement food value of seal meat is worth about $5 M, and Seal skin products are worth an added $1 M to the arts and crafts sector (Nunavut DEIA, unknown).
From 1996 to 2001 the annual average seal harvest in:
- Arviat was 452 seals
- Baker Lake 3 Seals
- Chesterfield Inlet 104 seals
- Coral Harbour 824 seals
- Kinngait 1,148 seals
- Naujaat seals 433
- Rankin Inlet 191 seals
- Whale Cove 56 seals (Priest and Usher, 2004) Footnote 37 (see Annex 4)
As most seals harvested from 1996 to 2001 were ringed seals and no recent data being available, the following estimated edible weight value utilizes ringed seals harvested from 1996 to 2001 as a proxy for all seals harvested Footnote 38. An edible weight of 74 lb. (33.57 kg) (Magdanz et al., 2010) was used. The total estimated edible weight value of harvest was in the amount of $8.84 M during the 5 proxy years ($1.8 M per year) Footnote 39.
Polar Bear
Polar bear continue to hold a position of significant cultural importance to Inuit. Inuit harvest polar bears for their meat, hide, and for tradition and economic benefits, such as income for guides and trophy exports. A 2009 study estimated the annual polar bear trophy tag revenue value for Coral Harbour was $169,000 (Government of Nunavut, 2009). The harvest of a hunter’s first bear is a momentous milestone in a hunter’s life (Co-Management Working Group, 2016).
Co-management partners (Nunavut Tunngavik Inc., NWMB, Regional Wildlife Organizations, Hunters and Trappers Organizations and Government of Nunavut – Department of Environment) work together to determine a total allowable harvest (TAH) for each polar bear subpopulation. Polar bears are classified as ‘presumption as to needs species’ in the Nunavut Agreement, which means the total allowable harvest is allocated to Inuit. Inuit may allocate a portion of the TAH for sports hunts. All bears harvested, whether for subsistence purposes, sports hunts or the Defence of Life and Property Kills (DLPK), are subtracted from the TAH (Co-Management Working Group, 2016). In 2016, communities in the Kivalliq Region expressed concern with the rise in DLPK regarding polar bears – stating that the increase in DLPK reduces the opportunity for hunting tags, reduced knowledge of polar bear hunts to the next generation, and the subsequent challenge to maintain traditions (Zerehi, 2016a).
Inuit are directly affected by increased polar bear abundance from the standpoint of personal safety and property damage (for example, lodging and food caches). Inuit store meat in traditional caches, both within small camps and communities. The loss of nutritious food due to polar bears raiding the caches is a significant cost to Inuit (Co-Management Working Group, 2016).
Globally, all polar bears are divided into 19 “subpopulations”; there are 12 recognized subpopulations of polar bears within Nunavut. The range of Foxe Basin polar bears occurs both within and outside the AOI, and the range of Western Hudson Bay polar bears is adjacent to the AOI (Co-management Working Group, 2016). Coral Harbour harvests from the Foxe Basin subpopulation of polar bears. The community had an allocation of 44 bears for 2017-18 (Government of Nunavut, 2018), and 44 were harvested, 22 in the subsistence hunt, 20 in the sport hunt, and 2 for DLPK. Chesterfield Inlet harvests from the Foxe Basin subpopulation and from the Western Hudson Bay subpopulation. The community had an allocation from Foxe Basin of 5 polar bears for 2017-18, and 2 were harvested in the subsistence hunt. Chesterfield Inlet also had an allocation from the Western Hudson Bay subpopulation of 4 polar bears for 2017-18, and 1 was harvested in the subsistence hunt. Baker Lake, Kinngait, Hall Beach, Igloolik, Kimmirut, and Naujaat also harvested from the Foxe Basin subpopulation, while Arviat, Rankin Inlet, and Whale Cove harvested from the Western Hudson Bay subpopulation.
To estimate the edible weight value of the polar bear harvests of Coral Harbour, the following assumptions were made; an edible weight of 140 kg was used (Freeman and Wenzel 2006, Tyrrell 2006, and Wenzel 2008), a replacement food value for human consumption of $31.99, and 100% of edible weight being consumed by human Footnote 40. The total estimated edible weight value generated by the 2017-18 harvests from Coral Harbour (44 polar bears) is about $257,000 Footnote 41. In addition to the edible weight value, polar bear pelts also provide significant income for Inuit hunters. Pelt values have ranged from an average of $895 in 2009 (ÉcoRessources Consultants, 2011) to an average of $5,164 in 2012 (Nunatsiaq News, 2012). The price of pelts is highly dependent on demand, quality of the pelt, and the size of the pelt. Applying this range to the Coral Harbour harvests, an approximate 2022 value of the sale of 44 pelts would be from $51,000 to $278,000.
Marine birds
Marine birds are also a key component to the lifestyle of the communities around the AOI. Birds are harvest for their meat, collection of eggs, and use of down in textiles and other goods. The AOI hosts large aggregations of sea birds such as 2 colonies of Thick-Billed Murres on Coats Island and the largest colony of Common Eiders in Nunavut (Loewen et al., 2020). The AOI overlaps with the marine portions of the East Bay (Qaqsauqtuuq) and Harry Gibbons (Ikkattuaq) migratory bird sanctuaries support bird colonies during the spring and the summer (Loewen et al., 2020). Priest and Usher (2004) found that geese, squaw, ptarmigan were relatively popular harvested species within the communities observed from 1996 to 2001. However, it is unknown whether the findings from Usher provide an accurate estimate of modern harvest of marine birds and eggs. Further assessment into community harvest of birds and eggs is required to values and cultural importance.
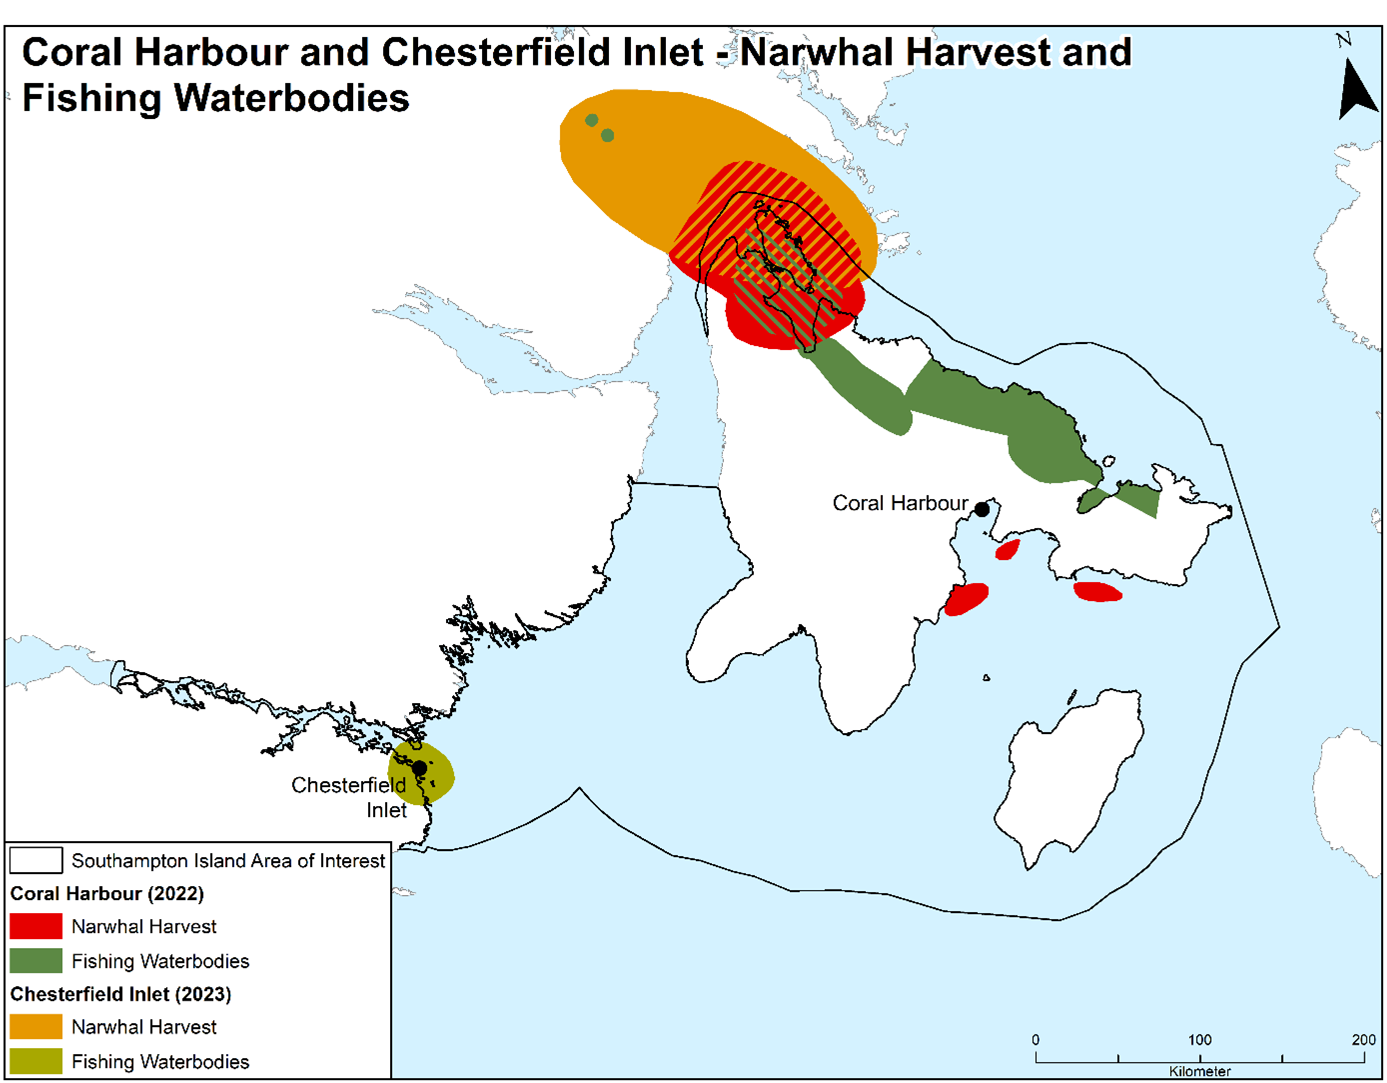
Figure 3: Narwhal and Fish Harvest within the Southampton Island AOI
Source: Digitized Map of Traditional Knowledge based on where Coral Harbour and Chesterfield Inlet resident’s harvests narwhal and fish for subsistence purposes. Information Provided to Fisheries and Oceans Canada through consultations with both communities.
Long description
This map focuses on the area around Coral Harbour and Chesterfield Inlet with a north arrow pointing up. The Southampton Island Area of Interest is outlined in a thin black line.
- Geographical Layout:
- The main water bodies are Coral Harbour (east side) and Chesterfield Inlet (west side).
- The map shows land in the center and to the left (west).
- Legend and Overlap Descriptions:
- Areas for Coral Harbour (2022) are shown in red.
- Narwhal Harvest (solid red) is shown as two small separate areas in the waters near Coral Harbour.
- Fishing Waterbodies (red diagonal hatch over solid red) is a large, irregularly shaped area north of the mainland peninsula, extending over the water.
- Areas for Chesterfield Inlet (2023) are shown in yellow/orange and green.
- Narwhal Harvest (solid yellow/orange) is a large area of water north of the mainland peninsula, west of the Coral Harbour Fishing Waterbodies. A small area is also shown near the entrance to Chesterfield Inlet.
- Fishing Waterbodies (solid dark green) is an elongated area of water extending from the mainland peninsula toward the east, between the Coral Harbour and Chesterfield Inlet areas.
- Overlap: A significant overlap occurs where the Coral Harbour (2022) Fishing Waterbodies (red hatch) intersects with the Chesterfield Inlet (2023) Narwhal Harvest (yellow/orange), creating a darker, cross-hatched region in the northern part of the map.
- Areas for Coral Harbour (2022) are shown in red.
- Source: Digitized Map of Traditional Knowledge based on where Coral Harbour and Chesterfield Inlet resident’s harvests narwhal and fish for subsistence purposes. Information Provided to Fisheries and Oceans Canada through consultations with both communities.
Resource extraction
Mining and mineral exploration
The following section is related to the socio-economic activities relating to mineral exploration, mining, and supporting infrastructure surrounding the AOI. These activities are key economic drivers for the Kivalliq Region and are heavily reliant on marine transport through/around the AOI. As such, MPA design must consider this valuable economic sector throughout the MPA designation process to ensure that economic growth can continue.
The Kivalliq Region of Nunavut covers 445,109 km². It is terrestrially adjacent to Manitoba to the south and the Kitikmeot Region and the Northwest Territories to the west, and the Hudson Bay to the east, which includes Southampton Island and the AOI. The diverse geology of the Kivalliq Region contains a number of significant mineral occurrences and deposits, including:
- historical and current resources in gold
- uranium
- diamonds
- nickel
- platinum group
- rare earth elements.
The region has a long history of mining and hosted 2 of Canada’s first mines north of 60° latitude:
- the North Rankin Nickel Mine, which operated from 1957 to 1962
- the Cullaton-Shear Lake gold mine, west of Arviat, which operated in the early 1980s (Canada-Nunavut Geoscience Office, 2022)
Mining provides significant socioeconomic benefits to the territory, in 2020, mining, quarrying, and oil and gas exploration made up 40.4% of Nunavut’s GDP by industry (Statistics Canada, 2023). As of November 2022, there were:
- 1,116 mineral claims
- 186 mineral leases
- 26 prospecting permits (Canada-Nunavut Geoscience Office, 2022)
This represents a slight decrease from 2018 where there were:
- 1,203 mineral claims
- 165 mineral lease
- 31 prospecting permits (Canada-Nunavut Geoscience Office, 2018)
There are no active mining projects in the Southampton Island AOI. However, there has been recent exploration activity and active mining efforts inland near Baker Lake. Gold continues to be the main exploration target in the region with a recent significant increase in Ni-Cu-Co-PGE Footnote 42 exploration (Canada-Nunavut Geoscience Office, 2022). These exploration and mining activities may have direct and indirect impacts on the AOI and as such will be explored. It is to note that no known seabed mining activities has occurred within the Hudson Bay Basin.
Summary of mineral exploration and mining activities within the Kivalliq Region
There is potential for mineral deposits on Southampton Island and some exploration activities have previously occurred on the island.
In February 2009, Anglo American Exploration (Canada) Ltd. acquired 19 prospecting permits on Southampton Island. The permits were for:
- nickel
- cobalt
- copper
- platinum
- palladium
Additionally in February 2009 Vale Inco Limited acquired 3 prospecting permits on Southampton Island, also for nickel, cobalt, copper, platinum, and palladium (Canada-Nunavut Geoscience Office, 2009). Neither organization has progressed further regarding these permits. Based on analysis and preliminary data from field work in 2013, it was suggested that high calcium limestone occurs in the Ekwan River Formation on western Southampton Island (Canada-Nunavut Geoscience Office, 2013). According to the 2013 Nunavut Mineral Exploration, Mining and Geoscience Overview, “This new discovery could stimulate the development of Nunavut’s first industrial limestone quarry.” In 2014, Natural Resources Canada, published a detailed geological map of Southampton Island. This mapping suggests there could be economic interest for palladium-platinum, gold, base metals, and carving stone (Sanborn-Barrie et al., 2014).
Even though there are no active mining projects or licences within the Southampton Island AOI, the land-based mining activities adjacent to the AOI have various socio-economic impacts on the area itself. These inland mines located on the mainland require regular resupply efforts via marine vessels that often traverse near, or through, the AOI. Agnico Eagle’s Meadowbank/Whale Tail, and Meliadine mines operate nearby, and resupply efforts travel through the AOI and are supplied through Baker Lake and Rankin Inlet (Melvin Bay), respectively. Baffinland’s Mary River Mine resupply efforts passes near the eastern border of the AOI. These mines also provide other socio-economic impacts on the AOI including:
- economic production
- employment
- training
- taxes
- spinoff benefits (local tourism and more accommodations, food and beverage, flights, taxis, etc.)
- improvements to local infrastructure
The following information represents mining activities near the AOI that may be impacted by either vessel activities or socioeconomic impacts from said mining or exploration activities.
ProductionFootnote 43
- Agnico Eagle Mines Limited, Meadowbank gold mine (North of Baker’s Lake, NU) – Gold Footnote 44
- Agnico Eagle Mines Limited, Amaruq property (Whale Tail mine) (North of Baker’s Lake, NU) – Gold
- Agnico Eagle Mines Limited, Meliadine gold mine (North of Rankin Inlet, NU) – Gold
- Baffinland Iron Mines Corporation, Mary River Mine, (North Baffin Island, NU) – Iron
Exploration Footnote 45
- BG Gold Capital, Pistol Bay project (Southwest of Ranking Inlet, NU) – Gold Footnote 46
- Kodiak Copper Corp. (formerly Dunnedin Ventures Inc.), Kahuna Project (Southwest of Chesterfield Inlet, NU) – Diamond Footnote 47
- Solstice Gold Corporation, Qaiqtuq (formerly the Kahuna Gold Project) (Southwest of Chesterfield Inlet, NU) – Gold Footnote 48
- Auryn Resources Inc., Gibson MacQuoid (West of Rankin Inlet) – Gold.
- Agnico Eagle Mines Limited, Cone Hill, Parker, Peter, and Fox Lakes (Northwest of Rankin Inlet, NU) – Gold Footnote 49
- Agnico Eagle Mines Limited and Gold79 Mines Limited, Greyhound (North of Baker Lake, NU) – Gold, Silver, Zinc, Copper and Lead
- Agnico Eagle Mines Limited, Meadow River project (North of Baker Lake, NU) – Gold Footnote 50
- North Arrow Minerals Inc. Burgundy Diamond Mines Ltd, Naujaat Sampling (Northeast of Naujaat, NU) – Diamonds
- Canadian North Resources Inc., Ferguson Lake (South of Baker Lake, NU) – Palladium, Platinum, Rhodium, Copper, Nickel, Cobalt
- ValOre Metals Corp. (formerly Kivalliq Energy Corp.), Angilak (Southwest of Baker Lake, NU) – Uranium
- Forum Energy Metals Corp., Nunavut Uranium (West of Baker Lake, NU) – Uranium
- Orano Canada (formerly AREVA Resources Canada), Kiggavik and St. Tropaz (West of Baker Lake, NU) - Uranium
Production
Agnico Eagle Mines Limited has substantial mining operations near the AOI. Agnico Eagle fully owns and operates 2 of the largest mines in Nunavut (Meliadine mine and the Meadowbank complex). As per the Nunavut Agreement, Article 26, to be able to operate on Inuit owned lands, Agnico Eagle, and other mining projects, are required to negotiate and sign an Inuit Impact and Benefit Agreements (IIBA). As examples, the IIBAs signed by the Kivalliq Inuit Association and Agnico Eagle Mines Limited stated that the purpose and objectives of the IIBA, are to provide benefits and address detrimental impacts on Inuit arising out of the development project, and to ensure that the way in which the project is constructed and operates respects the Inuit traditional way of life, language and culture, and to promote and maintain Inuit economic and social development; also, that both parties agree that their respective obligations will be fulfilled with a view to maximizing benefits for Inuit and Inuit Firms in the mining projects through participation in business opportunities, employment and training and by providing financial compensation and limiting or mitigating impacts of the mining projects (Kivalliq Inuit Association and Agnico Eagle Mines Limited, 2017a and 2017b).
Agnico Eagle is the sole owner of the Meliadine Mine which has a property size of 98,222 hectares. Through the IIBA signed, Agnico Eagle Mines Limited and the Kivalliq Inuit Association will work together to achieve a goal of 50% Inuit employment (Agnico Eagle Mines Limited website). Commercial production of the Meliadine began in May 2019. The mine includes both open-pit and underground operations. In 2022, Meliadine had a total gold production of 372,874 oz. As of December 2023, the mine is believed to have a gold reserve of 3,766,000 ounces with an expected mine life of 2032 (Agnico Eagle Mines Limited website). Equipment, fuel, and dry goods are transported on cargo vessels and by barge to Rankin Inlet via Hudson Bay. Personnel, perishables, and lighter goods arrive at Rankin Inlet via the regional airport. A 25-kilometer all-weather access road connects the Meliadine camp with Rankin Inlet (Agnico Eagle Mines Limited website). As of 2022, the Meliadine property includes 7 gold deposits, 6 of which are part of the site’s current mine-plan. In 2022, exploration within the property included 50,500 metres (m) of capitalized drilling and 17,500 m of expensed drilling, for a total of 212 holes (Agnico Eagle Mines Limited, 2023). Meliadine is currently expanding their mill operations to increase processing rate, work is expected to be completed mid-2024 (Agnico Eagle Mines Limited, 2023).
Agnico Eagle also owns and operates the Meadowbank Complex. The complex is located about 110 km by road north of Baker Lake. As such, resupply efforts are directed through Chesterfield Inlet via barge vessels and from there are transported via trucks from Baker Lake to the complex. As of November 2023, the complex has a gold reserve estimate of 2,164,000 ounces and an expected life ending 2026 (Agnico Eagle Mines Limited website). Meadowbank Complex consists of the Meadowbank mine and mill and the Amaruq (Whale Tail deposit) satellite deposit. Like that of the Meliadine mining project, an IIBA was signed by the Kivalliq Inuit Association and Agnico Eagle Mines in February 2017 – the IIBA looks to address detrimental impacts on Inuit arising out of the Meadowbank project, the Meadowbank mine began production in 2010 and mining activities at the site were completed by Q4 of 2019. The open pit mine at Amaruq began commercial production September, 2019 and the underground mining operation achieved commercial production August, 2022 (Agnico Eagle Mines Limited website). The Amaruq site transports its ore to the mill at the Meadowbank site for processing and uses the existing infrastructure at the Meadowbank mine, such as:
- the same shipping lane
- port infrastructure
- all weather access road
- mining equipment
- camp
- airstrip
More infrastructure has been built at the Amaruq site (truck shop/warehouse, fuel storage, and a larger camp facility) (Agnico Eagle Mines Limited website). Exploration efforts at Amaruq continued in 2022, finding several high-grade intersections that demonstrate potential to extend the underground mine’s life. In 2022, due to Agnico Eagle’s Environmental, Social, and Governance practices and contributions, Meadowbank Complex was awarded Silver Level recognition towards sustainable mining through the Mining Association of Canada’s Leadership Awards (Agnico Eagle Mines Limited, 2023).
As of Quarter 4, 2022, estimated gold production (ounces) for Meliadine and the Meadowbank Complex was 372,874 and 373,785, respectively. Agnico Eagle forecasts that the range of payable gold production (ounces) for 2023 will be 355,000-370,000 ounces at Meliadine and 410,000-430,000 ounces at the Meadowbank complex (Agnico Eagle Mines Limited, 2023). Of the forecasted 410,000 – 430,000 ounces to be produced at the Meadowbank complex, Amaruq underground is forecasted to contribute 100,000 ounces of gold (Agnico Eagle Mines Limited, 2023). The company expects about 785,000 ounces to 875,000 ounces of gold production in Nunavut mines through 2025 (Agnico Eagle Mines Limited, 2023). In addition to the gold production, 103,000 ounces of silver was produced at the Meadowbank Complex in 2022 (Agnico Eagle Mines Limited, Website).
In 2021, Agnico Eagle employed 1,763 full-time equivalents (FTEs), of which 319, about 1 in 5, were Inuit. Meadowbank and Whale Tail accounted for 240 Inuit FTEs, while Meliadine accounted for 79. Most local employees (170) of Agnico Eagle are from Baker Lake. Agnico Eagle also employed:
- 70 people from Arviat
- 47 from Rankin Inlet
- 26 from Coral Harbour
- 18 from Naujaat
- less than 10 from each of Whale Cove and Chesterfield Inlet (Aglu Consulting, 2022)
To assist with the advancement of Inuit participation in the mining sector, The Economic Development and Transportation department of the Government of Nunavut, along with other stakeholders, supports and provides education and training programs for mining operations – one such program is the Heavy Equipment Operator Training, which is out of Arviat, a community within the Kivalliq Region and in close proximity to the Southampton AOI (Canada-Nunavut Geoscience Office, 2021)
In 2021, Agnico Eagle employed 17 Inuit FTE contractors at the Meadowbank complex and 36 Inuit FTE contractors at Meliadine, for a total of 53 Inuit contractors. This represented about 3% of total contractor FTE’s. The following contractors came from:
- mostly local (48) from Baker Lake
- 24 from Rankin Inlet
- 8 from Arviat
- 4 from Coral Harbour
- 1 each from Whale Cove and Naujaat (Aglu Consulting, 2022)
In 2021, Agnico Eagle a total of paid $27.74 M in income to its Inuit employees at the sites (Meliadine and Meadowbank). Divided by the number of Inuit FTE’s, the average Inuit FTE employee received about $87,000 in wages. For local communities, employment incomes range from $15,000 to $50,000, this represents a wage significantly higher than average. For the 3 mines, Agnico Eagle hired $782 M on Nunavut Tunngavik Incorporated -registered businesses and spent $831M on Nunavut-based businesses. Footnote 51 This represented 68% and 73%, respectively, of Agnico Eagle’s total spending on contracting for these mines, which was about $1.1 billion. Nunavut’s nominal GDP in 2021 was $4.6 billion (Government of Nunavut, 2023). This contracting represented slightly less than 1/5 of Nunavut’s GDP for that year (Aglu Consulting, 2022).
The Baffinland Corporation Mary River Mine on northern Baffin Island currently ships iron ore to the rest of Canada from the Milne Inlet Port along the north-east coast of Baffin Island and through Baffin Bay. The project’s property consists of 411,949 hectares of tenure, including 363, 323 hectares of Crown mineral claims and 3 Nunavut Tunngavik Incorporated Mineral Exploration Agreements covering 48,626 hectares. The mine began commercial production from Deposit Number 1 in late 2014 (Canada-Nunavut Geoscience Office, 2022). Regional exploration at the project site was suspended in 2021 due to COVID-19 restrictions, however, deposit-scale exploration and geophysical surveying still occurred. In 2022, Baffinland completed infill and exploration drilling across the property, results from these efforts will be used to update the NI 43-101 resource estimate and feasibility study from Mary River (Canada-Nunavut Geoscience Office, 2022).The life of mine revenues for Governments and Inuit Organizations from Deposit 1 alone are in excess of $4.5 billion (Baffinland Iron Mines Corporation, 2023). Footnote 52 Baffinland received a project certificate in 2012, to build a railway running south to a port at Steensby Inlet (Nunatsiaq News, 2019) to transport products from the mine to the port so it can ship its product through Hudson Strait. In May of 2022, NIRB submitted its recommendation to the Minister of Northern Affairs to reject Baffinland’s Phase 2 proposal Footnote 53 for increased production and shipping through the northern route due to potential for significant adverse ecosystem effects; this decision led to Baffinland working with NIRB to renew its permit for current production limits, allowing Baffinland to ship up to 6 Mt of iron ore through Milne port (Canada-Nunavut Geoscience Office, 2022). As Phase 2 has not been approved, Baffinland will work with the Minister and the Qikiqtani Inuit Association to towards finding a path forward. However, Baffinland has stated that the Steensby port component of the project will move ahead, subject to financing.
As for the Mary River project, it employed 232 Inuit FTEs in 2022 (13% of the total workforce) (Baffinland Iron Mines Corporation, 2023). $24,082,687 in wages were paid to Baffinland and contractor Inuit employees in 2022 (increase of 18% from 2021), of this, $14 M went to Inuit employees based in the North Baffin local study areas (LSA). The average pays for Baffinland contractor Inuit FTEs in 2022 was $103,805 (Baffinland Iron Mines Corporation, 2023).
Exploration
Northquest Ltd. (a subsidiary of NordGold SE) acquired its Pistol Bay property in 2010 and has been drill-testing it since 2011 (Canada-Nunavut Geoscience Office, 2016). Norgold has transferred 100% of shares of the Pistol Bay property to BG Gold Capital in December of 2022 (Norgold, 2022). The site’s property covers more than 78,000 hectares west of Whale Cove. In 2018 Northquest focused on detailed mapping, ground geophysical and geochemical surveys to identify and prepare high potential drill targets for 2019. Northquest noted that infill drill program is planned, which will focus on testing underground resource potential (Norgold website). In 2020, Norgold released a revised resource estimate for the Vickers deposit in Pistol Bay. The new estimate increased the NI 43-101 Footnote 54 inferred resource to 1.58 M ounces of gold at an average grade of 2.2 g/t Au, doubling the previous estimate– further drilling to expand this effort was conducted in 2021 (Canada-Nunavut Geoscience Office, 2022). In January 2022, the NIRB released a positive screening decision regarding Northquest’s proposal to relocate and expand its existing camp (Canada-Nunavut Geoscience Office, 2022). As well, Norgold announced that the 2022 season at Pistol Bay would be on hold to allow for more time to process the 2021 drilling results (Canada-Nunavut Geoscience Office, 2022).
Solstice Gold Corporation’s Qaiqituq project (formerly known as the Kahuna project) is a gold exploration project located about 45 km northeast of Rankin Inlet. In 2018 the corporation carried out geological mapping, rock sampling and till sampling across the Kahuna property (Solstice Gold, Website).
Kodiak Copper Corp.’s (formerly Dunnedin Ventures Inc.) Kahuna project is an advanced stage diamond exploration project near Rankin Inlet and adjacent to Agnico Eagle’s Meliadine mine. Initial drilling commenced in 2018, with further drill targets to be tested in follow-up programs (Kodiak Copper Corporation, Website). Exploration has since ceased and there are no indicated timelines for resuming efforts (Canada-Nunavut Geoscience Office, 2021).
In 2017, Auryn Resources Inc. started exploration for gold in the Gibson MacQuoid Project. In 2018, Auryn Resources completed a summer exploration program. Exploration has ceased from 2019 to 2021 (Canada-Nunavut Geoscience Office, 2021). Exploration has since resumed (Junior Mining Network Website).
Agnico Eagle Mines Limited’s Cone Hill, Parker, Peter, and Fox Lakes projects are for gold exploration northwest of Rankin Inlet. Various exploration campaigns were conducted at these properties in 2017 (Canada-Nunavut Geoscience Office, 2018). Agnico Eagle Mines Limited, with Aura Silver Sources, have gold, silver, zinc, copper, and lead projects north and northwest of Baker Lake. Exploration activities at these sites were conducted in 2017 (Canada-Nunavut Geoscience Office, 2018). Agnico Eagle Mines Limited’s Meadow River gold project (adjacent to Amaruq) consisted of extensive exploration activities at the site in 2017 (Canada-Nunavut Geoscience Office, 2018). As of November 2023, these projects have not had further exploration since 2017.
The Greyhound project is facilitated between Agnico Eagle and Gold79 Mines. It is located along the all-season road connecting the community of Baker Lake to the Meadowbank complex. The project consists of 13 mineral leases, covering 13,573 hectares of Crown land, and 2 mineral claims with an area of 2,334.87 hectares. The mineral leases are managed by a joint venture between Angico Eagle as the operator, with a 63.4% interest, and Gold79 Mines with a 36.6% interest. The 2 mineral claims are owned fully by Gold79. In 2021, Agnico Eagle completed 1,815 m of diamond drilling in 9 holes (Canada-Nunavut Geoscience Office, 2022). Primary target for the project is gold, however, the project also has potential for silver, zinc, copper, and lead. In 2022, Agnico Eagle submitted its annual report to NIRB that included plans for a 5-hole drilling program for summer of 2022 – no further information about the project has been released (Canada-Nunavut Geoscience Office, 2022).
The Naujaat diamond project, operated/partnered by North Arrow Minerals Incorporated (North Arrow Minerals Inc., Website) and Burgundy Diamond Mines Limited covers 10,472 hectares of mineral claims. In June 2020, North Arrow signed an option agreement with Burgundy Diamond Mines to have them finance bulk sampling of Q1-4 kimberlite, and depending on n the results, a follow-up 10,000-tonne bulk sample (Canada-Nunavut Geoscience Office, 2022). The 1,823 bulk sample was collected in 2021 and results released by North Arrow in July 2022; the results showed varying degrees of diamonds that warrant further exploration. North Arrow and the hamlet of Naujaat is working to expand an existing ATV trail outside the community – this would facilitate the collection of the proposed 10,000-tonne bulk sample; the proposal has received positive recommendation from the NIRB (Canada-Nunavut Geoscience Office, 2022).
Ferguson Lake Project is owned and operated by Canadian North Resources Incorporated. The property consists of 11 contiguous claims and 10 mineral leases with a combined area of 25,380 hectares (Canada-Nunavut Geoscience Office, 2022). In 2021, the site conducted 2,400 m of diamond drilling to test the deposit. All the holes intersected massive to semi-massive or stringers of Ni-Cu-Co-Pd-Pt sulphides; these results were used to plan for 2022. In 2022, the site saw 18,144 m of drilling over 68 holes. Once complete results are received the data will be used to update the deposit model and update the NI 43-101 resource estimate (Canada-Nunavut Geoscience Office, 2022).
ValOre Metals Corporation (formerly Kivalliq Energy Corporation) reactivated the Angilak project in 2022 after low uranium prices and the COVID-19 pandemic caused dormancy with the project. In 2022, ValOre conducted further exploring the area (drilling, till sampling, ground electromagnetic geophysics) (Canada-Nunavut Geoscience Office, 2022). The property covers 59,483 hectares and focuses on the Lac 50 Deposit which had a 2013 NI 43-101 estimate of 2.38 M tonnes of ore at an average grade of 0.69% U3O8 (Canada-Nunavut Geoscience Office, 2022). Beyond Angilak, ValOre had also acquired the Baker Basin Uranium Property (Canada-Nunavut Geoscience Office, 2016).
Two uranium projects to the west of Baker Lake, Kiggavik and St. Tropez, were set to be developed by Orano Canada (formerly AREVA Resources Canada), but AREVA had previously stated that it could be up to 20 years before construction begins due to low Uranium prices. The Kiggavik Project, which includes both mines, was conditionally rejected by the NIIRB in 2016, but may be approved in the future if resubmitted with a firmer schedule (Zerehi, 2016b). No field work was conducted in 2021, the project is currently in a care and maintenance phase with site inspections planned, at minimum, every 5 years (Orano, 2022).
Mineral potential of the Kivalliq Region
In 2022, GeoVector Management Incorporated conducted a mineral potential assessment of the Kivalliq Region (Figure 4). This assessment used GIS software that allowed for the definition of known mineral deposits and showed areas away from known mineral deposits that would be favorable for mineral exploration. The assessment showed 5 Lode Gold, one Volcanic Massive Sulphide (VMS), and 2 diamond target areas that fall within the 50 kilometer and 100-kilometer buffers of the proposed linear infrastructure corridor. Footnote 55 The metals found in the VMS is primarily copper and zinc, however, significant added silver, gold and lead were found. In addition, accessory minerals such as gallium, germanium, indium, and tin have the potential to be found in economic concentrations. GeoVector concludes that with the second largest greenstone belt in Canada and limited exploration, which is reasonable to assume that the discovery of new economic gold and base metal deposits will happen in the next 10 – 20 years; in addition, the discovery of other diamonds and REEs is also very possible (GeoVector, 2022).
While the Kivalliq Region has high mineral potential, the mining effort would be primarily, if not entirely, outside of the AOI boundary. This does not preclude that the establishment of an MPA would have no impact on mining operations as shipping lanes could be impacted. Further exploration into commercial vessel activity around and within the AOI is explored in later sections of this report.
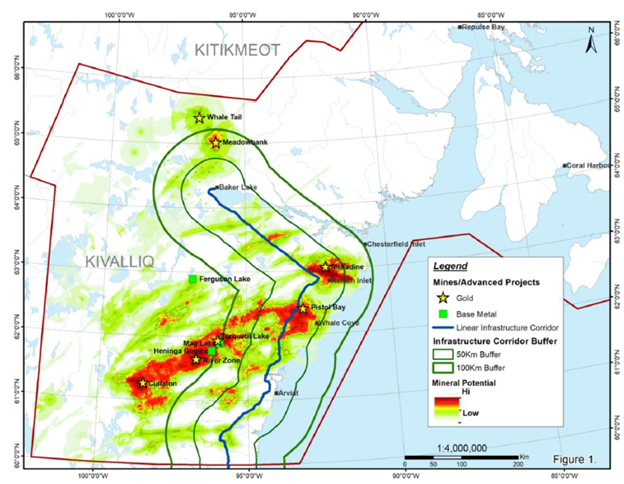
Figure 4: Mineral Potential and Infrastructure Corridor in Kivalliq
Source: Kivalliq Region gold and base metal mineral potential (GeoVector, 2022).
Long description
This map shows mineral potential and mining/advanced projects in the Kivalliq and Kitikmeot regions of Nunavut. The north arrow points up.
- Geographical Layout (Top to Bottom):
- The map's northern boundary is the Kitikmeot region. Repulse Bay and Doral Harbour (likely Coral Harbour) are to the northeast.
- The western area is the Kivalliq region.
- Communities and projects from North to South/West to East: Whale Tail (Gold), Meadowbank (Gold), Baker Lake, Fergeson Lake (Base Metal), Meliadine (Gold), Rankin Inlet, Chesterfield Inlet, Mary Lake/Henings Geophone, Whale Cove, Gatuni (Gold), Arviat.
- The eastern coast borders the sea.
- Legend and Overlap Descriptions:
- The map includes a Linear Infrastructure Corridor (blue line) running generally north-south, curving east-west between Baker Lake and Rankin Inlet.
- This corridor has a buffer zone: 50Km Buffer (inner green line) and 100Km Buffer (outer dark red line).
- Mineral Potential is shown by a gradient from Low (yellow) to High (red).
- The areas of High Mineral Potential (red) mostly follow the coast and the inland curve of the infrastructure corridor. They are particularly intense around Gatuni, Meliadine, and the area between Baker Lake and Fergusen Lake.
- The highest potential areas (red) overlap significantly with the Infrastructure Corridor Buffer (the 50km and 100km lines).
- Gold mines/projects are shown as yellow stars (e.g., Whale Tail, Meadowbank, Meliadine, Gatuni).
- Base Metal projects are shown as green squares (e.g., Fergusen Lake)
Offshore oil and gas
The Southampton AOI includes marine waters that overlie parts of the Hudson Basin. Interests in the petroleum potential of this basin peaked in the early 1970s, with the industry and Geological Survey of Canada (GSC) acquiring over 46,000 and 40,000 line-km of deep and shallow seismic data, respectively. The seismic data acquired by industry was generally low quality due to acquisition problems. Based on these data, industry drilled 5 offshore wells in the central part of the basin between 1969 and 1985, 4 of these wells targeted the fault play. No commercial oil and gas discoveries were recorded from the wells (Lavoie and Dewing, 2022).
Exploration Licences are the licences, permits or rights that any company must obtain to conduct exploration activities within any operating areas granted by Government Instrumentality. Footnote 56 In December 2016, a moratorium was issued by the Government of Canada that designated all Canadian Arctic waters as indefinitely off limits to future oil and gas licensing with a commitment to review the designation every 5 years through a science-based life-cycle assessment. In August 2019, Canada issued an order prohibiting oil and gas activities in the Canadian Arctic offshore. This moratorium applies to the area in which the AOI is located. The moratorium has been extended until December 31, 2028, at which point it is expected to be extended again extended (SOR/2022-274).
In 2016, Shell and Repsol held the last 8 exploration licences within the Southampton Island AOI (CIRNAC, 2016), all 8 licences were surrendered in their entirety on the 8th of August 2017 (Figure 5). Therefore, there are currently no active exploration licences in the Hudson Basin, and due to the moratorium, there will not be any soon.
The most recent hydrocarbon resource assessment of Hudson Bay (Dewing et al., 2023) concluded that, “Hudson sedimentary basin has a mean estimate of 67.3 M recoverable barrels of oil equivalent Footnote 57 and a 10% chance of having 202.2 or more M barrels of recoverable oil equivalent. The mean chance for the largest expected pool is about 15 M recoverable barrels of oil equivalent (MMBOE), and there is only a 10% chance of there being a field larger than 23.2 MMBOE recoverable. 14 M recoverable barrels are apportioned to the Southampton Island AOI (a 93 087 km2 of nearshore waters around Southampton Island and Chesterfield Inlet in the Kivalliq Region of Nunavut)”. A map showing the distribution of petroleum potential in the Hudson Basin is shown in Annex 5.
Dewing et al. (2023) acknowledged the limitations of the available data … “There are only 7 wells, and outcrop is scattered in the onshore areas. There is a seismic grid over the center of the basin, but the data quality is poor compared to modern seismic surveys. There are no hydrocarbon discoveries or production data to guide estimates of field sizes...” It highlighted that the lowest chance of success for the petroleum system in the Hudson Basin is the presence of a viable source rock and its ability to produce and expel oil given the relatively low temperatures in the basin. Another compounding factor is that the potential sizes of accumulation in the basin are quite small, which makes them less attractive for exploration in an offshore setting. Although the report suggested some methods to gather more data to improve the understand of the source rock characteristic and distribution, the source rock risk and field size uncertainty can only be properly addressed by the acquisition of high quality 3-dimension seismic data and subsequent drilling of wells to test the plays. Several resource assessments have been made by various arms of the Government of Canada, other public institutions, and the industry within the Hudson Basin over the last 50 years. There are large differences in the potential hydrocarbon volumes predicted for the area in the different publications. The 3 most recent Government of Canada publications have median (P50) estimates ranging from 63 MMBOE to 1,346 MMBOE recoverable; with:
- Procter et al. (1984) estimated a P50 of 1, 346 MMBOE
- Drummond (2009) estimated a P50 of 142 MMBOE (north of 60° only)
- Dewing et.al (2023) estimated a P50 of 63 MMBOE
Several reports have downplayed the potential for economic hydrocarbon discoveries in Hudson Bay, for instance, “the chances of discovering major, economic accumulations of hydrocarbon in the Hudson Bay are so slim that additional expensive exploration is not justified.” Tillement (1975). While others are more conservative in their outlook “the amount of drilling and geophysics in Hudson Bay is too sparse to encourage more active exploration" (Procter et al., 1984).
Research carried out by GSC, CNGO and other public organization in the 2000s to improve the understand of the geological history and hydrocarbon system of the basin (summarized in Lavoie and Dewing, 2022) points to a number of positive petroleum system elements including possible hydrocarbon slicks, areas where the source rock interval likely entered the oil window, and processes to enhance reservoir quality. While these results are included in the probabilistic assessment approach used in Dewing et al. (2023), the low density and low quality of geological data still casts an uncertainty in the level of confidence in the volumes predicted in any of the resources assessments.
In consultations with Coral Harbour community members, there was mixed opinions on economic development opportunities, specifically those of oil and gas development near and around the Southampton Island AOI – some individuals expressed interest in exploring the potential for oil and gas development while others stated that they hope there would be no future development of oil and gas in and around the AOI. However, each participant shared the desire to protect their culture, environment, and way of life (DFO, 2022).
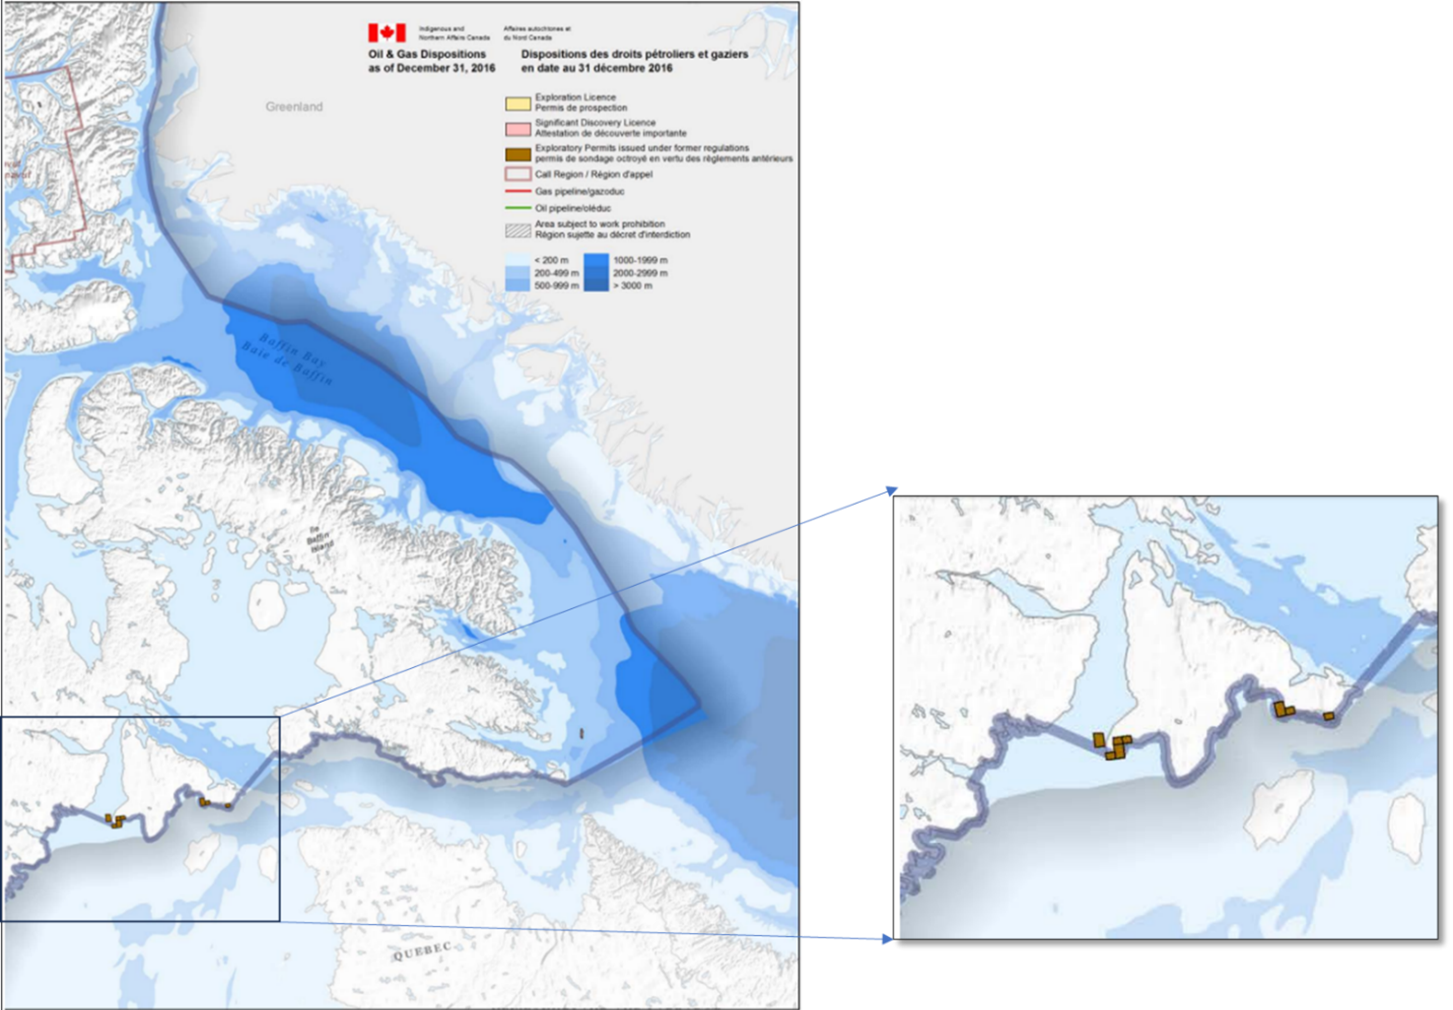
Figure 5: Oil & Gas Dispositions as of December 31, 2016.
Source: Exploration licences surrendered by Shell and Repsol in 2016. CIRNAC Annual Northern Oil and Gas Report, 2016
Long description
This map shows oil and gas tenure and bathymetry in the eastern Arctic, with an inset showing detail for the Western Hudson Bay/Nunavut coast.
- Geographical Layout (Top to Bottom):
- Top-left shows Greenland.
- The main water body is Baffin Bay.
- The bottom-left shows an area of QUEBEC.
- The map is dominated by a large marine area with bathymetry (depth) indicated by different shades of blue.
- <200m (lightest blue)
- 200−499m (light-medium blue)
- 500−999m (medium blue)
- 1000−1999m (dark-medium blue)
- 2000−2999m (dark blue)
- >3000m (darkest blue)
- The Inset Map: Shows a detailed area along the coastline of Nunavut.
- Legend and Overlap Descriptions:
- Red line: Indicates the Oil Pipeline/Gas pipeline (Old).
- Green line: Indicates the Proposed pipeline to work prohibition.
- Brown square/rectangle: Indicates a Significant Discovery Licence or Attestation de découverte importante. These are clustered along the coastal areas in the inset map.
- Large Light Purple Area: Indicates the Area subject to work prohibition (Zone sujette au décret d'interdiction). This area covers the entire coastal region displayed in the inset map and is a large protected zone in the main map.
- The Significant Discovery Licenses (Brown squares) are located within the Area subject to work prohibition (Light Purple Area) along the coast.
- Source:
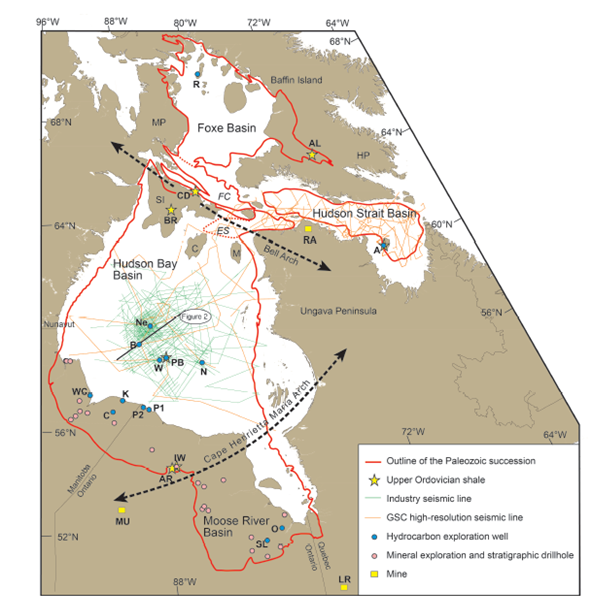
Figure 6: Geological and seismic lines map.
Source: The distribution of seismic data acquired, and wells drilled in the Hudson Basin. (Note no industry seismic data has been acquired or wells have been drilled within the Southampton AOI.). Lavoie and Dewing, GSC Bulletin 609.
Long description
This map illustrates the geology, seismic lines, and exploration locations in the Hudson Bay, Foxe Basin, and surrounding areas.
- Geographical Layout (Top to Bottom):
- Northern Area: Baffin Island and Foxe Basin.
- Central Area: Hudson Strait Basin (east) and Hudson Bay Basin (west).
- The central landmass is the Ungava Peninsula (east) and Nunavut (west).
- Southern Area: Moose River Basin, bordering Manitoba, Ontario, and Quebec.
- Legend and Overlap Descriptions:
- Red line (thick, solid): Outline of the Paleozoic succession, which covers the vast majority of the central map area (Hudson Bay Basin, Foxe Basin, Hudson Strait Basin).
- Red line (thick, dashed): Outline of the Upper Ordovician Shale (shown in the northern Foxe Basin).
- Industry seismic line (thin, light orange lines): Numerous lines crisscrossing the entire region, concentrated over the main basins.
- GSC high-resolution seismic line (thin, light green lines): Also numerous, intersecting the orange lines across the main basins.
- Blue circles (small): Hydrocarbon exploration well. Found in clusters in the Hudson Bay Basin (e.g., N, PB, W) and along the coast (e.g., K, C, AR).
- Pink/Mauve circles (small): Mineral exploration and stratigraphic drillhole. Found more generally along the edges of the basins and in the south.
- Yellow stars: Mine. Located in the Foxe Basin area (R, Z), Hudson Strait (AL, HP), and Ungava Peninsula (A).
- Black dashed arrows: Show the general direction of geological arches (e.g., Bell Arch, Cape Henrietta Maria Arch).
- Overlap: The various seismic lines (orange and green) overlap significantly, and most hydrocarbon exploration wells and drillholes are located within the large area outlined by the Paleozoic succession (thick red line)
Commercial shipping and other vessel activities
Transportation infrastructure in Nunavut currently consists of a system of airports and seasonal sealifts. The territory does not have roads or rail lines that connect communities within Nunavut or to other provinces and territories due to extraordinary costs (NPC, 2016).
Marine infrastructure in towns is quite minimal and is typically designed for basic community freight needs (Government of Nunavut, 2012). As there is no road network in the Kivalliq Region and Nunavut as a whole, and air transportation is expensive, shipping goods via marine vessels plays a crucial role for communities, industry, and government. Furthermore, marine infrastructure is critical for communities as they depend on the annual marine supply for food, vehicles, construction materials and other commodities that are not economically feasible to be shipped by airplane (Government of Nunavut, 2012). As such, the AOI is commonly used by vessels engaged in community and industry resupply, as it offers a more direct path that allows for shipment goods that support land-based economic activity (meaning, transport of heavy lift goods or equipment). Opting for longer routes to avoid the AOI would potentially result in higher costs and a longer duration for the shipping activity. Shipping in the Arctic is seasonal due to ice conditions restricting passage. Often, a single vessel serves multiple communities, but if there's not sufficient time to reach them all, more vessels may be needed, if available. Due to the limited window for shipping operations, the challenging coordination to support the needs of many stakeholders, Arctic shipping is costly, alteration of these routes increases the challenges posed to shipping companies and those who rely on them.
Maerospace (2019) has identified that vessel traffic within the AOI generally consists of the following vessel types:
- bulk carrier
- icebreaker
- military/patrol
- cargo/supply
- oil/chemical
- passenger/pleasure
- tug
Utilizing available Automatic Identification System Footnote 58 data, Maerospace (2020) saw that vessels are typically in the AOI during July to October and occasionally in June and/or November. An average of up to 25 vessels transit through the AOI per year (2012-2019), with transits increasing in later years (Maerospace, 2019). It should be noted the fastest growing vessel categories in the Arctic include government vessels and icebreakers, passenger vessels, pleasure craft and bulk carriers (Dawson et al., 2014). During an Inuit Qaujimajatuqangit workshop regarding the SHI AOI, Inuit had noted that mining ships, cruise ships, research vessels including:
- instruments used by researchers
- outfitters (more outboard motors)
- tankers (perceived issues with emptying fuel lines in the water)
- icebreakers are present within the AOI (Idlout, 2020)
Tanker resupply within the area is crucial in meeting communities’ energy needs as the current energy infrastructure is dependent on diesel power generation.
Given the AOI’s geographic position at the north of Hudson Bay, near the Hudson Strait and the Northwest Passage, considerable vessel traffic to the Kivalliq Region (including to Baker Lake through the Chesterfield Inlet waterway) is usually routed near or through the AOI. Figure 7 shows the available vessel Automatic Identification System data within the SHI AOI.
During consultations with the communities of Chesterfield Inlet and Coral Harbour, community members expressed concerns that vessel activities pose greater noise and pollution hazards towards marine mammals and to marine mammal harvests. Furthermore, the community members expressed concerns regarding lack of notification when ships pass through the area, as well, that ships make shortcuts through Walrus Island and Coats Island towards Chesterfield Inlet, Baker Lake, and Rankin Inlet, possibly increasing distress to marine mammals within the area (DFO, 2022 and 2023a). To address the shortcuts, representatives from Chesterfield Inlet had consulted the shipping and mining companies responsible for the mining resupply efforts. In their meeting, it was recommended, and agreed upon, that if weather was favourable, ships would go around (go South of) Coats Island creating potentially less noise disturbances to marine mammals that are often found in the area (DFO, 2023a). Community members believe the shipping companies are adhering to this agreement as more ships are traveling south of Coats Island (DFO, 2023a). Chesterfield Inlet community members highlighted that hunters have noticed a decrease in marine mammals during the shipping season as marine mammals are scared by the sound; this has resulted in hunters needing to travel further for hunts to be successful which in turn increases the costs of hunting (Canadian Ecosystem Tourism, 2023 and DFO, 2023a). Community members from Chesterfield Inlet have voiced that they feel caught between the need for continued vessels to support inland mining operations (and subsequent economic benefits) and protecting the environment and marine mammals (DFO, 2023a). To help ease concerns regarding vessel traffic through Chesterfield Inlet, community members from Chesterfield Inlet discussed having community observers on all ships to help guide and reduce harms to marine mammals caused by vessel traffic (DFO, 2023a). The exploration into possible shipping restrictions needs to be explored with communities during the MPA design phase of the process to consider MPA designation (DFO, 2022).
Shipping activities in the Arctic typically consist of transit, resource based and re-supply activities. Transit traffic only passes through the Arctic as a short cut to link southern markets with one another. This type of activity consists of 2 types of shipping operations: bulk shipping (such as ores, grains, and petroleum products) and manufactured goods (generally shipped in containers) (Chart 1) (Guy and Lasserre, 2016).
Resource-based shipping activities are destination-based activities that go to the Arctic to load or unload cargo. Generally, the largest volumes of this type of shipping consist of transporting the mineral resources extracted from the Arctic region (Guy and Lasserre, 2016). This is typically done via bulk carriers the case for heavier, bulky minerals such as iron ore and other base metal deposits (Nickel, Copper, Lead, and Zinc); however, this is not likely the case for the Kivalliq Region where mining for gold is prevalent. Once mining production occurs the gold is flown out of area.
Vessels are also used to resupply mine projects with various materials, which can include dry cargo multipurpose vessels and fuel tankers (Agnico Eagle Mines Limited, 2018). If completed, the Kivalliq Hydro-Fibre Link could provide greater opportunity for mineral extraction from the region and would potentially increase the number of vessels moving through the AOI. It is reasonable to assume this due to the Kivaliq Region containing the second largest greenstone belt, the Rankin-Ennadai greenstone belt, which has been under-explored (GeoVector, 2020).
Both the Meliadine gold mine and the Whale Tail gold mine require an annual delivery of up to 10 cargo ships and up to 6 tankers of diesel fuel per year. Footnote 59 For Whale Tail gold mine, the vessels will be delivered on routes that go through the AOI from the Hudson Straight and into Baker Lake. The routing is on both the north and south sides of Coats Island but will primarily be routed to the south (Agnico Eagle Mines Limited, 2018). For the Meliadine gold mine the shipping route comes through the Hudson Straight, through the AOI, north of Coats Island, and into Melvin Bay, adjacent to Rankin Inlet (Agnico Eagle Mines Limited, 2019).
Agnico Eagle Mines complies with extensive shipping management measures as per the Meadowbank and Meliadine Shipping Management Plans. These plans are required to meet federal regulations and project certification issued by NIRB (Agnico Eagle, 2018). Some notable shipping measures include the following:
- speed limit of 14 knots in the shipping route inside the Southampton Island AOI
- more speed restrictions in areas identified by communities as important for marine mammals inside the Southampton Island AOI (for example, Marble Island)
- avoidance of areas identified by communities and other interveners as important for marine mammals when safe to do so (meaning, north of Coats Island)
- it is estimated by Agnico Eagle that about 80-90% of shipments for mining operations utilize the route south of Coats Island
- the northern route is primarily used in the Fall when winds are stronger and provide safer passage
- marine mammals are monitored by the ship’s crew while transiting inside the Southampton Island AOI
- marine mammal monitoring in Chesterfield Inlet by dedicated barge monitors
It was estimated that since the opening of the Meadowbank mine in 2010, annual summer shipping through the Chesterfield Inlet had increased by about 30-40 ships; community members of Chesterfield Inlet have stated that with the increase in ship traffic, there has been a subsequent decrease in marine mammals in and around the community (Newell, 2018; DFO, 2022; and DFO 2023a). Increased shipping levels are believed to be the reason for a perceived decreases in harvest of seals and belugas, or there are increased costs to harvest (further distances traveled, greater resources required, more time needed, etc.) (Newell, 2018; DFO, 2022; and DFO 2023a). To decrease impacts of shipping to mines near Baker Lake, Chesterfield Inlet community members further suggested:
- development of a deep seaport
- begin ship traffic along the inlet in August to avoid impacting the char run
- decrease ship speed
- have an Inuk guide on each vessel to limit impacts on the inlet and waterway (Newell, 2018)
During reviews of this document, a representative of Agnico Eagle stated that having an Inuk guide on each vessel is an option that could be implemented as monitoring is already in place on barges that travel through the inlet. Footnote 60
Re-supply shipping activities (“sealift”) consist of transporting supplies needed by local communities in the Arctic. Supplies usually include items such as:
- non-perishable food items
- vehicles
- heating oil and gasoline (Guy and Lasserre, 2016)
Other items supplied to communities by sealift include:
- diesel and jet fuel
- home electronics
- furniture
- household appliances
- snow machines
- tools
- textiles
- footwear/headgear
- construction equipment (for example, front end loader, dump truck)
- lumber
- drywall
- wiring
- other building materials and more(Chamber of Marine Commerce Canada, Website)
Sealift vessels can carry hundreds of 22-foot equivalent (TEU) containers. As an example, 1 sealift vessel can carry up to 665 TEUs (Arctic Sealift, Website). Commodity groups per TEU container can range in value from $3,500 (CAD) up to over $600,000 (CAD) (HIS Markit, 2017). As a crude example, a vessel loaded with 665 TEUs with an average container value of $3,500, will carry commodities that have an economic value of about $2.3M. Depending on the value of goods per container, and assuming a full load of containers, estimates of the economic value of commodities being shipped per vessel can be even higher. Generally, sealift vessels are likely to carry millions (M) of dollars worth of commodities per vessel per shipment. It is to note that community containerization of re-supply cargo is about 20% of total needs, the balance is crated Footnote 61; the estimations above are used as a proxy due to having limited information on crated values.
Re-supply activities are critical to many communities in the Canadian Arctic that have limited to no road access and limited infrastructure to handle heavy aircraft (Arctic Council, 2009). Cargo ships leave southern Canadian ports with barges and tugboats loaded on deck. To unload, ships will anchor near a northern community then use the tugboats and barges to unload cargo onto a beach ramp (Guy and Lasserre, 2016).
The shipping companies Nunavut Sealink and Supply Inc. (NSSI) and NEAS provide sealift carriage and related services to all communities in eastern Nunavut, including those in the Kivalliq Region (Qikiqtaaluk Corporation, Website and NEAS, Website).
NSSI’s core fleet consists of 8 multipurpose cargo ships and tankers (Arctic sealift, Website). Based on NSSI’s summary of the 2021 sealift season:
- 17 vessels went to Rankin Inlet
- 8 vessels to Baker Lake
- 3 vessels to Arviat
- Coral Harbour, Naujaat, Chesterfield Inlet, and Whale Cove, each had 2 vessels come
There was a total of 38 vessels that came to these 7 communities in 2021 (Arctic sealift, Website).
NEAS’s fleet consists of 5 multipurpose cargo ships. Based on NEAS’s preliminary 2022 sealift season:
- Coral Harbour, Chesterfield Inlet and Rankin Inlet were scheduled to each receive 6 vessels
- Baker Lake 4 vessels
- Whale Cove 6 vessels
- Arviat 5 vessels
- Naujaat 2 vessels
Totaling 26 vessels from NEAS’ fleet passing through, or near the Southampton Island AOI (NEAS, Website).
In addition, Coastal Shipping Limited (Woodward Group) has a fleet of small tankers that haul petroleum product for Nunavut communities, including those in the Kivalliq Region. This company also manages the fuel supply needs for Agnico Eagle Mines utilizing foreign flag tankers (Woodward Group, Website). While Desgagné, supports needs of Nunavik and Baffinland through their subsidiary, PetroNav (PetroNav, Website).
In the summer of 2019, the Port of Churchill was being used to load a vessel with grain destined for overseas, for the first time since 2015 (CBC, 2019). However, due to needed repairs, grain shipments have ceased and won’t resume until 2024. The railway, owned by Arctic Gateway Group, will be kept open to passenger and freight until all repairs are completed (Manitoba Cooperator, 2021).
Arctic Gateway, owner, and operator of the Port of Churchill, also acts as a hub for transport within the Arctic. Since 1929, the Port of Churchill has been an important part of Canada’s international grain exports and the development of the Kivalliq Region. Since 2021, Nunavut resupply efforts through Churchill has increased over 250%. Footnote 62 In December of 2023, Arctic Gateway had signed an agreement with Hudbay Minerals Inc. to ship zinc concentrate through the port of Churchill (Lefebvre, 2023). Significant investment into Arctic Gateway’s rail network, which connects to the Port of Churchill, is underway – it is expected that with this investment in increased infrastructure, Arctic Gateway will be able to increase operations through greater accessibility to new markets and customers; any possible shipping restrictions through the SHI MPA may impact operations and growth of Arctic Gateway. Footnote 63
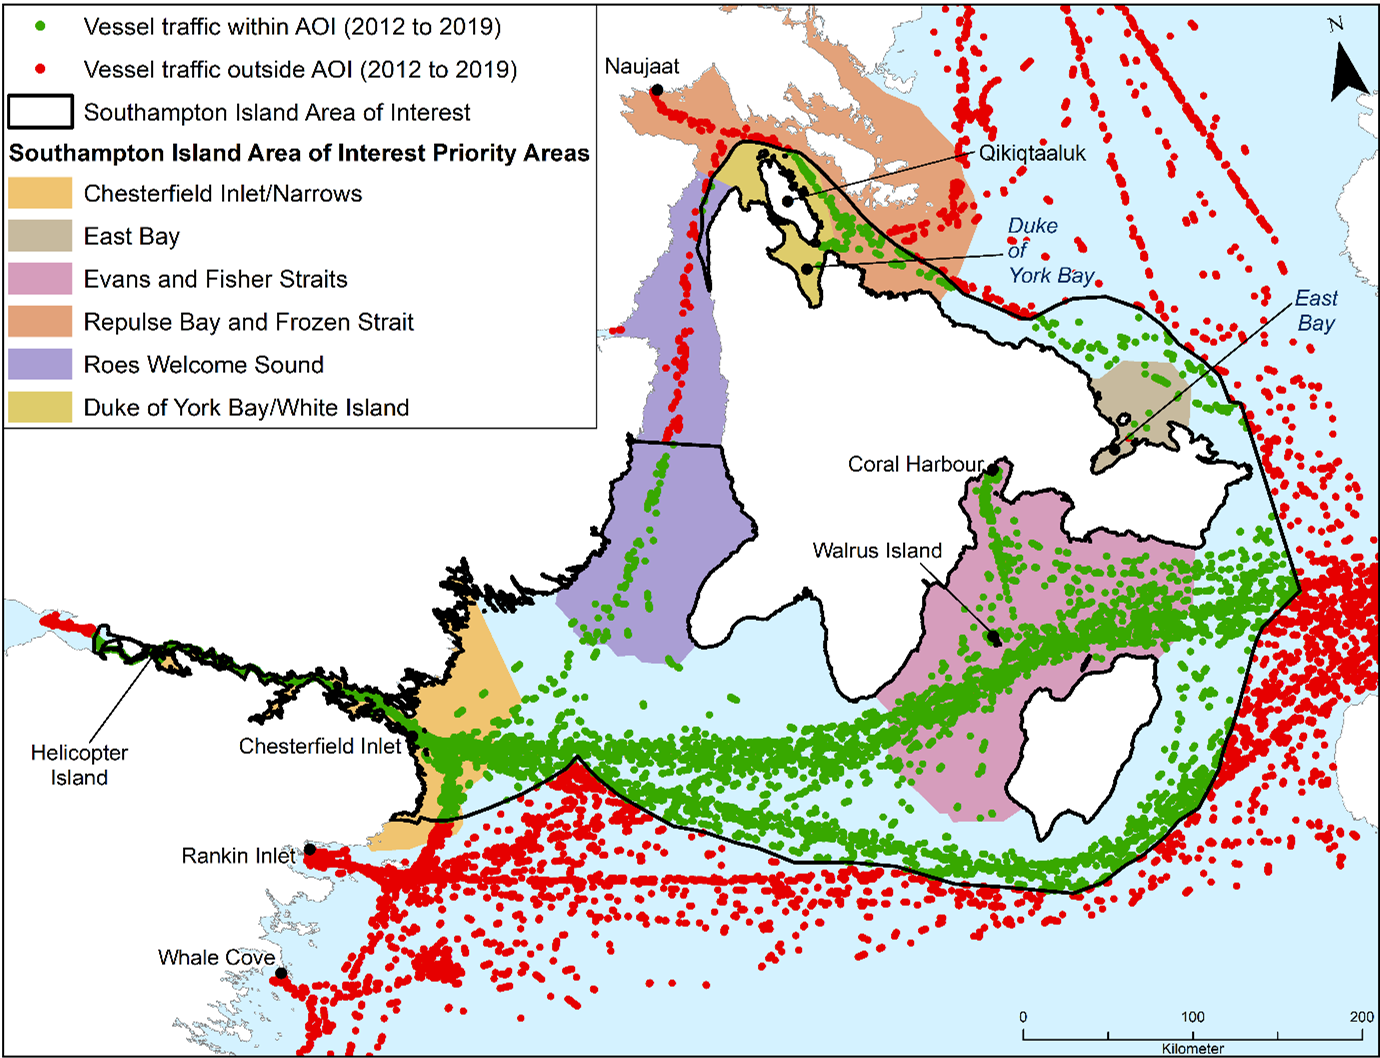
Figure 7: Automatic Identification System (AIS) data.
Long description
Locations of vessels with Automatic Identification System (AIS) data relative to the Southampton Island Area of Interest and priority areas (data from 2012 to 2019; adapted from Maerospace, 2020).
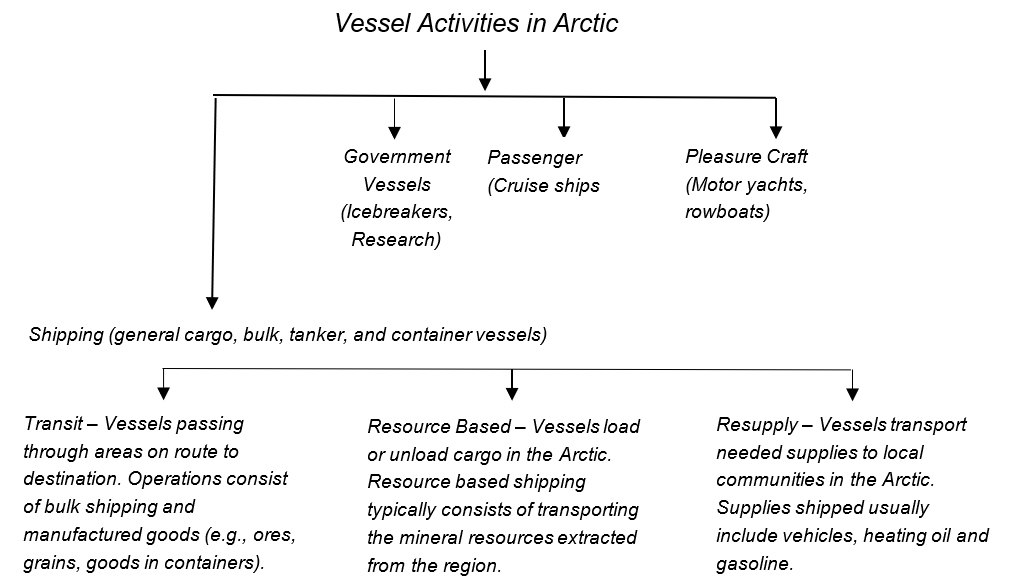
Vessel activity and commercial shipping type.
Long description
A comprehensive flowchart titled, Vessel Activities in Arctic. It illustrates several types of vessels operating in the Arctic Region and their respective activities. The chart is organized into several categories, each highlighting different vessel types and their specific roles.
Shipping (general cargo, bulk, tanker and container vessels)
This category is further divided into 3 subcategories based on the nature of their operations.
- Transit: Vessels passing through the Arctic on route to destination. Operations consist of bulk shipping and manufactured goods (such as ores, grains, goods in containers).
- Resource-based: Vessels load or unload cargo in the Arctic. Resource based shipping typically consists of transporting the mineral resources extracted from the region.
- Resupply: Vessels that transport needed supplies to local communities in the Arctic. Supplies shipped usually include vehicles, heating oil and gasoline.
Government vessels
- Icebreakers
- Research vessels
Passenger vessels
- Cruise ships
Pleasure craft
- Motor yachts
- Rowboats
Recreational and tourism activities
Recreational and tourism activities within the AOI include wildlife viewing (for example, whale and bird watching), canoeing and paddling, cruises, fishing, hunting, dogsledding, camping, and hiking.
There are 2 Migratory Bird Sanctuaries (MBS) on Southampton Island, Footnote 64 the Harry Gibbons (Ikkattuaq) MBS and the East Bay (Qaqsauqtuuq) MBS, which protect the habitats of dozens of bird species. Both bird sanctuaries include marine waters and a terrestrial component and marine conservation values within the AOI extend into these 2 Environment and Climate Change Canada MBS.
In 2003, a feasibility study for attraction development around Coral Harbour was conducted. In this study, the authors used the following as study areas:
- Ruin Point
- Walrus Island
- Kirchoffer River
- Duke of York Bay
- Coates Island
- Fossil Creek
These areas present great environmental and socially importance and could be used in tourism activities (Government of Nunavut, 2003). The study suggested the exploration of 3 concepts that would highlight the unique features around Coral Harbour:
- Southampton Heritage Rim Park (focus on wilderness and heritage)
- Duke of York Bay (focus on remote wilderness)
- Kirchoffer River (focus on the development of a community campground) (Government of Nunavut, 2003)
Although these areas were highlighted as having great potential, currently promoted tourism opportunities around Southampton Island include the Fossil Creek Trail, which contains the largest known concentration of marine fossils in Nunavut (Travel Nunavut, Website(a)). In addition, there are 2 recorded archeological sites on the island, Native Point and Ruin Point, which contain the remains of Thule settlements and can be toured by visitors (Travel Nunavut, Website(b)). Footnote 65 Native Point is one of the largest archaeological sites in Canada’s Arctic – it was once the principal settlement of the Sadlermiut prior to the tribe becoming extinct due to an epidemic that occurred in 1902 – 1903 (PRP Parks, 1987). While these current tourism destinations are highlighted by Travel Nunavut, the other areas explored in the feasibility study still hold significant value to the community of Coral Harbour. In addition, outfitting and guiding opportunities may utilize these areas when offering services to tourists.
Beyond the identified areas above, there are also a number of natural attractions throughout the AOI. The Island offers views of natural scenery and of various bird and marine and terrestrial mammal species. Further to environmental tourism, the communities in and around the AOI provide great potential for cultural tourism. tourists are seeking unique culturally accurate experiences and the daily activities (hunting, preparing skins, cooking traditional meals, sewing mitts/parkas, etc.) of the communities near the AOI could benefit from offering these experiences (Canadian Ecotourism Services, 2023).
Arts and crafts
The arts and crafts sector provides significant economic value to Nunavut and the Kivalliq Region. In 2010, it was estimated that about 3,000 to 4,000 Nunavut residents received some income from the sale of arts and that the artists received more than $27.8 M in direct revenue (Nordicity, 2010). In addition, it was estimated that from the sales of arts and crafts that there was more than $50 M in end consumer sales, with more than $30 M generated through retail sales outside of Nunavut (globally) (Nordicity, 2010). Spinoff impact from the sector created totaled $10.5 M and created about 240 more FTEs (Nordicity, 2010). The arts and crafts production generated about just under $1.6 M in added tax revenues for the Government of Nunavut (Nordicity, 2010). Total end consumer sales were estimated to be $52.1 M (Nordicity, 2010). Carvings, and presumably other arts and crafts, are purchased directly by community Co-op stores from local artists, and then Arctic Co-operatives Limited markets the art in both wholesale and retail markets, selling arts and crafts to art dealers, distributors, and the general public (Nordicity, 2010 and Hoover et al., 2013). Northern Images, the retail art marketing arm of Arctic Co-operatives, support and promotes northern artists and their products by marketing Inuit and Dene art and crafts in a Yellowknife gallery and the Northern Images website. The Northern Images website ships worldwide and has sculptures from Coral Harbour ranging from $120 to $3800 in price (Northern Images, Website). The Coral Harbour hamlet website also indicates that the community sells:
- sculptures
- wall hangings
- jewelry
- prints
- dolls (made of clay and dressed in traditional clothing)
As well, arts and crafts may be purchased within Coral Harbour at Leonie’s Craft Shop and at the Katudgevik Co-op store; in addition, local artists often will visit local hotels to meet with visitors and sell their art and crafts (Coral Harbour, Website).
Outfitting and guiding
Outfitting and guiding excursions are an important part of Arctic tourism and are a valued component of community level economies (DFO, 2022 and 2023a). The individuals and businesses that participate offer tours, guided hunts/fishing, and general support for tourists coming to the north. The Government of Nunavut provides a registry of licenced tourist establishments and outfitters. It is to note, that not all who provide outfitting or guiding services are found on this registry. From 2020 to 2023, 35 businesses and establishments owned by said businesses had registered with the Government of Nunavut (Annex 6). Footnote 66
Through community consultation and review of Coral Harbour’s community website, it is known that there are currently 9 outfitters offering outfitting/guiding services out of Coral Harbour (Coral Harbour, Website and DFO, 2023c). As previously mentioned, there is a popular sport hunt industry that brings international travelers to the AOI. From 2011-2021, individuals from 25 unique countries applied for a walrus sport hunt licence to hunt with Coral Harbour guides (see Annex 7 for total representation of international walrus sport hunt applications). Coral Harbour also has 2 companies offering tours including:
- dogsledding
- boating
- snowmobiling
- walrus and polar bear tours
- marine eco-tours
There are also many crafts persons and 3 shops offering traditional Inuit clothing, carvings, dolls, and jewelry (Coral Harbour, Website).
The community of Chesterfield Inlet offers fishing excursions for Arctic char, lake trout, lake whitefish, cod, and Arctic grayling, and offers hunting excursions for caribou. Additionally, Chesterfield Inlet offers beluga whale watching tours, Thule archaeology tours, walking tours of the community, caribou migration trips, bird watching expeditions and Canada geese migration trips (chesterfield-inlet.ca). As well, efforts to promote sport hunts for large game have occurred within the community; the Hamlet has provided guide training to try and increase awareness and interest in outfitting/guiding efforts (Canadian Ecotourism Services, 2023 and DFO, 2023a). In discussions with community members, DFO was made aware of a new outfitter/guide operating out of Chesterfield Inlet – this individual has yet to conduct a sport hunt but is preparing to do so (DFO, 2023a, and 2023c). Increasing sustainable tourism is a key community objective outlined in the Chesterfield Inlet Community Economic Development Plan for 2023 (Canadian Ecotourism Services, 2023).
Locally guided sport hunts are of great economic importance for Coral Harbour’s economy. Consultations with Coral Harbour community members highlighted that guides and assistants earn a significant amount of money from travelers who take part in a sport hunt. Additionally, these travelers contribute to the local economy by spending money in the area, thereby supporting Coral Harbor’s economy (DFO, 2022).
The 9 outfitters/guides out of Coral Harbour offers walrus, muskox, polar bear, and caribou hunts (DFO, 2023a). When consulting with guides, outfitters, and community members of Coral Harbour, it was found that guides conduct around 14 polar bear hunts per year, about 10 caribou hunts per year, and 8 Atlantic walrus hunts per year (DFO, 2022 and 2023a). However, when reviewing Atlantic walrus sport hunt allocations and licence approvals (Annex 7) it was determined that the 5-year average (2016 to 2021) saw an average of 13 licences issued to Coral Harbour. Depending on the hunt, the main guide typically hires 1 to 5 local individuals to assist the hunt. Each guide who answered a questionnaire indicated that the sport hunts are crucial for their families and would like to see opportunities for sport hunting to grow (DFO, 2022). However, guiding sport hunts takes anywhere from 40 to 120 hours per hunt, which can affect personal time and subsistence harvesting efforts of the guides (DFO, 2022). It is to note that guides sporadically offer services depending on various aspects such as demand for hunts, desire for more income, schedule, ability to conduct traditional hunts, among other reasons – the number of guides who conduct sport hunts may vary year-to-year.
Sport hunts for polar bear occur annually in the Duke of York Bay area and employ outfitters and guides from the community. The Duke of York Bay area includes important polar bear denning areas (Coral Harbour, 2011).
As an example of the value of sport hunting, based on a 2011 study (ÉcoRessources Consultants), the value of sport hunting for polar bear to a local outfitter, per hunt, adjusted for inflation averaged $12,600 (CAD, 2022) Footnote 67. The value for the hunter, per hunt, was $415 (CAD, 2022; ÉcoRessources Consultants, 2011). From 2014 to 2019 Coral Harbour outfitters successfully guided sport hunts for a total of 84 polar bears (Government of Nunavut, 2019). As rough proxy, polar bear sport hunting had a total estimated value of $1M for Coral Harbour outfitters for the 2014 to 2019 seasons.
Sport hunting guides are one of the key community suppliers of game meat, which they donate for consumption. However, some community members or Coral Harbour are concerned that some meat is possibly being wasted and not donated (DFO, 2022). Sport hunters also give in-kind donations to sport hunting guides, often in equipment such as guns and binoculars. Additionally, sport hunter guides can use the earnings from the hunts to purchase and maintain their often-expensive hunting equipment, which indirectly benefits the whole community (ÉcoRessources Consultants, 2011).
The walrus sport hunt can provide a large source of cash income for communities through the hiring of local guides, and sport hunters purchasing various services, such as food and accommodations. Sport hunters are permitted to keep the tusks, head and baculum of the walrus, but the meat stays within the community for community use (DFO, 2017b). Walrus are hunted for sport bringing economic benefit to Coral Harbour outfitters and guides (Coral Harbour, 2011). It is to note, that while Coral Harbour has been the only community in recent years to conduct a successful walrus Sport Hunt, a guide/outfitter in Chesterfield Inlet has begun operation and is interested in guiding sport hunts in future years (DFO, 2023a). In addition, the communities of Arviat and Naujaat have applied for walrus licences to the NWMB, however, the hunts never took place (see Annex 7 about the Walrus sport hunt). Lastly, no known outfitting or guiding activities have occurred by other communities within the AOI, however, this does not preclude that they have not done so in the past, only that there is no record of this activity taking place.
As another example of the value of sport hunting, a 2002 New York Times article stated that “After outfitters deduct booking fees, each hunt brings $3,500 to $4,100 to Igloolik, from which lead guides receive $1,200 to $1,750 and assistants receive $300 to $500” (New York Times, 2002). Footnote 68 Taking the average, converting it from 2002 USD to 2002 CAD Footnote 69 and accounting for inflation Footnote 70 it can be estimated as a rough proxy that the total value of the walrus hunt to Coral Harbour from 2016 to 2021 (excluding 2020) Footnote 71 was $371,000 ($74,000 per year) (Table 2). From 2016 to 2021, Coral Harbour had a 5-year average (excluding 2020) of 9 successful walrus sport hunts per year and 45 successful sport hunts in total (see Annex 7).
While difficult to break down to a community level, Seal skin products are worth an added $1 M to the arts and crafts sector in Nunavut (Government of Nunavut, 2017). It is likely communities that participate in these activities would receive some proportion of this benefit.
| 2021 | 2019 | 2018 | 2017 | 2016 | Total | Average | |
|---|---|---|---|---|---|---|---|
| Coral Harbour | $41,245 | $107,237 | $57,743 | $90,739 | $74,241 | $371,205 | $74,241 |
| Coral Harbour Guides | $15,738 | $40,920 | $22,034 | $34,625 | $28,329 | $141,646 | $28,329 |
| Coral Harbour Assistant | $4,342 | $11,288 | $6,078 | $9,552 | $7815 | $39,075 | $7,815 |
Source: data derived New York Times, 2002
Cruise ships
Most expedition cruise vessels operating in the Canadian Arctic are members of the Association of Arctic Expedition Cruise Operators (AECO). The backbone of AECO is the development of guidelines and standards, that all AECO members must abide by, which often go above regulatory requirements Footnote 72. AECO and the Government of Nunavut have signed a Memorandum of Understanding (MOU) to work together on cruise ship tourism in the territory. The MOU includes the delivery of Nalunaiqsijiit: the Inuit Cruise Training Initiative where Inuit from Nunavut which aims to increase Inuit involvement and employment in the expedition cruise industry by providing training in hard and soft skills, and a placement on board AECO member vessels, in cooperation with the Government of Nunavut. Additionally, the department provides training to communities — hamlets, artists, and various businesses — to prepare them to maximize benefits from cruise ship visits. The program is called Cruise Ready! and is delivered to 2 communities a year, based on demand. Data sharing protocols with the Government of Nunavut’s Department of Culture and Heritage are also part of the MOU.
Tourist and pleasure craft vessel traffic in the Canadian Arctic and Northwest Passage has increased substantially over the last few years (Johnston et al., 2016). Expedition cruise ships are included within the passenger vessel category; the number of cruise ships over the past 10 years within the Arctic has been trending upward. Ship itineraries in the Arctic from 2005 to 2013 have more than doubled (Dawson et al., 2014). Many of these itineraries include travel into the Northwest Passage to some degree (Johnston et al., 2016). In July 2023, the first cruise ship docked at the Port of Churchill since 2002 – the Silver Endeavour cruise ship, owned and operated by SilverSea Cruises, brought about 100 passengers to Northern Manitoba through Hudson Bay Footnote 73. In 2024, SilverSea Cruises plans to launch 4 cruises on the Silver Endeavour that will either depart or land at the Port of Churchill. The Silver Endeavour’s capacity is 220 guests and 207 crew (Silversea Cruises, Website). There is insufficient information to estimate both the number of participants stemming from recent cruise passages who have engaged in recreational and tourism activities, and the values of these activities within the AOI, however a few examples can provide a general “snapshot” of the value/expenditures of some activities. Adjusting for inflation, results from the Nunavut Visitor Exit Survey Final Report (Insignia Marketing Research Inc., 2016) developed for Nunavut Tourism, the average traveler (per person) in Nunavut would have spent Footnote 74 about $3,145 , not including airfare, for a 7-day trip. Of the $3,145, $1,803 was spent on packages and guide trips, $488 was spent on accommodations, $336 on restaurants/food, and $273 on art/carvings. Popular activities that travelers participated in (percentage wise) included:
- hiking
- visiting a cultural center
- overnight camping
- sport hunting or fishing
- wildlife or bird viewing
The survey estimated that 16,750 non-resident visitors visited Nunavut in 2015 and spent a total of $37.9 M, excluding airfare and cruise tickets (Insignia Marketing Research Inc., 2016), adjusting for inflation this value would be $45.9 M in 2022.The average cruise-based traveler (per person) in Nunavut spent about $838, not including cruise tickets and airfare, for a 7-day trip. Of the $838, $492 was spent on packages and guide trips, $18 was spent on accommodations, $18 on restaurants/food, $67 on entertainment, $80 on other shopping and souvenirs, and $70 on art/carvings. Popular activities that travelers participated in (percentage wise) included:
- visiting a cultural center
- going on a cruise or boat tour
- visiting elders
- browsing/purchasing art
- viewing northern lights
- wildlife or bird viewing (Insignia Marketing Research Inc., 2016)
Other tourism activities
The examples below provide some context on the value of wildlife viewing. It should be noted these examples are for geographical areas much larger than the AOI. The values attributed to the AOI would be a proportion of these examples.
Whitford (2006) identified a few operating tours focusing on narwhal viewing and calculated the costs of trips for narwhal viewing. The results based on interviews found that the trips were multi-day, and the cost of these tours were ranging from $5,995 (including airfare from Ottawa, Ontario) for a 9-day tour to $6,395 for a 16-day tour. The number of tourists was in the range of 8-30 per year. In Eastern Arctic, the total recreational value of narwhal viewing trips, both inclusive and non-inclusive (including airfare and accommodations), is estimated to be ranging from $ 500,000 to $ 550,000 annually. The gross margin was estimated to be about 35% of the total revenue for tour operators. Tours for special projects comprise of customized trips for scientific studies, photography, and television (DFO, 2011b).
The commercial value of walrus is largely associated with the tourism sector (Whitford, 2008). Using the travel cost approach and personal communications with operators of whale watching excursions in the Arctic, Whitford (2008) estimated the total recreational value of all-inclusive and non-inclusive (including airfare and accommodations) trips associated with walrus within the range of $429,000 - $437,000 annually. The relatively low numbers of whale watchers to northern Canada may be attributed to relatively high travel cost and operating costs of whale watching businesses in northern areas (Whitford, 2008).
Whitford (2006) estimated the total recreational value of all-inclusive (including airfare and accommodations) and non-inclusive trips associated with bowhead whale in the eastern Arctic within the range of $50K - $55K annually. Footnote 75
Recreational and tourism activities also provide spinoff economic benefits in and around communities as individuals or groups engaged in activities will spend money on accommodations, restaurants/food, supplies, transportation, etc. These expenditures create employment and income opportunities for residents. It is estimated that community-led tourism in Nunavut is currently valued at about $96 M (Awan et al., 2023).
Research activities
Coral Harbour is home to the Atmospheric Radionuclides Monitoring Station, which monitors radiation in the air and precipitation. In addition, there are several permanent research camps owned by Environment and Climate Change Canada on Southampton Island. These camps have ongoing research projects monitoring the ecology of various bird species and further monitoring radiation. Footnote 76 Scientific research is ongoing in and near the AOI, including:
- marine baseline data collection
- archeology
- oceanography
- other studies on marine and terrestrial animals
The 2 Migratory Bird Sanctuaries (MBS) on Southampton Island, Harry Gibbons and East Bay, both include marine components and are focal areas for avian research in the area.
Socio-economic benefits from research activities includes direct local employment (guides, observers, interpreters, sample collectors, etc.) and other spinoff benefits such as accommodations, flights, food, among others. One study found that from 2000 to 2009 that publicly funded research within the Yukon, Nunavut, and the Northwest Territories totaled an estimate of $284 M (Carr et al., 2013), adjusting for inflation this total can be approximated as $321 M in 2022. Footnote 77 In addition, communities gain a sense of oversight and understanding of the area through research outcomes. During consultations regarding the SHI AOI, community members from both Coral Harbour and Chesterfield Inlet expressed a desire for locally held and managed research data and an increased role in regional research (DFO, 2022 and 2023a).
Chesterfield Inlet, Coral Harbour, and Naujaat are all participating communities within the Sapujiyiit Society. The Sapujiyiit Society is an Inuit led organization that partners with various research institutions such as universities, privately operated organizations, not-for-profits, and government institutions to conduct community-based monitoring and research (Sapujiyiit Society, Website). The 3 pillars of the Sapujiyiit Society are:
- Guardians Monitoring Program
- Internal Research Programs
- Community Consultation Services (Sapujiyiit Society, Website)
The research efforts by the Sapujiyiit Society are a positive example of enhanced Inuit engagement and leadership in regional research activates.
Overview of ecosystem services
(See Matrix 1 for definitions.)
Ecosystem services
Ecosystem services Footnote 78 are indirect functions of the environment that provide valued goods and services used by people (Loomis et. al, 2000). These services include food and fibre, and fuel but also the largely unpriced services of clean air and clean water, natural hazard protection, pollination, and spiritual sustenance (World Resources Institute, 2008). An ecosystem’s economic value is generated by the combination of services provided by the ecosystem, which include:
- provisioning (for example, food)
- regulating (for example, climate regulation)
- cultural services
- in conjunction with capital (for example, investments, equipment, labour) (O’Garra, 2017)
The AOI provides invaluable direct and indirect services to society through maintaining ecosystems and biodiversity (NCRI, 2014). Direct services (for example, subsistence fishing) are captured with the corresponding direct benefits to the community.
It is harder to define the indirect services of ecosystems and biodiversity because they are much more intangible (Krantzberg and de Boer, 2006 and 2008). For example, the AOI provides clean, breathable air by regulating gases (for example, carbon dioxide) and protects the general maintenance of a habitable planet by regulating the local weather and climatic conditions of the region. These services are typically categorized in the literature as follows Footnote 79:
- gas regulation
- local climate regulation
- water regulation
- disturbance prevention
- soil formation/retention
- waste treatment
- nutrient cycling
- habitat
- refugium and nursery (Hayder, 2014) Footnote 80
In the Arctic Ocean, ecosystem services include water circulation and exchange, and gas and climate regulation. Vital ecosystem services in the Arctic include:
- fish and seafood
- primary production
- nutrient cycling
- carbon storage (Armstrong et. al., 2019)
Carbon storage comes into play as the warming climate reduces the earth’s amount of snow and ice. The warming of the polar seas causes the sea surface to be frozen less in winter and glaciers to retreat, creating more open, ice-free water. Less sea ice provides a longer growing season for marine plants called phytoplankton and removes more carbon, in the form of carbon dioxide, from the atmosphere. The growth of phytoplankton generates more food for animals that eat the algae and store this carbon through growth of their bodies. This carbon storage by marine life is called blue carbon. When marine animals perish, part of the blue carbon is buried in the seabed, and that carbon is removed from the carbon cycle. This trapping of carbon in the seabed or in other places is called sequestration (Barnes, 2020). Through a changing Arctic environment an escalation in absorption of carbon may be expected due to an increase in primary production and reduced ice cover. Currently there is a “blue carbon” initiative pushing for further recognition of the oceans as a climate mitigating environment providing vital regulating services for the wellbeing of humankind (Armstrong et. al., 2019). It should be noted however that increased carbon dioxide absorption by oceans has led to a shift in their chemistry, through increased ocean acidification. Ocean acidification can have potentially detrimental effects on marine ecosystems (Armstrong et. al., 2019). Potential future efforts in carbon reduction through a blue carbon approach may become an economic factor within the AOI – as of May 2022, there are no plans for any blue carbon economic activities within the geographic region of the AOI.
Emissions trading is a market-based tool to limit greenhouse gases. There is currently no market for carbon storage in the oceans, however values tied to carbon storage can be taken from carbon markets, national carbon taxes, or from estimates inferring the value of stored carbon (or the costs of carbon to society) (Armstrong et. al., 2019). As an illustrative example, one valuation paper tried to estimate the annual value of carbon storage in the Arctic Ocean based on the 2019 market price of 19.42 Euros per tonne of greenhouse gas (Armstrong et. al., 2019).
The AOI contains a large diversity of marine mammals such as:
- bowhead whales
- beluga whales
- narwhals
- seals
- walrus
- polar bears
It also supports seabirds, fish, and waterfowl (NCRI, 2014). The Southampton Island EBSA is a migration corridor for beluga, bowhead, and narwhal as they move between overwintering areas in:
- Hudson Strait
- Labrador Sea
- Ungava Bay
To:
- coastal waters of Western Hudson Bay
- regions near Repulse Bay, Lyon Inlet, Foxe Basin, and Frozen Strait
The migration of these marine species through the AOI may benefit those who partake in marine mammal subsistence harvests within the AOI, in particular for Coral Harbour and Chesterfield Inlet. In addition to the food value of subsistence harvests, they also provide communities the opportunity to:
- pass down Inuit Traditional Knowledge
- share country food and experiences
- help continue general Inuit culture (Newell, 2018)
It is not possible to quantify the monetary value of the ecosystem services related to the AOI in this report due to a lack of data, a viable method that is applicable to the unique ecosystem of the AOI, or coherent approach suggested in the extant literature. While it is not possible to estimate and place any monetary values on ecosystem services, the study included a qualitative discussion of the ecosystem services to highlight the importance of such ecosystem services provided by the study area.
Option value
Neither economic theory nor empirical literature provides adequate information to quantify the option value Footnote 81 of future use of the resources of the AOI (for example, possibility of commercial/recreational fishing in the future) (Hayder, 2014). However, it should be noted that assets with less perfect substitutes are likely to have larger option values to make up the difference in value (Marbek, 2010). The AOI and associated unique biodiversity characteristics might be a case in point.
Non-use value
Non-use values Footnote 82 are the values people derive from a good or resource, independent of any use people might make from that good/resource, including the conservation of the ecosystem for future generations (for example, future biodiversity) also known as bequest value and existence value arising from people intrinsically valuing the existence of the ecosystem regardless of its use. Footnote 83 Existence value includes the benefits from knowing that the resources are being used by others and cultural values for an economy.
Coral Harbour, Chesterfield Inlet, nearby communities, and people residing elsewhere in Canada derive substantial non-use value from the services provided by the area. As an example, O’Garra (2017) estimated the annual value per capita existence value for beluga whale populations as $96 (2016 $US), for Arctic nations with beluga populations. The same study also estimated the annual value per capita existence value for polar bear populations as $317 (2016 $US) for Canadian residents.
The examples below provide some context on the value of non-use values for marine mammals. It should be noted these examples are for geographical areas much larger than the AOI. The values attributed to the AOI would be a proportion of these examples.
Whitford (2006) examined Loomis and White’s (1996) metaanalysis of U.S. households’ willingnesstopay (WTP) studies for Pacific endangered species and whales and the work of others. Whitford argued that the Loomis and White’s estimate of US$43 per household represented an acceptable estimate of the average WTP for conservation of some whale species and suggested that Canadian households’ WTP for Bowhead whales be in the order of CDN$495 M. Here it should be noted that the work referenced by Whitford (2006) was focused on a number of whale species and, therefore, should be used with caution. A conservative approach would be to use the CDN$495 M estimate as a benchmark for Canadians’ willingness to support conservation efforts for all whales including narwhal (DFO, 2011b).
Applying the formula used by Whitford (2008) to a willingness-to-pay value ($44 per Household), the present analysis estimates the total existence value of walrus in the amount of $802.9 M in Canada in 2021. Footnote 84 Walrus also provides significant benefits to society in terms of science exploration and research through direct and indirect research funding and through partnerships and consortiums (Whitford, 2008 and DFO, 2013a).
Other uses for the AOI have been identified through consultation, such as:
- camping
- participating in the local spring fishing derby
- boating
- ATV riding
- sightseeing
- jigging for fish
- mussel picking
- berry picking
- clothes making
Each activity was underscored by the cultural significance of traditional ways of life through:
- subsistence needs
- material making
- the transfer of knowledge between generations (DFO, 2022)
These activities were reported to provide health benefits to participants, including benefits such as, enhanced mental and emotional well-being, and a sense of fulfillment (DFO, 2022).
Although a few studies have estimated non-use values for different areas in Canada using direct stated preference methods (contingent valuation, discrete choice experiments), the non-use value for the AOI has not been studied so far. Neither has there been any study that could serve as proxy values for the area. Despite the challenge to capture the benefits of non-use values, it may be noted that even if non-use values of the attributes within the AOI might be insignificant at the individual level within the communities, aggregated values for an entire economy may likely be significant.
Overview of social and cultural values
Dr. Fikret Berkes, a marine ecologist, defines Traditional Ecological Knowledge (TEK) as culture and knowledge, continuously being passed on through historical and current experiences on land and water by Indigenous peoples (DFO, 2008). Inuit, First Nations, Métis and other long-term coastal community-based gatherers represent a shared, yet different collective body of knowledge combining, environmental, cultural, social, and economic elements (DFO, 2008).
Inuit Qaujimajatuqangit (IQ) is often translated to Inuit Traditional Knowledge, a source of information and wisdom based on historical observations and experiences by Inuit, which occurred through oral conversations and discussions (Parks Canada Agency, 2018). Donald Uluadluak Sr. and Gwen Frankton (Government of Nunavut, 2007) note that Inuit carried and guided IQ values, knowledge and skills that are continuously being passed on from previous generations to build and lead children towards independence and preparation by experiencing various life challenges. An essential aspect of IQ is that it is continuously being passed on. Inuit use of the marine area around Southampton Island in Hudson Bay makes it possible for this to happen.
Specific values and priorities within the AOI were identified, described, and mapped at a Southampton Island IQ Workshop held in February 2020.
The AOI provides considerable subsistence, social, cultural, and spiritual benefits to regional residents. It contributes significantly to the economy. No comprehensive quantitative information/data was available on such benefits derived from the AOI. However, this section presents a qualitative discussion of the socio-cultural values of the AOI.
There are 2 archaeological sites on the island, Native Point and Ruin Point, which contain the remains of Thule settlements.
Inuit traditional use, including subsistence harvesting, takes place in the AOI. Marine mammals and other marine resources are abundant and they are relied upon for traditional use, including:
- walrus
- seal web info hub
- bowhead
- beluga
- narwhal
- clams
- mussels
- kelp
- seabirds and their eggs
For people living in the Arctic, hunting, gathering, fishing, and processing of food are a vital part of social, cultural, and economic life in the North (Berkes et al., 2005). Having access to and eating wild food is important for cultural values. An example of important cultural values includes distributing subsistence harvests to relatives and neighbours (Berkes et al., 2005). Country food is quite valuable to communities because it is:
- accessible
- acceptable
- nutritious
- affordable (Berkes et al., 2005)
Some benefits of the subsistence harvest include:
- improving individual and community health
- food security
- strengthening social connections
- supporting cultural values and practices (Government of Nunavut, 2016)
Coral Harbour community members expressed the need and desire to educate younger generations on traditional practices and natural resource monitoring (DFO, 2022).
Beluga harvesting provides:
- traditional harvesting skills
- the transfer of traditional knowledge
- the preservation of cultural identity (Symbion Consultants, 2009)
The narwhal hunt and sharing of the proceeds continue to be of social and cultural significance to communities. Hunting and sharing of its proceeds among community members not only ensure future cooperation but also strengthen relationships between people in a community. Globally, there is a great deal of interest in the narwhal as it is seen as a mythical animal because of its unique “unicorn” tusk (DFO, 2011b).
The bones of narwhal are used for carving, sinews are used for sewing thread, and skin is used for laces. Narwhal tusks are used for making handicrafts for traditional medicine. They are also used for making tent poles, walking sticks, and the manufacture of hunting equipment. The mattaaq can be:
- directly consumed
- shipped to other communities
- sold to businesses (DFO, 2011b)
A successful walrus and bowhead whale hunt is celebrated by traditional songs/dances, consumption of edible portions of animal strengthens physical and spiritual health, and bones are used for carvings and jewelry (Whitford, 2008; DFO, 2013a; and DFO, 2013b). Footnote 85
Joining in walrus and bowhead hunting, sharing of the 2 species proceeds and knowledge between older and younger generations among community members not only ensure future cooperation but also strengthen kinship ties and community cohesion (DFO, 2013a and DFO, 2013b).
Bibliography
- $1.2B Nunavut to Manitoba road would be a "tough sell" | CBC News
- 2016_draft_nunavut_land_use_plan_0.pdf
- A Big Game - The New York Times
- Aarluk Consulting Inc. (2005). Review of Intersettlement Trade Opportunities for Arctic Food Products in Nunavut, Final Report. Presented to the Department of Environment, Government of Nunavut. May 2005.
- Aarluk Consulting Inc. (2010). Infrastructure for a Sustainable Cape Dorset (Kinngait). Vol. 2 Consultation Report. Prepared for the Government of Nunavut.
- Aarluk Consulting Inc. (2010). Infrastructure for a Sustainable Coral Harbour. Vol. 2 Consultation Report. Prepared for the Government of Nunavut.
- Aarluk Consulting Inc. (2010). Infrastructure for a Sustainable Chesterfield Inlet. Vol. 2 Consultation Report. Prepared for the Government of Nunavut.
- Aarluk Consulting Inc. (2010). Infrastructure for a Sustainable Rankin Inlet. Vol. 2 Consultation Report. Prepared for the Government of Nunavut.
- Aarluk Consulting Inc. (2010). Infrastructure for a Sustainable Repulse Bay. Vol. 2 Consultation Report. Prepared for the Government of Nunavut.
- About Us | WOODWARD GROUP OF COMPANIES - Woodward Group of Companies
- Above and Beyond. (2019). Canada’s Arctic Journal, June 2019.
- Aglu Consulting and Training Inc. (2022). Agnico Kivalliq Projects. 2021 Socio-Economic Monitoring Report.
- Agnico Eagle Mines Limited - Investor Relations
- Agnico Eagle Mines Limited, Meadow Bank Division. (2018). Whale Tail Pit: Shipping Management Plan. Version 2.
- Agnico Eagle Mines Limited. (2019). Meliadine Gold Mine: Shipping Management Plan. Version 8.
- Agnico Eagle Mines Limited. (2023). Agnico Eagle Reports Fourth Quarter and Full Year 2022 Results – Larger Asset Portfolio Drives Record Annual Gold Production, Operating Cash Flow and Global Mineral Reserves; Updated Three Year Guidance Provided; 2023 Focus on Optimizing Detour Lake and Canadian Malartic and Leveraging Excess Mill Capacity in the Abitibi Region to Advance Key Pipeline Projects. Agnico Eagle News Release. February 16, 2023.
- Application for Major Project Permit
- Arctic Council. (2009). Arctic Marine Shipping Assessment 2009 Report.
- Arctic Fibre says takeover by Alaskan company won't affect plans for Nunavut broadband | CBC News
- Arctic Region Variation Order 2023-001
- Arctic sealift
- Arctic Today
- Armstrong, C.W., NS. Foley, D., Slagstad, M. Chierici, I. Ellingsen and M. Reigstad. (2019). Valuing Blue Carbon Changes in the Arctic Ocean. Frontiers in Marine Science. June 25, 2019.
- Ashley, B. (2002). Edible Weights of Wildlife Species used for Country Food in the Northwest Territories and Nunavut. Wildlife and Fisheries Division, Department of Resources, Wildlife and Economic Development, Government of the Northwest Territories, Yellowknife, NWT. Manuscript Report No. 138.
- Auryn Resources Commences Drilling at Committee Bay and Exploration at Gibson MacQuoid Greenstone Belt - Junior Mining Network
- Awan, T., Twigg, M., Sushant, and Desrochers, C. (2023). Inuit-led Economic Development: An Overview of Nunavut’s Blue Conservation Economy. Smart Prosperity Institute.
- Babb, D., Krillov, S., Kuzyk, Z., Nestor, T., Liesch, J., Kamula, C.M., Zagon, T., Barber, D., and Ehn, J. (2022). On the Intermittent Formation of an Ice Bridge (Nunniq) across Roes Welcome Sound, Northwestern Hudson Bay, and Its Use to Local Inuit Hunters. Arctic.
- Baffinland asks Nunavut board to postpone final public hearing on Mary River expansion
- Baffinland Iron Mines Corporation. (2023). Mary River Project, 2022 NIRB Annual Report, Appendix G.7, Socio-Economic Reports.
- Barnes, D. (2020). What is Blue Carbon and Why Is It Important? Frontiers For Young Minds. The Earth and Its Resources. February 4, 2020.
- Berkes, F., Fast, H., Manseau, M., and Diduck, Al. (2005). Breaking Ice: Renewable Resource and Ocean Management in the Canadian North. University of Calgary Press.
- Building Nunavut Together.
- Calm Air : Cargo Products
- Canada Gazette. (2022). Canada Petroleum Resources Act. Order Prohibiting Certain Activities in Arctic Offshore Waters, 2022: SOR/2022-274. Canada Gazette, Part II, Volume 157, Number 1.
- Canadian Ecotourism Services. (2023). Chesterfield Inlet Community Economic Development Plan, Moving Forward with Socio-Economic Solutions.
- Canadian Mortgage and Housing Corporation (CMHC). (2022). Housing Market Information. Indigenous and Northern Housing, Canadian Mortgage and Housing Corporation.
- Carr, K., Natcher, D.C., Olfert, R. (2013). Measuring the economic impact of publicly funded research in Northern Canada. Polar Geography, p. 291-304. DOI: 10.1080/1088937X.2013.826746
- Census Profile, 2021 Census of Population
- Chamber of Marine Commerce - Marine delivers our exports to the world – List of Arctic Goods 2019
- Chan, H. M., Fediuk, K., Hamilton, S., Rostas, L., Caughey, A., Kuhnlein, H., and Loring, E. (2006). Food security in Nunavut, Canada: barriers and recommendations. International journal of circumpolar health, 65(5), 416-431.
- Chesterfield Inlet
- Chesterfield Inlet mayor pitches deep-sea port to ease effects of increased shipping
- Churchill port on two-year hiatus - Manitoba Co-operator
- CIRNAC. (2016). Northern Oil and Gas, Annual Report, 2016. Prepared by Crown-Indigenous Relations and Northern Affairs Canada.
- CIRNAC. (2022). Northern Oil and Gas, Annual Report, 2022. Prepared by Crown-Indigenous Relations and Northern Affairs Canada.
- Co-Management Working Group. (2016). Nunavut Polar Bear Co-Management Plan.
- Coral Harbour – Community Website
- Coral Harbour - Travel Nunavut
- CORAL HARBOUR, NU - Northern Images
- Coral Harbour. (2011). Duke of York Bay Land Use Strategy. March 2011.
- COSEWIC. (2006). COSEWIC Assessment and Update Status Report on the Atlantic Walrus (Odobenus rosmarus rosmarus) in Canada. Ottawa: COSEWIC.
- Council of Canadian Academies. (2014). Aboriginal food security in Northern Canada: An assessment of the state of knowledge. Ottawa, ON: The Expert Panel on the State of Knowledge of Food Security in Northern Canada, Council of Canadian Academies.
- Country Food Distribution Program | Government of Nunavut
- Dawson, J., Johnston, M., and Stewart E. (2014). Governance of Arctic expedition cruise ships in a time of rapid environmental and economic change. Ocean and Coastal Management, Volume 89, Pages 88-99.
- Department of Executive and Intergovernmental Affairs | Government of Nunavut
- Desgagnés - Au coeur de la marine marchande canadienne
- Dewing, K.E., Lister, C.J., King, L.E., Atkinson, E.A., King, H.M., Kalejaiye, A.M., Krakowka, A. (2023). Hydrocarbon resource assessment of Hudson Bay, Geological Survey of Canada, Open File 8989.
- Doniol-Valcroze, T., Gosselin, J.-F., Pike, D.G., Lawson, J.W., Asselin, N.C., Hedges, K., and Ferguson, S.H. (2020). Distribution and abundance of the Eastern Canada-West Greenland bowhead whale population based on the 2013 High Arctic Cetacean Survey. NAMMCO Scientific Publications 11.
- Drummond, K.J. (2009). Northern Canada Distribution of Ultimate Oil and Gas Resources. Indian and Northern Affairs Canada.
- ÉcoRessources Consultants. (2011). Evidence of the Socio-Economic Importance of Polar Bears for Canada. Prepared for Environment Canada.
- Evans, M. S., Muir, D. C., Keating, J., and Wang, X. (2015). Anadromous char as an alternate food choice to marine animals: a synthesis of Hg concentrations, population features and other influencing factors. Science of the Total Environment, 509, 175-194.
- Evolution of subsistence and commercial Inuit fisheries in the Territory of Nunavut, Canada
- Feds say no to Kiggavik uranium mine, back Nunavut Impact Review Board | CBC News
- Find a Luxury Cruise among 900 Destinations | Silversea
- Fisheries and Oceans Canada, Ecosystems and Fisheries Management. (2008). Traditional Ecological Knowledge Strategy for Oceans Management.
- Fisheries and Oceans Canada. (2002). Atlantic Walrus. Stock Status Report. E5-17, 18, 19, 20.
- Fisheries and Oceans Canada. (2011a). Identification of Ecologically and Biologically Significant Areas (EBSA) in the Canadian Arctic. DFO Can. Sci. Advis. Sec. Sci. Advis. Rep. 2011/055.
- Fisheries and Oceans Canada. (2011b). Socio-Economic Analysis of the Baffin Bay Narwhal for the Integrated Fisheries Management Plan. Prepared by Policy and Economics Branch, Central and Arctic Region.
- Fisheries and Oceans Canada. (2013a). Socio-Economic Analysis of the Atlantic Walrus for the Integrated Fisheries Management. Prepared by Policy and Economics Branch, Arctic Region.
- Fisheries and Oceans Canada. (2013b). Socio-Economic Analysis of the Bowhead Whale for the Integrated Fisheries Management Plan. Prepared by Policy and Economics Branch, Arctic Region.
- Fisheries and Oceans Canada. (2015). Abundance estimates of narwhal stocks in the Canadian High Arctic in 2013. DFO Can. Sci. Advis. Sec. Sci. Advis. Rep. 2015/0.46.
- Fisheries and Oceans Canada. (2016). Framework for Integrating Socio-Economic Analysis in the Marine Protected Areas Designation Process. Economic Policy and Research. Economics Analysis and Statistics Directorate. Ottawa.
- Fisheries and Oceans Canada. (2017a). Socio-economic Analysis of Narwhal in Admiralty Inlet, Eclipse Sound. Prepared by Policy and Economics Branch, Arctic Region.
- Fisheries and Oceans Canada. (2017b). Integrated Fisheries Management Plan for Atlantic Walrus (Odobenus rosmarus) in the Nunavut Settlement Area.
- Fisheries and Oceans Canada. (2018). Harvest advice for eastern and western Hudson Bay Beluga (Delphinapterus leucas). DFO Can. Sci. Advis. Sec. Sci. Advis. Rep. 2018/008. (Erratum: September 2020)
- Fisheries and Oceans Canada. (2020). Supplement to the Biophysical and Ecological Overview for Southampton Island (SI) EBSA to include Additional Areas within the Southampton Island Area of Interest (AOI). Canadian Science Advisory Secretariat Science Response, Ecosystems and Oceans Science. Ontario and Prairie Region.
- Fisheries and Oceans Canada. (2022). Southampton Island Area of Interest Public Consultation Findings – Coral Harbour. August 24, 2022. Unpublished Document.
- Fisheries and Oceans Canada. (2023a). Southampton Island Area of Interest Public Consultation Findings – Chesterfield Inlet. August 22-23, 2023. Unpublished Document.
- Fisheries and Oceans Canada. (2023c). Record of Discussion – Local Expert Review of Southampton Island Area of Interest (AOI) Ecological Risk Assessment. March 21 – 24, 2023, Rankin Inlet, NU, Canada.
- Freeman, M.M.R., and G.W. Wenzel. (2006). The nature and significance of polar bear conservation hunting in the Canadian Arctic. Arctic 59(1): 21-30.
- Garneau announces $45.5 million expansion of Rankin Inlet airport, funds for Kivalliq all-season road study - Nunavut News
- Gavrilchuk, K., and Lesage, V. (2014). Large-scale marine development projects (mineral, oil, and gas, Infrastructure) proposed for Canada’s North. Can. Tech. Rep. Fish. Aquat. Sci. 3069: vii + 84 pp.
- GeoVector Management Inc. (2022). Mineral Potential Assessment of the Kivalliq Region for the Kivalliq Inuit Association. March 31, 2022.
- GeoVector Management Inc.(2020). Mineral Prospectivity Assessment of the Kivalliq Region. Prepared for the Kivalliq Inuit Association and Gestion Anbaric Canada Inc.
- Government of Nunavut. (2003). Feasibility Study for Attraction Development at Coral Harbour, Background Resource Analysis. Submitted to Design and Capital Planning Department of Sustainable Development, Government of Nunavut.
- Government of Nunavut. (2012). Department of Economic Development and Transportation.
- Government of Nunavut. (2016). Nunavut Fisheries Strategy: 2016-2020. Department of Environment, Fisheries and Sealing Division.
- Government of Nunavut. (2017). Sustainable Sealing in a Traditional Economy, Department of Environment, Fishing and Sealing Division.
- Government of Nunavut. (2019). Overview of the Nunavut Polar Bear Harvest for 2017/2018.
- Government of Nunavut. (2023). Budget 2023-24 Fiscal and Economic Indicators. Department of Finance, Government of Nunavut.
- Gross domestic product (GDP) at basic prices, by sector and industry, provincial and territorial
- Gross domestic product, 2022: An in-depth look at provincial and territorial economies
- Guy, E., and Lasserre, F. (2016). Commercial shipping in the Arctic: new perspectives, challenges and regulations. Polar Record, online version.
- Hammill, M.O., Mosnier, A., Gosselin, G.-F., Matthews, C.J.D., Marcoux, M., and Ferguson, S.H. (2017). Management Approaches, Abundance Indices and Total Allowable Harvest Levels of Belugas in Hudson Bay. Canadian Science Advisory Secretariat, Fisheries and Oceans Canada, Ecosystems and Oceans Science, Research Document, 2017/062, Quebec Region.
- Hay, K., Aglukark, D., Igutsaq, D., Ikkidluak, J., and Meeka, M. (2000). Final Report of the Inuit Bowhead Knowledge Study, Nunavut Canada. Nunavut Wildlife Management Board, March 2000.
- Hayder, S. (2014). Socio-Economic Impact of the Presence of Asian Carp in the Great Lakes Basin. DFO/2014-1919, Cat No. Fs23-600/2014E-PDF, ISBN 978-1-100-23178-5.
- Higdon, J.W., Young, B.G., and Ferguson, S.H. 2023. Evaluation of a Provision to Carry Over Unused Licences for Eastern Canada-West Greenland Bowhead Whales (Balaena mysticetus) in Canada. DFO Can. Sci. Advis. Sec. Res. Doc. 2023/051. iv + 23 p
- HIS Markit. (2017). Vessel Accumulation and Cargo Value Estimation.
- Home - Qikiqtaaluk Corporation
- Home - Travel Nunavut
- Home | Nukik Corporation
- Hoover, C., Bailey, M., Higdon, J., Ferguson, S., and Sumaila, R. (2013). Estimating the Economic Value of Narwhal and Beluga Hunts in Hudson Bay, Nunavut. Arctic (Journal), Vol 66, 1 P. 1-16. DOI: 10.14430/arctic4261
- Hoover, C., Ostertag, S., Hornby, C., Parker, C., Hansen-Craik, K., Loseto, L.L., and Pearce, T. (2016). The importance of Hunting for Hunting for Future Inuit Food Security. Solutions 7(4): 40-51.
- Idlout, L. 2020. Southampton Island area of interest: Assessment phase Inuit Qaujimajatuqangit workshop. NVision Insight Group Inc. report submitted to Fisheries and Oceans, Marine Planning and Conservation.
- Infrastructure in Nunavut. What we have and what we need. Nunavut Mining Symposium. April 17, 2012.
- Insignia Marketing Research Inc. (2016). Nunavut Visitor Exit Survey 2015 Final Report. Prepared for Nunavut Tourism.
- Inuit Qaujimajatuqangit Education Framework.
- Johnston, M., Dawson, J., De Souza, E., and Stewart E. (2016). Management challenges for the fastest
- Kahuna - Kodiak Copper Corp.
- Keewatin Meat and Fish Ltd. (1994). Test Commercial Scallop Fishery at Chesterfield Inlet, NWT. Report submitted to the Government of the Northwest Territories/Canada Economic Development Agreement. 10 p.
- Kennedy, J. (2010). Social, Economic and Cultural Overview. Foxe Basin Area of Interest (AOI).
- KHFL Release May 4 FINAL
- Kivalliq Arctic Foods | Nunavut Development Corporation
- Kivalliq hunters want more tags for polar bear hunts | CBC News
- Kivalliq Inuit Association and Agnico Eagle Mines Limited. (2017b). Meadowbank – Inuit Impact and Benefit Agreement between the Kivalliq Inuit Association and Agnico Eagle Mines Limited. Meadowbank-IIBA-2017-02-17.pdf (kivalliqinuit.ca)
- Kivalliq Inuit Association. Website. Accessed December 2017. About the Kivalliq Region of Nunavut, Canada.
- Krantzberg, G., and de Boer, C. (2006). A Valuation of Ecological Services in the Great Lakes Basin Ecosystem to Sustain Healthy Communities and a Dynamic Economy. Dafasco Centre for Engineering and Public Policy. McMaster University. Prepared for the Ontario Ministry of Natural Resources. Hamilton: Ontario.
- Krantzberg, G., and de Boer, C. (2008). A Valuation of Ecological Services in the Laurentian Great Lakes Basin with an Emphasis in Canada. Climate Change/Environmental Issue. Journal AWWA 100:6.
- Loewen, T.N., Hornby, C.A., and Hydesmith, E. (2020b). Summary data for species that occur, or potentially occur, in the Southampton Island Ecologically and Biologically Significant Area. Can. Data Rep. Fish. Aquat. Sci. 1308: vii + 75 p.
- Loewen, T.N., Hornby, C.A., Johnson, M., Chambers, C., Dawson, K., MacDonell, D., Bernhardt, W., Gnanapragasam, R., Pierrejean, M., and Choy, E. (2020a). Ecological and Biophysical Overview of the Southampton Proposed Area of Interest for the Southampton Island Ecologically and Biologically Significant Area. DFO Can. Sci. Advis. Sec. Res.: 2020/032. vi + 96 p.
- Loomis, J. and White, D. (1996). Economic Benefits of Rare and Endangered Species: Summary and Meta-Analysis. Ecological Economics, 18, p197-206.
- Loomis, J., Kent, P., Strange, L., Fausch, K., Covich, A. (2000). Measuring the total economic value of restoring ecosystem services in an impaired river basin: results from a contingent valuation survey. Ecological Economics, Volume 33, pages 103-117.
- Loring, E. (1996). The Cost-Benefit Relations of Modern Inuit Hunting: The Kapuivmiut of Foxe Basin, N.W.T. Canada. MA Thesis, Department of Geography, McGill University, Montreal, Quebec, Canada. 98 pp.
- Maerospace (Corp.). (2019). Spatial Analysis of Vessel Traffic in the Canadian Arctic: Southampton Island AOI. Submitted to Canadian Space Agency.
- Maerospace (Corp.). 2020. Spatial analysis of vessel traffic in the Canadian Arctic Southampton Island AOI. Contract No. 9F013-160288/001/MTB; TAR: 0003. Rep. by Maerospace Corp., Waterloo, ON for Canadian Space Agency, St. Hubert, Quebec. 46 p.
- Manitoba shipping company signs agreement with Hudbay Minerals to ship products through Port of Churchill
- Marbek. (2010). Assessing the Economic Value of Protecting the Great Lakes – Literature Review Report. Prepared for Ontario Ministry of the Environment.
- Matthews, C.J.D., Watt, C.A., Asselin, N.C., Dunn, J.B., Young, B.G., Montsion, L.M., Westdal, K.H., Hall, P.A., Orr, J.R., Ferguson, S.H. and Marcoux, M. 2017. Estimated abundance of the Western Hudson Bay Beluga stock from the 2015 visual and photographic aerial survey. DFO Can. Sci. Advis. Sec. Res. Doc. 2017/061. v + 20 p
- Meliadine Project – Inuit Impact and Benefit Agreement between the Kivalliq Inuit Association and Agnico Eagle Mines Limited.
- Millennium Ecosystem Assessment, (2005). Ecosystems and Human Well-being: Synthesis. Island Press, Washington, DC.
- Mineral Exploration, Mining and Geoscience Overview 2009.
- Mineral Exploration, Mining and Geoscience Overview 2013.
- Mineral Exploration, Mining and Geoscience Overview 2016.
- Mineral Exploration, Mining and Geoscience Overview 2018.
- Mineral Exploration, Mining and Geoscience Overview 2020.
- Mineral Exploration, Mining and Geoscience Overview 2021.
- Mineral Exploration, Mining and Geoscience Overview 2022.
- Morse, M., McCauley, D., Orofino, S., Stears, K., Mladjoy, S., Caselle, J., Clavelle, T., Freedman, R. (2024). Preferential selection of marine protected areas by the recreational scuba diving industry. Marine Policy, 2024; 159:105908 DOI:10.1016/j.marpol.2023.105908
- Mosnier, A., Matthews, C.J.D. and Hammill, M.O. 2023. Abundance estimate of the Hudson Bay–Davis Strait walrus (Odobenus rosmarus rosmarus) stock from aerial surveys flown in September 2017. DFO Can. Sci. Advis. Sec. Res. Doc. 2023/063. iv + 17 p.
- MTO (Municipal Training Organization). (2005). Nunavut Municipal Councillors Handbook 2005.
- Narwhal (Monodon monoceros)
- NCRI (Nunavut Coastal Resource Inventory). (2014). Coral Harbour Coastal Resource Inventory.
- NEAS
- Newell, S.L. 2018. Social, Cultural, and Ecological Systems’ Influence on Community Health and Wellbeing. Doctorate Thesis. McMaster University.
- Nishi-Khon and SNC Lavalin. (2010). The Case for the Nunavut Manitoba Highway (Nunavut-Manitoba All-Weather Road Business Case), Building Lasting Infrastructure – Submitted to: Nunavut Department of Economic Development and Transportation and Manitoba Infrastructure and Transportation. Final Report. February 2010.
- Nordgold • Nordgold
- Nordgold. (2022). Norgold transfers Pistol Bay project in Canada to BG Gold Capital. Media Release. December 30, 2022. Nordgold transfers Pistol Bay project in Canada to BG Gold Capital • Nordgold
- Nordicity Group and Uqsiq Communications. (2010). Economic Impact Study: Nunavut Arts and Crafts, Final Reports, Submitted to: Government of Nunavut – Department of Economic Development and Transportation.
- North Arrow Minerals | Projects
- Northern Energy Capital (NEC). (2022a). Coral Harbour Solar Project – Solar Glare Hazard Analysis Report. Produced by greencat Renewables for Northern Energy Capital.
- Nunami. (2008). Report of Duke of York Bay Access Trail. Prepared for: Hamlet of Coral Harbour, Coral Harbour, Nunavut. Prepared by: Nunami Jacques Whitford Limited, Rankin Inlet, Nunavut. March 2008.
- Nunatsiaq News: Solar power project proposed for Coral Harbour
- Nunavut Airports, 20-Year Capital Needs Assessment Update, 2020 -2024.
- Nunavut Community Aquatic Monitoring Program (N-CAMP). N-Camp in Coral Harbour.
- Nunavut devolution
- Nunavut furs fetch record-high prices at recent auction
- Nunavut Small Craft Harbours Report.
- Nunavut Tunngavik Incorporated. (2020). Nunavut’s Infrastructure Gap. Nunavut Tunngavik Incorporated, Iqaluit.
- Nunavut Wildlife Management Board. (2015). Re: Revised Nunavut Wildlife Management Board decisions regarding the total allowable harvest of bowhead whales and an extension for a Nunavut Wildlife Management Board decision made during In-Camera Meeting 009-2014 (September 2014). January 26, 2015, letter from NWMB to the Honourable Gail Shea, Minster of Fisheries and Oceans. Iqaluit, NU.
- O’Garra, T. (2017). Economic value of ecosystem services, minerals and oil in a melting Arctic: A preliminary assessment. Ecosystem Services, Volume 24, pages 180-186.
- Orano. (2022). Orano Canada Inc., Kiggavik Project Field Program, 2021 Annual Report. 21-CND-92-01. January 2022.
- Parent, G.J, Mosnier, A., Montana, L., Cortial, G., St-Pierre, A.P., Bordeleau, X., Lesage, V., Watt, C., Postma, L., and Hammill, M.O. 2023. Re-examining populations of beluga in the Hudson Bay-Strait Complex and assessing the impact on harvests in Nunavik and Sanikiluaq management units. DFO Can. Sci. Advis. Sec. Res. Doc. 2023/004. iv + 31 p.
- PB_HARVEST TABLE_2017-2018.xlsx
- Polar Bear Hunt Economic Study.pdf
- Precambrian bedrock geology, Southampton Island, Nunavut - NRCan Open S&T Repository
- Priest, H., and Usher, P. J. (2004). The Nunavut wildlife harvest study. Nunavut Wildlife Management Board, Iqaluit, Nunavut, Canada, p. 822.
- Prime Minister of Canada. (2016). United States-Canada Joint Arctic Leaders’ Statement. December 20.
- Procter, R.M., Taylor, G.C., and Wade, J.A. (1984). Oil and Natural Gas Resources of Canada. Geological Survey of Canada, Paper 83-31, 59 p.
- Project | Nunavut Impact Review Board
- PRP Parks: Research and Planning Inc. (1987).Native Point Historic Site, Development Plan. PRP Parks: Research and Planning Inc. March 1987.
- Qaiqtuq Gold Project | Solstice Gold Corporation
- Qulliq Energy Corp proposes $74 million to build new power plants in Kugaaruk and Chesterfield Inlet - Nunavut News
- Roff, J.C., Giangioppi, M., Gerhartz-Abraham, A., Merritt, W., James, T.D., Keenan, E., and Davidson, E. 2020. Marine Ecological Conservation for the Canadian Eastern Arctic–A Systematic Planning Approach for Identifying Priority Areas for Conservation. Word Wildlife Fund (Canada), Toronto, ON. xxii + 281 p.
- Roux, M.J., Tallman, R.F., and Lewis, C.W. (2011). Small-scale Arctic char Salvelinus alpinus fisheries in Canada’s Nunavut: management challenges and options. Journal of Fish Biology (2011), 79, 1625–1647.
- Sedimentary basins of the Canadian north - contributions to a 1 000 Ma geological journey and insight on resource potential - NRCan Open S&T Repository
- SOR/2022-274. Order Prohibiting Certain Activities in Arctic Offshore Waters, 2022. CANADA PETROLEUM RESOURCES ACT. P.C. 2022-1317 2022-12-15.
- 'Start of a new normal': First grain train since 2015 rolls into Churchill, Man. | CBC News
- Stewart, D.B., and Lockhart, W.L. (2005). An overview of the Hudson Bay marine ecosystem. Can. Tech. Rep. Fish. Aquat. Sci. 2586: vi + 487 p. Chapter 14.
- Stewart, R.E.A. (2008). Redefining Walrus Stocks in Canada. Arctic 61:292-398.
- Symbion Consultants. (2009). Socio-Economic Analysis for Cumberland Sound Beluga. Prepared For Fisheries and Oceans Canada.
- The Role of the Hunter in Inuit Nunangat’s Mixed Economy
- Tillement, B.A. (1975). Hydrocarbon potential of Hudson Bay Basin 1975 evaluation. Unpublished report by Aquitane-Arco Group. 35 p. In Geological Survey of Canada Library QE196H8H995 1975.
- Treasury Board of Canada Secretariat. (2007). Canadian Cost-Benefit Analysis Guide - Regulatory Proposals. Catalogue No. BT58-5/2007. Ottawa.
- Tyrrell, M. (2006). More bears, less bears: Inuit and scientific perceptions of polar bear populations on the west coast of Hudson Bay. Inuit Studies 30(2): 191–208.
- Use of Inuit traditional knowledge (Qauijimajatuqangit)
- Vard Marine Inc. (2016). Protection of Critically Sensitive Nunavut Marine Habitats – Final Report. Prepared for WWF-Canada.
- Watt, C.A., Hornby, C., and Hudson, J. (2020). Narwhal (Monodon monoceros) abundance estimate from the 2018 aerial survey of the Northern Hudson Bay population. DFO Can. Sci. Advis. Sec. Res. Doc. 2020/073. iv + 15 p.
- Wenzel, G.W. (2008). Sometimes Hunting Can Seem Like Business. Polar Bear Sport Hunting in Nunavut CCI Press, Edmonton, AB.
- Whitford, J. (2006). Socioeconomic Analysis for Bowhead Whale. Fisheries and Oceans Canada, Central and Arctic Region, PROJECT NO. 1009405.
- Whitford, J. (2008). Socioeconomic Analysis for Atlantic Walrus. Prepared for Fisheries and Oceans Canada, Arctic Region.
- Winter road proposal could link Nunavut and northern Manitoba - Flin Flon Reminder
- Work on Nunavik’s fibre optic network starts in July
- World Resources Institute. (2008). Ecosystem Services: A Guide for Decision Makers.
Annexes
Annex 1: Map of the Southampton Island AOI
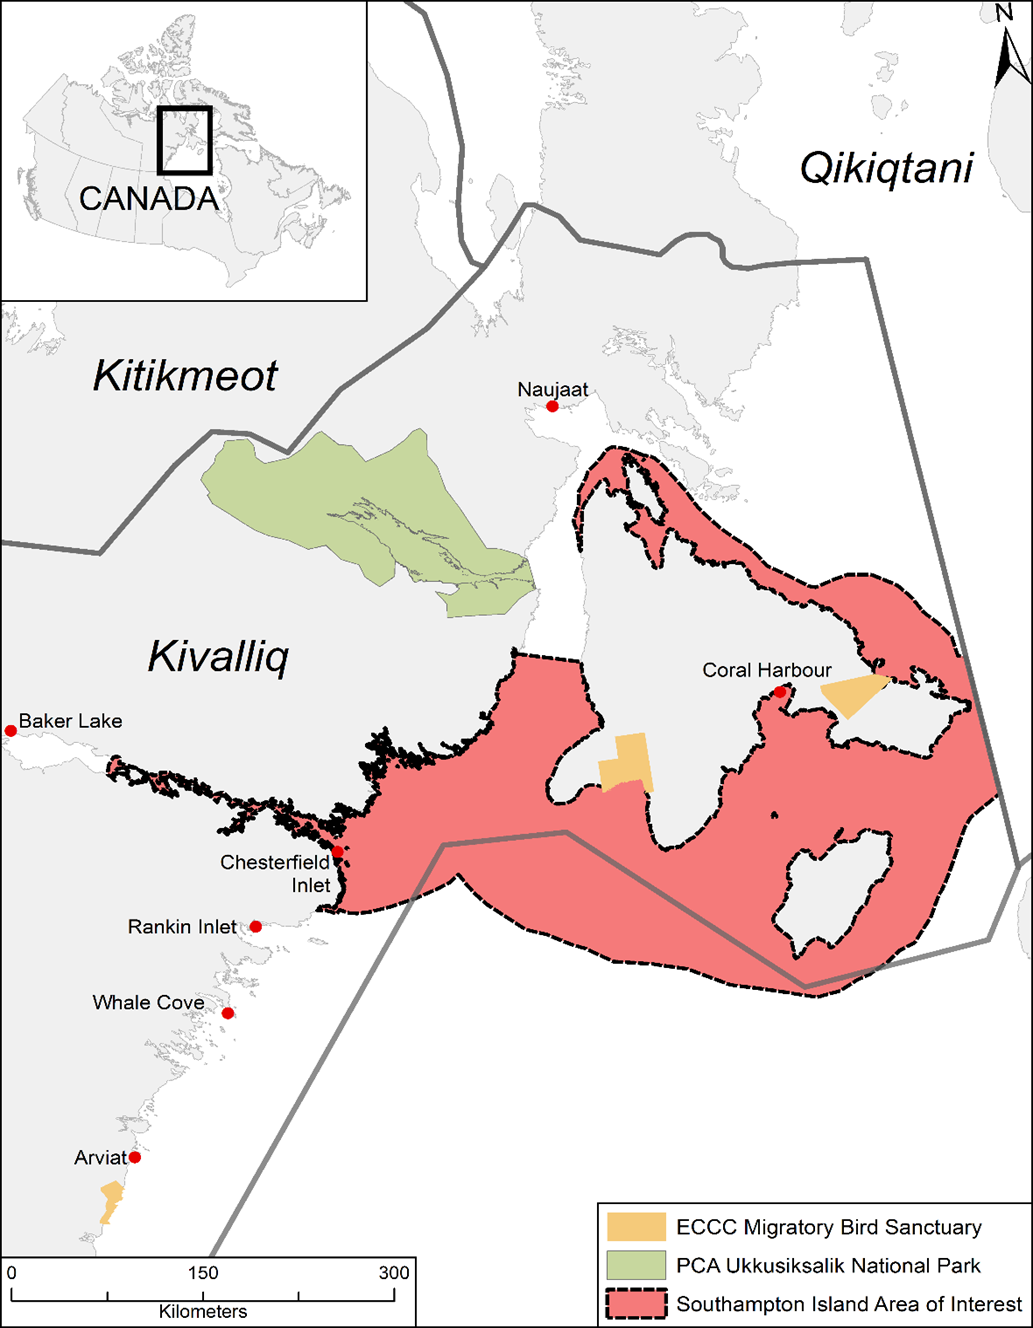
Annex 1: Southampton Island Area of Interest and Protected Areas.
Long description
This map shows the Southampton Island Area of Interest in relation to regional boundaries and established protected areas.
- Geographical Layout (Top to Bottom):
- The map is dominated by the large landmass of Nunavut, divided into regions: Kitikmeot (northwest), Qikiqtani (northeast), and Kivalliq (southwest).
- Southampton Island is a central feature. Coral Harbour is on its eastern side.
- Communities along the coast of Kivalliq (north to south): Naujaat, Baker Lake, Chesterfield Inlet, Rankin Inlet, Whale Cove, Arviat.
- Legend and Overlap Descriptions:
- The Southampton Island Area of Interest is outlined by a thick dashed black line and filled with a large solid red area, encompassing a vast section of the western Hudson Bay and the marine area around Southampton Island.
- PCA Ukkusiksalik National Park is a light green area, located northwest of the Area of Interest, primarily on the mainland in the Kivalliq region, near Baker Lake.
- ECCC Migratory Bird Sanctuary areas are shown as small, irregularly shaped areas filled with a solid yellow/orange color. These areas are located near Coral Harbour and along the coast near Arviat.
- Overlap: The ECCC Migratory Bird Sanctuary areas are all located within the boundaries of the Southampton Island Area of Interest (red area). The PCA Ukkusiksalik National Park (light green) does not overlap with the Area of Interest.
- Source: Map developed by Fisheries and Oceans Canada, Arctic Region, Marine Conservation and Planning and GIS programs 2018
Annex 2: MPA designation process
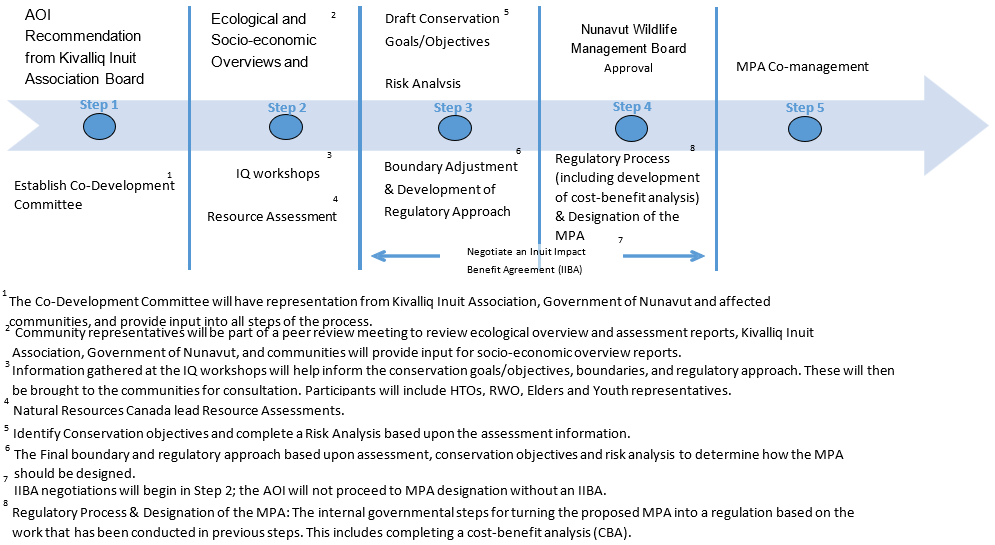
Annex 2: MPA designation process
Long description
Annex 2 is showing a flowchart indicating the MPA designation process. It has 5 steps separated in columns. Steps 3 and 4 also has the “Negotiate an Inuit Impact Benefit Agreement (IIBA).
Step 1: AOI Recommendation from Kivalliq Inuit Association Board
- Establish Co-Development Committee: The Co-Development Committee will have representation from Kivalliq Inuit Association, Government of Nunavut and affected communities, and provide input into all steps of the process.
Step 2
- Ecological and socio-economic overviews and assessment reports: community representatives will be part of a peer review meeting to review ecological reports, Kivalliq Inuit Association, Government of Nunavut, and communities will provide input for socio-economic overview reports.
- IQ workshops: information gathered at the IQ workshops will help inform the conservation goals/objectives, boundaries, and regulatory approach. These will then be brought to the communities for consultation. Participants will include HTOs, RWO, Elders and Youth representatives.
- Resource Assessment: Natural Resources Canada lead Resource Assessments.
Step 3: Risk Analysis
- Draft conservation goals/objectives: Identify Conservation objectives and complete a Risk Analysis based upon the assessment information.
- Boundary Adjustment and Development of Regulatory Approach: the Final boundary and regulatory approach based upon assessment, conservation objectives and risk analysis to determine how the MPA should be designed.
Negotiate and Inuit Impact Benefit Agreement (IIBA): IIBA negotiations will begin in Step 2; the AOI will not proceed to MPA designation without an IIBA.
Step 4: Nunavut Wildlife Management Board Approval
- Regulatory Process (including development of cost-benefit analysis) and Designation of the MPA: the internal governmental steps for turning the proposed MPA into a regulation based on the work that has been conducted in previous steps. This includes completing a cost-benefit analysis (CBA).
Step 5: MPA Co-management
Annex 3: Government and other organizations
Federal government
Federal government departments and agencies include DFO/Canadian Coast Guard, Environment and Climate Change Canada, Parks Canada Agency, Transport Canada, Natural Resources Canada and Crown-Indigenous Relations and Northern Affairs Canada (CIRNAC) and Indigenous Services Canada (ISC).
DFO Footnote 86 has the lead federal role in managing Canada’s fisheries and safeguarding its waters. It conserves and protects:
- fishery resources
- marine mammals and their habitat
- endangered or threatened marine species and their habitat
- areas of high biodiversity or biological productivity
DFO establishes MPAs under the Oceans Act (Section 35, Marine Protected Areas). Additional key DFO legislation includes the Fisheries Act and Species at Risk Act.
The Canadian Coast Guard (CCG) Footnote 87 is responsible for safe harbours, waters and waterways and manages and regulates marine transportation.
Environment and Climate Change Canada (ECCC) Footnote 88:
- conserves the country’s natural heritage
- protects habitat
- ensures a clean, safe, and sustainable environment
ECCC legislation of relevance is the Canada Wildlife Act, Species at Risk Act and Migratory Birds Convention Act, 1994.
Parks Canada Agency (PCA) Footnote 89 protects places, such as:
- national parks
- national historic sites
- national marine conservation areas
Key PCA legislation includes the National Marine Conservation Areas Act.
Transport Canada Footnote 90 is responsible for transportation policies and programs. The department promotes safe, secure, efficient, and environmentally responsible transportation.
Natural Resources Canada Footnote 91 is responsible for the development and use of Canada’s natural resources and the competitiveness of Canada’s natural resources products.
Indigenous Services Canada (ISC) supports Indigenous peoples (First Nations, Inuit, and Métis) to support social programs, health, housing, and community infrastructure.
Government of Nunavut
Key Government of Nunavut departments include the Department of Environment and Department of Economic Development and Transportation.
Nunavut’s Department of Environment Footnote 92 is responsible for program areas, such as:
- Wildlife Management
- Parks and Special Places
- Environmental Protection
Key legislation includes the Nunavut Wildlife Act and the Environmental Protection Act.
Nunavut’s Department of Economic Development and Transportation Footnote 93 has a primary goal of ensuring Nunavummiut participate in the benefits of economic growth. This department is responsible for:
- ensuring sustainable economic growth
- helping build healthy communities
- essential infrastructure
- fisheries and sealing programs
Nunavut institutions of public government
Relevant Nunavut institutions of public government consist of the Nunavut Impact Review Board (NIRB), Nunavut Planning Commission (NPC), Nunavut Water Board (NWB) and Nunavut Wildlife Management Board .
The Nunavut Marine Council (NMC) advises and makes recommendations regarding marine areas in the Nunavut Settlement Area through the coordination of shared knowledge from NIRB, NPC, Nunavut Wildlife Management Board, and Nunavut Wildlife Management Boards.
Community
Community organizations include Hunters and Trappers Organization (HTO) and hamlet councils. Community-based HTOs are led by an elected board, and they manage harvesting among their members, which include all Inuit in the community. Footnote 94 The Nunavut Agreement stipulates that HTOs along with RWOs (see below) oversee the exercise of harvesting by Inuit and sets out powers and functions of HTOs. Hamlet councils are elected as the governing bodies of the municipal corporations and have custody over its administrative and legislative powers (MTO, 2005).
Inuit organizations
The 3 Inuit organizations of relevance to the AOI are:
- Nunavut Tunngavik Incorporated
- Regional Inuit Associations (RIA)
- Regional Wildlife Organizations (RWO)
The Kivalliq Inuit Association and Kivalliq Wildlife Board (KWB) are, respectively, the RIA and RWO for the Kivalliq Region.
Nunavut Tunngavik Incorporated Footnote 95 represents Inuit under the Nunavut Agreement and ensures that the agreement is implemented. It coordinates and manages Inuit responsibilities set out in the Nunavut Agreement and ensures that the federal and territorial governments fulfill their obligations.
The Kivalliq Inuit Association represents Inuit of the Kivalliq Region. Rankin Inlet is the hub of the Kivalliq, which includes:
- Arviat
- Baker Lake
- Chesterfield Inlet
- Coral Harbour
- Naujaat
- Whale Cove (Kivalliq Inuit Association, Website)
The Nunavut Agreement stipulates that RWOs along with HTOs oversee the exercise of harvesting by Inuit and sets out powers and functions of RWOs. The KWB has the following 4 main obligations: regulating harvesting practices and techniques among members of HTOs, allocating regional basic needs levels among HTOs in the region, assigning regional basic needs levels to any person or body other than an HTO, and managing harvesting among the members of HTOs in the region.
Annex 4: Community subsistence harvest statistics
| Location | 2017 | 2018 | 2019 | 2020 | 2021 | Total | Average |
|---|---|---|---|---|---|---|---|
| Arviat | 0 | 0 | 0 | 0 | 1 | 1 | 0 |
| Baker Lake | 1 | 0 | 0 | 1 | 0 | 2 | 0 |
| Chesterfield Inlet | 3 | 2 | 3 | 4 | 3 | 15 | 3 |
| Coral Harbour | 2 | 1 | 5 | 11 | 8 | 27 | 5 |
| Kinngait | 0 | 0 | 0 | 0 | 0 | 0 | 0 |
| Naujaat | 100 | 62 | 73 | 125 | 100 | 460 | 92 |
| Rankin Inlet | 6 | 0 | 1 | 10 | 3 | 20 | 4 |
| Whale Cove | 1 | 0 | 0 | 0 | 0 | 1 | 0 |
| Location | 2017 | 2018 | 2019 | 2020 | 2021 | Total | Average |
|---|---|---|---|---|---|---|---|
| Arviat | 120 | 30 | 150 | 60 | NR | 360 | 90 |
| Baker Lake | 1 | 0 | 4 | 6 | NR | 11 | 3 |
| Chesterfield Inlet | NR | 15 | NR | 21 | NR | 36 | 18 |
| Coral Harbour | 79 | 25 | 35 | 40 | 27 | 206 | 41 |
| Kinngait | 12 | 10 | 9 | 37 | 17 | 85 | 17 |
| Naujaat | 19 | 7 | 18 | 20 | 13 | 77 | 15 |
| Rankin Inlet | 200 | 0 | 61 | 0 | 45 | 306 | 61 |
| Whale Cove | 50 | 37 | 50 | 16 | 50 | 203 | 41 |
| Location | 2017 | 2018 | 2019 | 2020 | 2021 | Total | Average |
|---|---|---|---|---|---|---|---|
| Arviat | 3 | 0 | 0 | 0 | NR | 3 | 1 |
| Baker Lake | NR | NR | NR | NR | NR | NR | NR |
| Chesterfield Inlet | NR | 4 | NR | 2 | NR | 6 | 3 |
| Coral Harbour | 31 | 15 | 37 | 14 | 27 | 124 | 25 |
| Kinngait | 4 | 5 | 4 | 5 | 12 | 30 | 6 |
| Naujaat | 16 | 15 | 17 | 10 | 13 | 71 | 14 |
| Rankin Inlet | 2 | NR | 4 | NR | 2 | 8 | 3 |
| Whale Cove | 2 | 1 | 2 | 0 | 1 | 6 | 1 |
| Location | 2017 | 2018 | 2019 | 2020 | 2021 | Total | Average |
|---|---|---|---|---|---|---|---|
| Arviat | 0 | 0 | 0 | 0 | 0 | 0 | 0 |
| Baker Lake | 0 | 0 | 0 | 0 | 1 | 1 | 0 |
| Chesterfield Inlet | NR | NR | NR | NR | NR | NR | NR |
| Coral Harbour | 0 | 1 | 1 | 0 | 1 | 3 | 1 |
| Kinngait | NR | NR | NR | NR | NR | NR | NR |
| Naujaat | 0 | 1 | 1 | 0 | 0 | 2 | 0 |
| Rankin Inlet | 0 | 0 | 0 | 0 | 0 | 0 | 0 |
| Whale Cove | 0 | 0 | 0 | 0 | 0 | 0 | 0 |
Sources: Fisheries and Oceans Canada, Ontario and Prairie Region Policy, and Economics and Arctic Region Fisheries Management staff.
Notes:
- The harvest statistics are reported by community, not by the geographical boarders of the AOI. Therefore, the harvest statistics reports are likely an overestimation of the harvests that take place within the AOI.
- While Kinngait is not a focus of this report, harvest data has been included to ensure there is no underrepresentation of harvests within the AOI.
- NR (No record) represents years where there is no record in DFO data.
- Zero (0), represents zero animal harvests as reported by the community.
- Averages are calculated by rounding to complete animal values.
- Walrus statistics include Sport Hunt harvests as meat is meant to be shared with the community and consumed for subsistence purposes.
- 2020-2022 data is believed to have potentially been impacted by COVID-19 restrictions in some fashion.
- At the time of writing, 2022 data was not available.
Historic subsistence harvests for Arctic Char and Seals
| Location | 1996-97 | 1997-98 | 1998-99 | 1999-00 | 2000-01 | Total | 5-year average |
|---|---|---|---|---|---|---|---|
| Arviat | 3,270 | 4,408 | 4,333 | 5,380 | 3,919 | 21,301 | 4,262 |
| Baker Lake | 1,157 | 622 | 352 | 442 | 187 | 2,760 | 552 |
| Chesterfield Inglet | 3,222 | 3,405 | 1,252 | 1,091 | 3,434 | 12,404 | 2,481 |
| Coral Harbour | 4,066 | 5,709 | 7,228 | 9,473 | 6,816 | 33,292 | 6,658 |
| Kinngait | NR | 13,321 | 11,296 | 13,951 | 16,211 | 54,779 | 13,695 |
| Naujaat | 5,345 | 4,503 | 4,537 | 4,486 | 2,543 | 21,414 | 4,283 |
| Rankin Inlet | 6,413 | 1,227 | 1,514 | 2,361 | 1,244 | 12,759 | *2,552 |
| Whale Cove | 1,494 | 114 | 1,408 | 2,093 | 1,006 | 6,115 | 1,223 |
Source: Priest and Usher, 2004.
*Average for Rankin Inlet is calculated. Average provided in survey was 2,618, but did not match the actual average, which was calculated by dividing the sum of the 5 years by 5.
| Location | 1996-97 | 1997-98 | 1998-99 | 1999-00 | 2000-01 | Total | 5-year average |
|---|---|---|---|---|---|---|---|
| Arviat | 346 | 406 | 489 | 689 | 329 | 2,259 | 452 |
| Baker Lake | 8 | 0 | 2 | 0 | 4 | 14 | 3 |
| Chesterfield Inglet | 159 | 117 | 45 | 40 | 161 | 522 | 104 |
| Coral Harbour | 863 | 722 | 878 | 1,198 | 460 | 4,118 | 824 |
| Kinngait | NR | 1,404 | 930 | 1,304 | 953 | 4,591 | 1,148 |
| Naujaat | 694 | 510 | 410 | 380 | 173 | 2,167 | 433 |
| Rankin Inlet | 291 | 95 | 82 | 398 | 87 | 953 | *191 |
| Whale Cove | 29 | 38 | 83 | 75 | 55 | 280 | 56 |
Source: Priest and Usher, 2004
Average for Rankin Inlet is calculated. Average provided in survey was 228, but did not match the actual average, which was calculated by dividing the sum of the 5 years by 5. Seal species considered are:
- ringed seal
- bearded seal
- harp seal
- harbour seal
- hooded seal
- seals (unspecified)
Annex 5: Petroleum potential within Hudson Bay
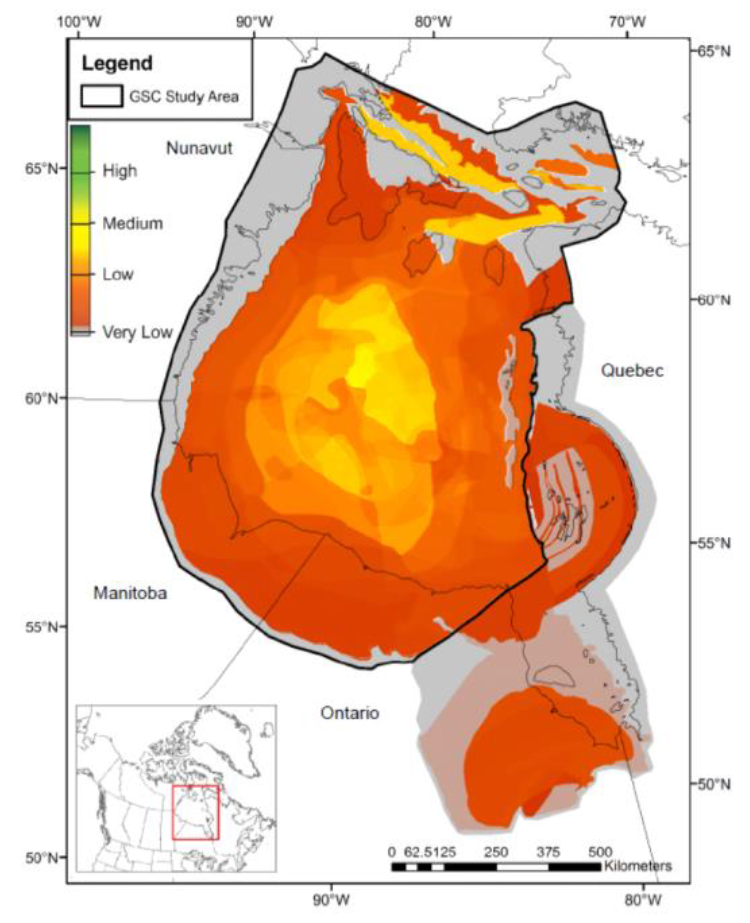 et al., 2023." />
Colour code – gradation bar ranges from no potential (grey) and very low potential (pale pink) to low potential (red) to the highest potential (dark green, globally competitive for exploration). The study area (black outline) contains low to medium petroleum potential areas. More interpretive mapping, modern seismic, and potential field data would need to be acquired to generate a more accurate representation of the petroleum potential. The petroleum potential of eastern Hudson Bay and James Bay is discussed in Dewing et al., 2023.
Long description
This map illustrates the geothermal potential across a large region of central and eastern Canada, including the Hudson Bay basin, with a focus on the GSC Study Area.
- Geographical Layout (Top to Bottom):
- The northern boundary includes Nunavut.
- The western area is bordered by Manitoba.
- The eastern area is bordered by Quebec.
- The southern area is bordered by Ontario.
- The main area of interest is a large water/land mass in the center.
- Legend and Overlap Descriptions:
- The GSC Study Area is outlined in a thick black line, encompassing the vast majority of the colored heat map.
- Geothermal Potential is indicated by a gradient of colors:
- Very Low (Dark Red/Orange): Covers the largest extent of the map, particularly the southern and outer areas of the study region (e.g., most of Quebec, Ontario, and southern Manitoba).
- Low (Orange): Forms a transitional band around the Very Low area.
- Medium (Yellow): Forms the main large central body of the potential area, covering the majority of the Hudson Bay region.
- High (Light Green): Found in three distinct, elongated, smaller patches in the far northern region of the map, located in Nunavut.
- Overlap: The areas with Medium and High potential are almost entirely located within the GSC Study Area
- Source: Dewing et al., 2023
Annex 6: Registered outfitters and tourism sites
| Communities with registered outfitters and tourism sites | Years of registration / application | Total number of registered businesses or tourism sites by community |
|---|---|---|
| Arviat | 2020-23 | 14 (3 O + 11 T) |
| Baker Lake | 2020-22 | 6 (4 O + 2 T) |
| Coral Harbour | 2020 | 1 (T) |
| Naujaat | 2020 | 1 (T) |
| Rankin Inlet | 2020-23 | 12 (T) |
| Whale Cove | 2020 | 1 (T) |
Source: List of licensed tourist establishments and outfitters that are licenced under the Travel and Tourism Act, Government of Nunavut. Tourism Establishments and Outfitters | Government of Nunavut
Notes:
- O represents number of outfitter applications; T represents Tourist Establishment applications. Table represents total applications to the Government of Nunavut. Not all applications are approved, some are still pending. Years reported on the Government of Nunavut website are from 2020-2023. Total applications for the communities listed are 35.
Annex 7: Walrus sport hunt
| Location | 2017 | 2018 | 2019 | 2020 | 2021 | Total | 5-year average |
|---|---|---|---|---|---|---|---|
| Chesterfield Inlet | 0 | 0 | 0 | 0 | 0 | 0 | 0 |
| Coral Harbour | 24 | 29 | 35 | 32 | 23 | 143 | 29 |
| Kinngait | 0 | 0 | 0 | 0 | 0 | 0 | 0 |
| Naujaat | 4 | 5 | 0 | 0 | 0 | 9 | 2 |
| Rankin Inlet | 0 | 0 | 0 | 0 | 0 | 0 | 0 |
| Arviat | 0 | 0 | 0 | 2 | 4 | 6 | 2 |
| Whale Cove | 0 | 0 | 0 | 0 | 0 | 0 | 0 |
Source: Data provided by Fisheries and Oceans Canada, Fisheries Management, Arctic Region.
| Location | 2016 | 2017 | 2018 | 2019 | 2021 | Total | 5-year average |
|---|---|---|---|---|---|---|---|
| Chesterfield Inlet | 0 | 0 | 0 | 0 | 0 | 0 | 0 |
| Coral Harbour | 15 | 11 | 9 | 18 | 8 | 61 | 13 |
| Kinngait | 0 | 0 | 0 | 0 | 0 | 0 | 0 |
| Naujaat | 0 | 0 | 0 | 0 | 0 | 0 | 0 |
| Rankin Inlet | 0 | 0 | 0 | 0 | 0 | 0 | 0 |
| Arviat | 0 | 0 | 0 | 0 | 0 | 0 | 0 |
| Whale Cove | 0 | 0 | 0 | 0 | 0 | 0 | 0 |
Source: Data retrieved from Fisheries and Oceans Canada FMHIS and Harvest Tracking spreadsheets.
Notes:
- Number of licences in DFO FMHIS does not indicate that a hunt was conducted or if it was successful. For total successful harvests, please see table below.
- Due to the COVID-19 restrictions, no sport hunting occurred in 2020. For this reason, it has been excluded from the table. A 5-year average utilizes data from 2016-19 and 2021.
| Licence count by country | Total 2011-21 |
|---|---|
| Coral Harbour (hunt location) | 97 |
| Austria | 2 |
| Belgium | 1 |
| Brazil | 1 |
| Bulgaria | 3 |
| Canada | 17 |
| China | 1 |
| Czech Republic | 4 |
| Denmark | 3 |
| France | 4 |
| Germany | 6 |
| Hungary | 2 |
| India | 1 |
| Italy | 2 |
| Kazakhstan | 1 |
| Lithuania | 1 |
| Netherlands, the | 1 |
| Poland | 2 |
| Romania | 2 |
| Russia | 14 |
| South Africa | 1 |
| Spain | 3 |
| Sweden | 1 |
| Ukraine | 2 |
| United Kingdom | 1 |
| United States of America | 21 |
Source: Fisheries and Oceans Canada FMHIS
Notes:
- In 2012, one hunter from Canada received 2 licences. The issuing officer is no longer with the department, it is difficult to verify the reasons for this.
- Totals are presented to adhere to data privacy of hunt applicants.
- No sport hunts licences were issued in 2020 due to COVID-19 restrictions.
| Location | 2016 | 2017 | 2018 | 2019 | 2021 | Total | 5-year average |
|---|---|---|---|---|---|---|---|
| Coral Harbour | 9 | 11 | 7 | 13 | 5 | 45 | 9 |
Source: FMHIS and Harvest tracking spreadsheets. Sport Catch refers to the number of animals harvested from licenced sport hunts. These areas had 0 reported sport hunts from 2016 to 2021:
- Chesterfield Inlet
- Kinngait
- Coral Harbour
- Naujaat, Arviat
- Whale Cove
- Rankin Inlet
Notes:
- No sport hunts occurred in 2020, to more accurately represent the harvest, a 5-year average has been calculated using 2016-19 and 2021 data.
- For this data, a successful hunt is defined by the removal of a walrus from the population via sport hunting.
Matrix 1: Total economic valuation flowchart and definitions
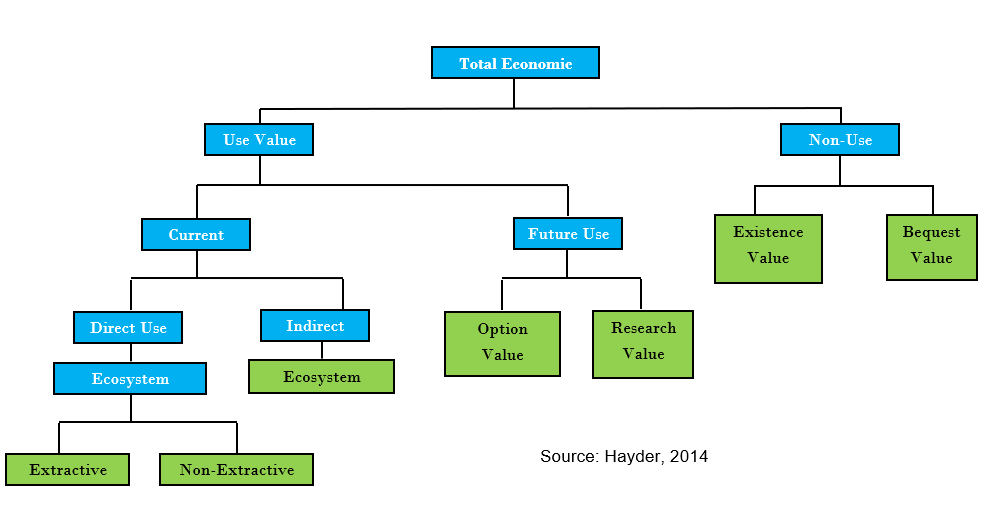
Source: Hayder, 2014
Long description
This is a hierarchical flow chart illustrating the breakdown of Total Economic Value into its components.
- Total Economic (blue box) leads to two main branches: Use Value (blue box) and Non-Use (blue box).
- Use Value leads to two sub-branches: Current (blue box) and Future Use (blue box).
- Non-Use leads to two sub-branches (both green boxes): Existence Value and Bequest Value.
- Current leads to two sub-branches: Direct Use (blue box) and Indirect (blue box).
- Future Use leads to two sub-branches (both green boxes): Option Value and Research Value.
- Direct Use leads to two sub-branches (both green boxes): Extractive and Non-Extractive.
- Indirect leads to one sub-branch (green box): Ecosystem.
- The chart includes a source note: Source: Hayder, 2014
- Use value
- The value people derive from using a good.
Current use value
- Direct use
- Directly consumable goods and services through ecosystem services.
- Ecosystem services
- Include provisioning services such as food and water (Millennium Ecosystem Services Assessment, 2005).
- Extractives use
- Extractive use (taking) of commodities provided by the AOI (for example, commercial fishing).
- Non-extractives use
- Non-extractive (not taking) use of commodities provided by AOI (for example, wildlife watching).
- Indirect use
- Indirectly consumable goods and services through ecosystem services.
- Ecosystem services
- Include provisioning services such as regulating services (for example, climate, floods, disease, water quality) and supporting services (for example, soil formation, nutrient cycling) (Millennium Ecosystem Services Assessment, 2005).
Future use value
- Option value
- The amount someone is willing to pay to keep open the option of future use of the resources (for example, possibility of commercial/recreational fishing in the future).
- Research value
- Scientific research potential that may result in new discoveries/knowledge and/or new developments that have broader application in future. Some of the potential beneficial effects include new understanding of the biology and ecology of the area, new understanding of inter-specific interactions and competition and new chemicals/medicines with broader applicability.
- Non-use value
- The value people derive from a good/resource independent of any use people might make of that good/resource.
- Bequest value
- Conservation for future generations (for example, future biodiversity). Bequest value considers people’s willingness-to-pay for future total use by their children and future generations.
- Existence value
- Existence value arises because people intrinsically value the existence of the area of interest (AOI) regardless of its use. Existence value includes the benefits from knowing that the AOI is being used by others and cultural values for an economy.
Contact us
For questions or inquiries, please contact:
DFO, Ontario and Prairies Region
501 University Crescent, Freshwater Institute
Winnipeg, MB R3T 2N6
867-645-4621
DFO.ArcticRDGO-BDGRArctique.MPO@dfo-mpo.gc.ca
Page details
- Date modified: