
Strategic Vision: Long-Term Recovery and Sustainability of the Gulf of St-Lawrence - 4TVn Cod Stock
Table of Contents
1. Introduction
A number of measures have been implemented and approaches undertaken to rebuild Atlantic cod stocks since their widespread collapse in the early 1990s. Most of these measures have had limited success and the stocks have not recovered in any significant way. With the goal of reversing this trend, the Department of Fisheries and Oceans (DFO) and the Provincial Departments of Fisheries and Aquaculture of New Brunswick, Prince Edward Island, and Nova Scotia, established a working group called the Maritimes Cod Action Recovery Team (MCART).
In consultation with the industry, the MCART has developed a strategic vision for the long-term recovery and sustainability of the 4TVn fishing subarea (southern Gulf of St. Lawrence) cod stock. The objective of this document is to set out that vision and to serve as a guide for long-term planning and implementation to make the recovery of the 4TVn cod stock a reality. MCART will subsequently undertake parallel initiatives for the 4VsW and 4Vn resident cod stocks respectively.
Similar federal-provincial Cod Action Teams have been established between the federal and provincial governments for other Atlantic cod stocks. The Canada-Newfoundland and Labrador Cod Action Team and the Canada-Québec Cod Action Team will each produce Cod Recovery Strategies for stocks within their jurisdictions. MCART will review the Recovery Strategies generated by these other Teams to identify relevant approaches for the 4TVn, 4Vn resident and 4VsW cod stocks. The reports of the three Cod Action Teams will be coordinated multilaterally through a common introductory section, highlighting the consistencies and commonalities. The historic importance of the cod fishery in Atlantic Canada is well documented and well known. The demise of the cod stocks in Atlantic Canada is such a serious tragedy that we need to know and document, that at the turn of this century the provincial governments, the federal government and the industry all joined forces in order to put together a recovery strategy for the depleted cod stocks. Hopefully, this strategy will be successful and will lead to the re-establishment of the cod fishery as an important commercial activity that contributes to the well being of our costal communities. It is recognized that there is no guarantee of success.
2. Background: Rebuilding Depleted Stocks
There have been many efforts in different parts of the world to rebuild depleted marine resources. Most of these measures were hastily undertaken in response to a stock collapse and clear strategies and goals were not always obvious. Every situation is different but there are lessons to be learned from past experiences in other fisheries and regions.
Unfortunately many such recovery efforts have not been fully and effectively documented. Research projects have been initiated and conferences have been held on the scope and effectiveness of stock recovery plans. Some preliminary conclusions and hypotheses have been advanced but there are still many uncertainties that prevent us from predicting with confidence the outcomes and effectiveness of various stock recovery approaches. The knowledge gathered from these efforts is nonetheless useful for planning future initiatives.
Some 58 recovery programs around the world were recently reviewed. It was found that most approaches, undertaken especially before the 1990s, were based on gradual reductions in total allowable catches (TACs) accompanied by technical measures (e.g., mesh size increases) and local closures. Few included significant changes in management frameworks.
Prior to 1995 there were three main approaches to mitigating depleted stocks:
- A complete closure of the fishery on the depleted stocks until recovery targets are met;
- Closure of critical habitat sites to protect nurseries;
- Establishment of more stringent limits on exploitation rates within the existing management framework for sustainable exploitation.
Of the 58 cases that were looked at, it was found that for demersal fisheries nearly half of the fishery closures resulted in success or at least partial success, (i.e., for 11 out of 24 population). Closures were successful or partially successful in 8 cases out of 12 cases reviewed for pelagic fisheries and in 10 out of 14 cases for invertebrates.
It was found that the majority of successful plans to date were implemented in the United States, apparently largely as a result of the obligations provided by the Magnuson-Stevens Act of Congress. It is noteworthy that the Act incorporates technical limits and reference points and establishes non-discretionary penalties if these are exceeded. It was also found that long-lived species took longer to recover than short-lived. In general, this will mean that demersal species will take much longer to rebuild.
There were other cases where recovery occurred without complete closure. As well, in other cases, stocks recovered, or reached their highest levels, not as a result of management measures but because of the disappearance of predators. It appears that reductions in the population of cod, for example, contributed to the recovery of species they prey upon.
In order to provide some specific examples, recovery measures are summarized here for a few stocks. In each case there are lessons to be learned from the success or in some cases, lack of success. Each case is different; this means that the measures taken, recovery over time and ultimate results vary between the various cases examined. A review of these cases can nevertheless be useful in providing a range of options.
2.1 Icelandic Cod
In Iceland, marine products provide more than 70% of total commodity exports. Demersal fish species account for about 75% of the total value of marine products. Cod is the mainstay of the Icelandic economy representing about 35% of the total value of marine products. Other important species include redfish, haddock, saithe, halibut and plaice.
In 1976, the Icelandic Marine Research Institute (MRI) warned that the cod stock was threatened by over-fishing. Fish mortality was alarmingly high and the spawning stock was weak. The MRI recommended a total allowable catch of 230,000 t of cod for that year, but the actual total catch turned out to be 350,000 tons. It was obvious that access to the demersal fishing grounds had to be restricted. There was much discussion whether such restrictions should be in terms of effort or of catch. Finally it was decided to restrict effort, i.e. allowable fishing time, rather than vessel catch. Effort quotas in the demersal fisheries were introduced in 1977. While entry remained more or less free, and there were no restrictions on the catch of each fishing vessel, allowable fishing days were to be reduced until the desired result in terms of total allowable demersal catch had been reached.
This approach resulted in greatly increased fishing effort and a race for the fish which in turn were counter productive for stock rebuilding. In response, the Icelandic Fisheries Association -- a broad collection of interest groups in the fisheries – passed a resolution in 1983 calling on the Minister of Fisheries to experiment with vessel catch quotas in the demersal fisheries, especially in the all important cod fishery. In the following years individual transferable quotas (ITQs) were fully integrated in the cod fishery for all vessels. With ITQs and a TAC set at 25% of fishable biomass, the cod stocks have rebounded. More importantly, the ITQ regime provided a mechanism and an incentive system for removing capacity from the fleet. Some observers suggest that in the Iceland example ITQs were useful in reducing fishing effort but do not in themselves constitute a comprehensive stock recovery strategy.
2.2 North Sea Cod
The North Sea cod is a shared fishery resource that is jointly managed by the European Union and Norway. Stock assessments date back to 1963. North Sea cod landings during this period peaked at 354,000 t in 1972 and declined to 50,000 t in 2001. ICES advised that this fishery should be closed in 2003 but the TAC was eventually set at 27,000 tons. The severity of these recommendations caused UK fishers amongst others to question the scientific justification. Despite restrictive scientific advice since 1987, including recommendations in 1992 and1993 to close the fishery, the resulting management measures have never gone that far and have thus failed to reduce fishing mortality and improve the exploitation pattern.
There was no industry support for the scientific advice and TACs were not always adhered to, although the latter is not easy to prove. Some observers conclude that it is more difficult to manage a shared stock because it is often difficult for fishers to accept the consequences of scientific advice when the result means economic hardship and particularly when there are no incentives to accept economic hardship for the common good.
It is evident that there were major differences of views between the fishing industry and scientists on the state of the stock and on required management measures. It is argued therefore that compliance and conservation will be better served if fishers are more closely involved in the research, scientific assessments and development of management measures starting with a science-industry partnership. This is a case where stakeholder participation, partnership and shared objectives are key to obtaining better recovery results.Footnote 1
2.3 Atlanto-Scandian Herring Stocks (Norwegian spring-spawning herring)
The Norwegian spring –spawning herring (Clupea harengus) is the most abundant fish species in the North Atlantic. Yet in the 1960s, with the technological improvement in harvesting and fish finding equipment, an open access management regime for both of the costal states that fish this species and an intensified high seas fishery, the stock collapsed at the end of that decade. A moratorium was imposed in 1970 and it took 20 years for the stock to reach the Minimum Biological Acceptable Level (MBL). In the 1950s and 1960s the biomass had been around 10 million tons. The annual harvest peaked to 2 million tons in 1966 with catches declining to practically nothing in the following years until a moratorium was declared in 1970. Recruitment was weak throughout the 70’s. But there was a strong year-class in 1983 that joined the adult population in 1986, which started the recovery process. In the mid 1990’s the recommended TAC was around 500,000 tons but when Norway, Russia, Iceland, Faroe Island and the EU established all of their allocations the combined total TAC was slightly over 900,000 tons. Yet the stocks continued to grow. In 1997, the TAC was set at 1.5 million tons but was reduced to around 1 million tons by the end of the century.
The five concerned nations (EU referred in this case as one nation) started to work on shared strategies that led to agreement on management measures. Amongst the key measures agreed, was a recovery plan, which will become operative if the spawning stock falls below certain levels. The spawning stock biomass of 2.5 million t was chosen as a rebuilding level. It was felt by some that no fishery should be carried when the spawning stock biomass is below this number. This was not the case as the fishing industry argued for a limited fishery, which was set at a fishing mortality of 0.05. It is argued that this limited fishery allowed for the stock to recover although it took 20 years for this to happen. The countries also agreed to an appropriate level for the spawning stock biomass, which was set at 5 million tons. The agreed fishing mortality was set at F= 0.15 at 5 million tons. It was then agreed the fishing mortality would be reduced to F=0.125 when the spawning stock biomass was below 5 million tons. This would allow for a safe and rapid recovery to a level in excess of 5 million tons. A time period of 2 to 5 years was also agreed for restoring the spawning stock biomass to its required level. Thus a recovery strategy has been set with fishing mortality at F=0.05 when spawning stock biomass declines below 2.5 million tons. Between 2.5 and 5 million t the fishing mortality is set at F=0.125 and above 5 million t fishing mortality is at F=0.15. This strategy is to ensure that in the collapse of the 1960s never happens again and that the spawning stock biomass remains as much as possible at its target range of 5 million tons.
2.4 Haddock on the Southern Scotian Shelf and Bay of Fundy (Div. 4X/5Y)
The Haddock fishery experienced a serious decline in the 1990s and is now recovering near the high levels observed in the late 1970s. The long-term reported average landings recorded between 1948 and 2002 are around 18,000 tons. Landings were in excess of 30,000 t in the mid 1960s with the highest recorded landing being 43,000 t in 1966. This fishery maintained itself in the 20,000 t range in the 1970s and increased to 30,000 tons range in the early 1980s. TAC’s were set in the 15,000 t range in the mid1980s and seriously declined from 1989 on. Although the TAC’s averaged around 5,000 t in the early 1990 catches were somewhat higher because of by-catch. Landings have remained at their lowest level throughout the 1990s averaging around 7,000 tons.
Spawning stock biomass (SSB) decreased from 69,000 t in 1979 to a low of 19,000 tons in 1990. The above average year classes in 1993 and 1994 resulted in the SSB increasing to 40,000 t in 1998 and to 67,000 t in 2003 because of the good year classes of 1998 1999. The 1998 year class is the highest recorded in time.
The haddock fishery has definitely recovered and significant increases in the TAC’s and landings are forecast for the coming years.
The low mortality due to fishing combined with very good year classes in the 1990’s are major elements that have led to the haddock recovery of the Scotian Shelf and the Bay of Fundy. Other theories are also emerging, one being that the demise of the cod stocks has allowed for a faster recovery because the ecosystem in the area could sustain more fish. Much remains to be done to have a clearer picture on such hypotheses.
2.5 Snow Crab in the Southern Gulf of St. Lawrence
The snow crab fishery in the Southern Gulf of St. Lawrence is a relatively new commercial fishery that started in the late 1960s. In the early 1970s this fishery was more of a secondary fishery with groundfish being the main fishery for most snow crab fishers. Total landings for the first 10 years or so were between 5,000 and 10,000 tons. By the late 1970s and early 1980s, the price for snow crab started to go up and was accompanied by a significant increase in effort. Landings went up to over 15,000 tons in 1979 and peaked at 31,500 t in 1982. The landings in following years remained around 25,000 t until 1987 when landings dropped by more than 50%. The following few years saw a more dramatic decline to a low of 7,880 t in 1989. In 1990, a management plan based on an agreement between the Department of Fisheries and Oceans and the industry was enforced. The TAC was set at 7,000 t in 1990. Landings gradually started to go up again and had reached 21,000 t by 1994. During the 1990s landings averaged around 15,000 tons. Then by 2002, landings were up again to 22,000 t and by 2004 landings were at 26,600 tons. It is expected that quotas and landings will increase and decline again but with the difference that both the scientific community and the industry understand that the fluctuations are mainly related to cycles of recruitment and not due to over fishing.
What is important to note here, is that a concentrated effort during the 1990s between the scientific community, the managers and the industry resulted in a better understanding of the biology of snow crab and in more control of fishing effort. This cooperation has led to continuous participation by industry on research projects, more regular and intensified exchange between the scientific community and the industry and a much tighter management regime in line with improved science and industry knowledge.
2.6 Lessons Learned
Some general conclusions have and can be drawn from these case studies and others, as has been noted by several researchers. The following, based on past experience, are important considerations when elaborating a recovery strategy.
- There are still relatively few instances where stock rebuilding has been attempted in a concerted manner.
- Science needs to involve industry in it’s research and analysis of findings.
- Management decisions opposed by harvesters are difficult to implement.
- Need to design the recovery strategy to generate immediate feedback on the appropriateness and effectiveness of the measures taken.
- Fisheries managers should not increase TACs until there is clear and broadly accepted evidence that predetermined recovery targets are being met. It is better to take more time to protect against another downturn.
- There is also a need in situations of closures and major reductions in TACs to provide adjustment support for industry sectors that are affected or else it will be difficult to enforce stock rebuilding measures.Footnote 2
- Key elements of such rebuilding measures are: a) Clearly identified threshold measures; b) a predetermined recovery period; c) a recovery trajectory; and d) a transition from recovery to target strategy are key components of a recovery strategy
- Environmental conditions play a significant role in stock rebuilding;
- A key variable in determining the period needed for rebuilding is the number of year classes required for rebuilding to be considered complete;
- In weak management regimes the first priority should be on very low exploitation rates to retain an adequate minimum biomass for peak recruitment periods;
- Controlling harvesting effort is essential to implementing management plans
- Measures to protect older fish in spawning refugia appear to be at least as effective as increasing the number of recruits;
- For many stocks it has been difficult to determine what had been the relative effect of environment and management in the recovery ; and
- Successful recovery plans are more difficult for long-lived species like groundfish than for other species.
3. Status of Cod in the Southern Gulf of St. Lawrence (4TVn)
The Southern Gulf of St. Lawrence cod stock has been fished for a very long time. It has been documented that this fishery has been exploited commercially since at least the 16th century.
The southern Gulf of St. Lawrence cod stock undergoes an extensive annual migration. They are found in the summer in the Southern Gulf in NAFO area 4T and in the winter in Sydney Bight just outside the Gulf of St. Lawrence in NAFO area 4Vn.
3.1 Historical Landings
Recorded landings varied between 20,000 t to 40,000 t from 1917 to 1940. From the mid-1940s to 1975, landings started to increase significantly reaching a peak of 100,000 t in 1958 and remaining above 40,000 t up to 1975. There was a drop to about 30,000 t in 1976 before again averaging 58,000 t between 1980 and 1990. The 1990s saw a series of sharp reductions in the TAC as it became evident that the stock was declining rapidly: from 53,000 t in 1990 to 48,000 t in 1991, 43,000 t in 1992 and 13,000 t in 1993. The management regime was perhaps slow to respond to the fact that biomass abundance had collapsed in the late 1980s, and the final result was a closure of the fishery in the fall of 1993.
3.2 The Moratorium Period
The commercial cod fishery in 4TVn was closed between 1993 and 1998, after which it was reopened again. During this period DFO made provisions for a recreational fishery, tracking of cod by-catch in other groundfish fisheries, and conduct of sentinel surveys to monitor stock abundance. The harvested amounts were less than 1,500 t annually.
In 1998 when the industry support program ended, a directed cod fishery was re-opened with an index fishery of 3,000 t In 1999 the commercial fishery was opened again with a TAC of 6,000 t and this remained in effect until 2002. In 2003 the fishery was closed again, and then reopened in 2004 with a quota of 3,000 tons.
3.3 Current Status
DFO scientists estimated the spawning stock biomass for 4TVn cod at the beginning of 2005 to be around 66,000 tons. The trend in total abundance is largely similar to that of the spawning biomass. Nevertheless, an increase in abundance of the most recent year-classes leads to believe that total abundance will be somewhat higher than previously estimated for 2004 and 2005. The forecast spawning stock biomass increase over the next few years is entirely due to the increased abundance of recent year-classes. They believe that the biomass has not increased measurably since the collapse in the early 90s and that the minimum spawning stock biomass that must be maintained if we are to avoid serious or irreversible harm is between 80,000 tons.
Natural mortality remains high. It has been estimated to have doubled from 0.2 from 1971 to 1985 to 0.4 between 1986 and 2004. The cause for this increase is still undetermined. Estimates of the cod predation by grey and harp seal in 2000 for this stock range from 19,000 t to 39,000 t (all ages) depending on diet assumptions of these marine mammals.
Recent improvement in year-class abundance, seem to indicate that there could be some light at the end of the tunnel. The 1998-2000 year-classes are estimated to be amongst the lowest on record. But the 2001-2002 year-classes are estimated to be more abundant, with the 2002 year-class to be above average.
DFO Science now estimates that the 3-year short-term outlook is for limited improvement in spawning stock biomass but that rebuilding of biomass stock is still going to be a slow process.
3.4 Harvesting Methods
The 4TVn cod fishery has historically been harvested by local residents from Québec, New Brunswick, Prince Edward Island and Nova Scotia along with a European fleet mainly consisting of vessels from France, Spain and Portugal. The European fishery was mainly conducted in 4Vn during the over-wintering aggregations. After the extension of Canadian jurisdiction in 1977, only France remained active up to 1993. Since then all landings have been made by Canadian vessels.
Up until the late 1940s, the Gulf of St. Lawrence cod fishery was prosecuted with hook and line. Then a ban on otter trawling was lifted. Thus began a new age in harvesting cod, the era of the mobile gear fishery. Most of the cod from the mid-1950s to the closure in 1993 was caught by mobile gear (otter trawls and seines).
Gillnets were also introduced during this period and became the second most important mean of harvesting cod; although much less important than the mobile fleet. Since the mid-60s, the majority of the 4TVn cod harvest has been caught by the ITQ mobile gear fleet.
With the fleet reduction measures put in place after the 4TVn cod closure the number of mobile gear ground fish licenses under ITQ was reduced from 61 to 34. Presently, there are 14 groundfish ITQ licenses in New Brunswick, 8 in Nova Scotia and 12 in Prince Edward Island. It should be noted that out of the 34 remaining 4TVn ITQ licenses, 5 from New Brunswick have gained access to Zone E snow crab licenses. In Nova Scotia, 4 have snow crab licenses for Zone 19 and 3 have access to Zone F snow crab. In Prince Edward Island 1 enterprise has access to a Zone E crab license and 2 have lobster licenses. This means that a total of 15 ITQ license holders out of 34 now have permanent access to other lucrative species. In addition there are 45 ITQ licenses from Québec.
Temporary shrimp allocations have also been provided to the groundfish fleet.
In 2002, there were also 454 inshore mobile gear licenses on competitive quota. Of those 168 were from New Brunswick, 76 from Nova Scotia and 220 from P.E.I. The vast majority of these fishermen are lobster license holders.
In the Southern Gulf there is still a substantial number of fixed gear licenses. In total, there are 1,293 licenses including 442 from New Brunswick, 230 from Nova Scotia and 621 from Prince Edward Island. These harvesters, again in the vast majority, also have lobster licenses. In addition, there are 510 licenses from Québec (Gaspé and Îles-de-la-Madeleine).
3.5 Factors Affecting the Recovery
In the mid-1970s, the 4TVn cod stock declined to low levels but then recovered. In 1974 TAC limits were established for the first time in 4Tvn with the first TAC set at 65,000 t reflecting landings of previous years. But in 1975 the TAC was dramatically reduced to 15,000 t in response to the biomass reduction. Within a few years the stock rebounded with landings averaging 60,000 t in the 1980s. In the early 1990s, TACs again were drastically reduced for 4TVn cod, but there is little evidence of recovery since then. After the mid-1990s closure, the fishery was re-opened and the TAC was set at 6,000 t from 1999 to 2003, followed by another closure in 2003. In 2004 the TAC was 3,000 tons.
In their attempts to understand the reasons for the state of the stock DFO scientists have examined life history parameters such as growth, natural mortality and recruit per spawner biomass.
- Growth
It was found that average weight-at-age reached its lowest level in 1987 and has increased only marginally since then. Weight-at-age for adult cod (ages 5 years or more) in the period of the moratorium were 50 to 60% lower than those during the 1970s.
- Mortality
It is estimated that the natural mortality rate (M) has increased from 0.2 to 0.4Footnote 3 during the 1980s. Causes for this increase in M have been examined to some extent. These included unreported catches, disease, toxins, starvation, parasitism, environment changes such as water temperature, and predation. In the 1990s, for such a change to be the result of fishing mortality alone would have required an unreported catch of 20,000 tons. It is unlikely that such a high level of unreported catch would have gone unnoticed in the absence of a directed cod fishery in the mid-1990s. There is also no evidence for recent increases in disease, parasitism or toxins. However, in terms of predation, it was found that the estimated changes in M corresponded closely with changes in grey seal abundance in the southern Gulf Footnote 4 Footnote 5. It needs to be noted that grey seal diet data are limited and the existing feeding studies suggest that grey seals mostly target small cod. In addition, the estimated consumption of grey seals amounts to about 9,000 tons, well below the amount corresponding to the increased mortality. However, despite these uncertainties, observations of belly feeding by seals on adult cod and the parallel trends between grey seal abundance and estimated M for this cod population suggests that increased predation by seals is currently the most plausible explanation for the increase in M.
[click on image to enlarge]
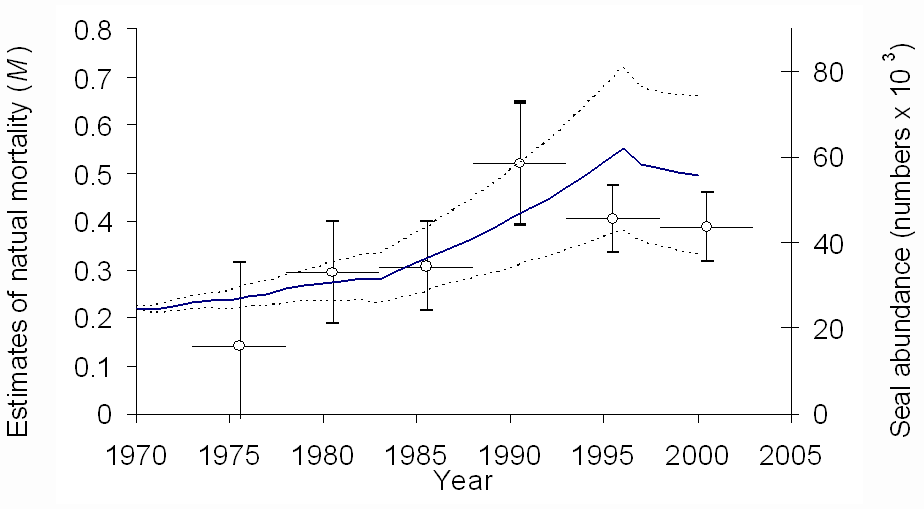
- Estimated natural mortality for periods of years (circles, with horizontal lines spanning the period covered) from the population analyses of southern Gulf of St. Lawrence cod (Gadus morhua) and trends in grey seal (Halichoerus grypus) population (solid lines) with confidence interval (dashed lines). Error bars for estimates of M and confidence intervals for grey seal population estimates are ± 2 standard errors. Adapted from Chouinard et al. (in press)Footnote 5
- Recruit per Spawner Biomass
The number of recruits per unit of spawning biomass (R/SSB) was very high in the mid-1970s and about average in the 1990s. The ratio of R/SSB in the late 1970s was exceptionally high and fuelled rapid recovery while the near average R/SSB in the 1990s combined with lower biomass resulted in a lower abundance of recruits.
The high ratio of R/SSB for the late 1970s corresponded to a period where pelagic biomass (in the southern Gulf, mostly herring and mackerel) was low. Herring and mackerel feed primarily on plankton including the eggs and larvae stages of several fish species including cod. During periods of low pelagic biomass, this predation by pelagics would be lower and thus a higher number of cod recruits could be expected for a given spawning biomassFootnote 6Footnote 7. Given the high pelagic biomass in the late 1990s and 2000s, the number of recruits produced per spawning biomass in this period can be expected to be only about average.
When the 1993 moratorium was announced the 4TVn cod stock, like many other cod stocks, was in such a low state of productivity that quick recovery could not have been expected even if there was a dramatic reduction in fishing effort. With other negative factors being added since the moratorium, particularly the increase in mortality possibly caused by predators such a grey seals, it is almost certain that stock recovery is not going to happen quickly.
The 1993 recovery plan for 4TVn cod was centered on the closure of the commercial fishery. Although there were strict management measures in place, the plan lacked decision rules to guide a re-opening and as a result, perhaps, the fishery was reopened with limited TACs. It seems clear, however, that even if there had been no increase in fishing activities between 1998 and 2004 the stock would not have recovered much more quickly in the short-term because of the negative life history parameters (i.e., growth, natural mortality and recruit per spawner).
3.6 Environmental Impact and Biodiversity
The environment can play a significant role in either promoting or inhibiting the recovery of stocks. In marine systems, environmental conditions can affect productivity and thus have significant impacts on the stocks that inhabit the ecosystem. However, resolving the mechanisms by which environmental conditions affect fish populations continues to be one of the major challenges facing fisheries scientists. The complexity of the relationships is often such that there are only a few cases where direct links between stock trends and environmental conditions have been established. For example, in the Baltic Sea, poor cod recruitment has been linked to low oxygen volume. In that system, eggs released in low salinity water can tend to remain in deeper waters where oxygen concentration can be limiting for proper development. Water temperature is also known to affect growth of cod and thus when temperatures tend to be below normal, lower growth can be expected.Footnote 8
Because of the complexity of the mechanisms, it is common to examine deviations in the environmental variables from the long-term mean instead of looking at the actual values. For the southern Gulf of St. Lawrence, air and bottom temperatures were below normal and ice coverage above normal in the early 1990s. After the mid-1990s, water temperatures have generally improved and values in the early 2000 have been closer to the long-term average. In conclusion, the recent period is not abnormal in terms of environmental indicators, but it was not conductive to maximizing growth, recruitment, and general "good" health of the stock.
In terms of biodiversity, although the relative abundance of the various species has changed, the number of species present in the southern Gulf ecosystem has not declined. There have dramatic changes in the abundance of particular species over the last 30 years. Large bottom-dwelling fish (cod, white hake, American plaice etc) have experienced a large decline. On the other hand, some other species have increased significantly. These include species such as Greenland halibut, capelin and 3-spine sticklebacks. Pelagics (herring and mackerel) are currently abundant compared to the late 1970s. Except for the pelagic species, where a link with cod has been made, there does not appear to be changes in the species make-up that may prevent recovery of cod in this area.
Management Measures
The Department of Fisheries and Oceans, in collaboration with the fishing industry, has introduced a series of management measures since the moratorium of 1993 that highlight the fishermen’s commitment to participate in stock recovery measures. These measures have required a lot of tolerance, sacrifices, cooperation and initiatives to assist in cod recovery.
When one compares the measures that are now in place to the ones that existed in 1993 it is obvious that the fishermen made a serious commitment to cod stock recovery in 4TVn.
| Management Measures | 1993 | 2004 | |
|---|---|---|---|
| 1.Mesh Size | Mobile | 130mm square | 145mm diamond |
| Fixed(gillnet) | 145mm diamond | 145mm diamond | |
| Longline | no. 11 circle | no. 12 circle | |
| 2. Observer coverage | Mobile | 10% (5%)* | 20% (20%)* |
| Fixed | 5% (2%)* | 10% (10%)* | |
| 3. Mandatory hail-out | Mobile | No | Yes |
| Fixed | No | Yes | |
| 4. Dockside Monitoring | Mobile | Yes | Yes |
| Fixed | No | Yes | |
| 5. Gear limitation | Mobile | No | No |
| Fixed (gillnet) | No limits | 10 nets | |
| Fixed (longline) | No limits | 2000 hooks | |
| 6. Test Fishery prior to opening | No | Yes | |
| 7. Protecting spawners (closure between April 1 to June15) |
No | Yes | |
| 8. Protecting juvenile area (closure of Shediac valley) |
No | Yes | |
| 9. Issuance of area license cond. | No | Yes | |
| 10. By-catch protocol | No | Yes | |
| 11. Protecting high concentration (closure of Miscou Bank) |
No | Yes | |
| 12. Limitation of participants | Mobile | No | Yes |
| Fixed | No | No** | |
| *the hail-out provision has increased success deployment of at-sea observer coverage. **the fishing seasons are limited to short periods (48 hours) to ensure quotas are respected. |
|||
4. The Seal Issue
4.1 Control of Predators
Fish harvesters believe strongly that until populations of migratory harp seals and resident grey seal in the Southern Gulf of St. Lawrence are reduced, the possibilities for successful rebuilding of 4TVn cod are very limited. They are particularly concerned with the resident grey seal population for which there are no current population control measures.
Most scientists agree that harp and grey seal populations have increased significantly and that increased cod natural mortality is a critical issue in terms of rebuilding. While the increase in natural mortality of cod has been linked to the increase in grey seal abundance, the evidence in support of this link is currently not definitive. As a result, there is no unanimity in the scientific community that reducing the number of seals will necessarily result in more rapid recovery of cod stocks.
It has been pointed out that reductions of predator populations sometime give surprising results, and there are many examples of reductions that have benefited endangered species and habitat. For example, in the early 1920s, pumas, coyotes and wolves were removed from the Kaibab plateau in Arizona to protect what was seen as an endangered herd of 30,000 deer. The deer herd increased to over 100,000 animals and caused serious damage to their habitat through over-grazing. The population thereafter fell back to less then 10,000 deer, well below the level that motivated the reduction of predators.
On the other hand there are many examples where if predators had not been eliminated or significantly reduced an important resource would have been seriously jeopardized and possibly extinguished.
The government of Australia has increased the numbers of kangaroos allowed to be taken by commercial hunters from over 5.5 million every year to 7 million. Farmers say parts of Australia are in the grip of the kangaroo plague after an explosion in numbers. In New South Wales alone, the population dramatically increased from 8 millions to over 13 millions in one year. Farmers say that the damage that kangaroos cause is disastrous: crops are eaten, fences are destroyed and the Outback’s most vital resource –water- is quickly depleted. Animals activist are opposed to this increase in commercial hunt.
The BC government is recommending a reduction of wolves and cougars on Vancouver Island to protect the Black-tailed Deer. The deer population has fallen from 200,000 animals in 1980 to 55,000 in 2001. In 2002, it was recommended to remove 40 wolves each year for the next 3 years and an extension to hunting season for cougars to over 9 months. This is being opposed by environmental and conservation groups who argue that the real cause is loss of old growth forest, which they say, is critical winter habitat for the Black-tail deer.
There are many other examples around the world where the need to proceed with predator reductions is considered necessary although often controversial. Other examples are rabbits in Australia that over-graze grass for sheep and cattle; deer in England, Wales, and Scotland that damage trees and crops; wolves in the Yukon that attack and destroy caribou and moose; cormorants that destroy local plant life, degrade water quality and affect valuable habitat in parts of Ontario and the American bullfrog that is impacting on other frog populations and eating small ducks in British Columbia.
In summary, examples of predator control measures around the world are not lacking and yet none appear as controversial as seal population control measures.
4.2 Controls of Seal Population Growth
Currently, seal populations are harvested in Atlantic Canada entirely for commercial benefits. In 2005, the quota for the harp seal hunt was about 320,000 animals. The TAC for hooded seals was set at 10,000 per year with no hunt allowed in the Gulf of St. Lawrence. For grey seals, a TAC of 10,000 grey seals has been established over two years with no hunt of these animals on Sable Island. While the quota for harp seals is likely to be reached, only a small fraction of the grey seal quota is taken.
Concerns are often expressed by industry over the quantity of fish consumed by seals, dolphins and other marine mammals, and the possibility that they are affecting the size and availability of fish stocks and thus the viability of fishing fleets. There are frequent demands in many countries for measures to reduce the numbers of marine mammals in the belief that fewer marine mammals will consume less fish to the benefit of the fishing industry and the livelihood of fish harvesters.
Proposals to control seals and other predator populations are a source of opposition from animal welfare groups and a huge source of frustration for fish harvesters. Much public debate and research activity has been focused on this matter over many years. As yet however there is no emerging compromise or consensus on basic questions about the impact of seal predation on cod populations or on measures to reduce seal populations to former levels when the cod fishery was healthy.
The Canadian government and the fishing industry have been threatened with major trade sanctions if measures to reduce seal populations are not satisfactory to those who are concerned with animal welfare of seal populations. It is the view of the Action Team and of the fishing industry that the possible reactions to an expanded seal harvest cannot and should not be ignored. But it is also the view of the Action Team that doing nothing to address the increase in mortality due to predators is also unacceptable. Effective measures to control seal predation are considered integral to the strategic vision for cod stock recovery. However this document will limit its consideration to the impacts of the seal population on the 4TVn cod stock specifically.
4.3 A Management Protocol
In-depth studies of marine populations in the 1990s revealed that interactions between marine mammals and fisheries were not always as simple as they might at first sight appear. Furthermore, experience showed that the issue of marine mammals harvest to enhance fish stocks could lead to polarizing debates that, in turn, could interfere with a rational evaluation of the potential merits and detriments of specific proposals.
In 1992 a Scientific Advisory Committee of the UNEP Marine Mammal Action Plan (MMAP) developed a scientific protocol to help evaluate proposals for reducing marine mammal populations perceived to be hurting specific fisheries. This protocol covers cases where marine mammals are perceived to be ecological competitors within a fishery, and where a reduction of the number of the marine mammals is proposed for the purpose of benefiting the fishery. It provides a model for the biological and ecological evaluation of marine mammal population reduction proposals.
This protocol describes the required information needed for a scientific evaluation of the biological and ecological aspects of a population reduction proposal. The second component of the protocol provides a description of the procedure for evaluating the likely effects of the proposed marine mammal population reduction. It employs an ecological modeling method that incorporates a large amount of information while taking into account the uncertainties in understanding ecological relationships.
A similar procedure would be required for a proposed seal population reduction in the Southern Gulf of St. Lawrence.
Also a detailed harvesting and commercial product utilization plan would need to be developed in concert with any proposed activity.
Ref. UNEP / Marine Mammal Action Plan
4.4 Present Situation in the Gulf
There are two main seal populations that have been documented to consume 4TVn cod in the southern Gulf of St. Lawrence: the grey seal and the harp seal.
The grey seal population in eastern Canada is composed of two components: one component is located within the Gulf of St. Lawrence (the resident grey seal) and the other is located around Sable Island (Sable grey seal).
The abundance of grey seal in Atlantic Canada is estimated to have increased from about 30,000 animals in the early 1970s to about 250,000 in 2000. About 80 % of grey seals are from the Sable Island component. The grey seal population in the Gulf of St. Lawrence has gone from slightly higher than 20,000 animals in the late 1960s to over 55,000 by the end of the century. Although no firm estimates are currently available, the grey seal population in 2005 on the east coast of Canada likely numbers about 300,000 animals.
While grey seals are found year-round, harp seals are seasonal visitors to the southern Gulf. The harp seal population on the East coast of Canada has increased from 2 million animals in the early 1970s to over 5 million by the end of the century. Of this total, about 1.2 million harp seals can be found within the Gulf of St. Lawrence during late-winter and early spring. The proportion going into 4T may be as low as 35% to as high as 70% and is located largely around the Magdalen Islands.
For southern Gulf cod, the natural mortality (M) rate (cod that die from causes other than fishing) is estimated to have increased from 0.2 to 0.4 during the 1980s and has remained high since. Around 2000, this increase in natural mortality meant that an additional 20,000 t of cod was lost from the population (total natural mortality was about 40,000 tons). The increase in natural mortality for southern Gulf cod occurred during the same period as the increase in seal populations.
Seals eat a variety of marine organisms including cod. The diet of seals is not easily estimated. Because the items consumed are digested rapidly, diet estimates rely on the presence of bones or other hard parts from the consumed animals. In addition, diets tend to vary both geographically and seasonally and samples are usually from animals that are found close to shore. Consequently estimates of consumption are subject to a number of uncertainties.
In 2001, it was estimated that the Gulf resident grey seal ate an estimated 5,600 tons (900t in 1996) of southern Gulf cod. It is not certain how much 4T cod the harp seal population eats. In the winter in 4T there is not much consumption because the cod is over wintering in 4Vn. What is not known is the amount of cod eaten by harp seals as they move through 4Vn on their way in or out of the Gulf of St. Lawrence. Based on the diet of harp seal in 4R it was estimated that harp seal consumption of 4T cod could be as high as 21,000 tons in 2001. In summary, total consumption of 4T cod by harp seal and grey seal in 2001 was estimated to range between 19,000 tons and 38,000 tons.
4.5 Hypothesis of Impact of Population Reduction
The doubling of natural mortality (M) of 4TVn cod from 0.2 to 0.4 corresponds to a the period when the grey seal population in the Southern Gulf of St. Lawrence also more than doubled.5,6 It needs to be indicated that this correlation between the increased natural mortality of cod and increase seal population does not, in itself, prove that increased seal abundance is the main or only reason for the doubling in cod natural mortality. It does, however, suggests that this is a potential cause and could be a hypothesis to be tested.
If the increase in cod natural mortality of 4TVn cod is directly related to the increase in seal population then it is quite possible that a decrease in seal population will result in a decrease in cod natural mortality. MCART proposes that this hypothesis be tested. This would help resolve the never-ending debate over the impact of seals on the cod stock in the Southern Gulf of St. Lawrence.
4.6 Population Reduction Plan
While scientists generally agree on the increased abundance of grey and harp seals, and that the amount of cod they consume is substantial, they also agree that the implications of reducing seal herds are uncertain. Some argue that there may be other species consumed by seals that also predate on cod, so reducing seal abundance may increase other predation, nullifying or reversing the expected benefit. Also, if cod became twice as abundant while seals are half as abundant as now, seals might still consume the same amount of cod because they might encounter more cod and it could become a higher proportion of the seal diet.
It would appear that the most substantial scientific argument against seal population reduction to diminish cod mortality is that the results are uncertain. In this context, a prudent course of action would be to conduct an experimental reduction of the seal population supported by a solid research program with clear guidelines to monitor impacts. There is no scientific evidence to date to indicate that a controlled program to bring a population down to previous levels would have irreversible negative impact. An experimental reduction of grey seal would be most practical since this is a resident stock, which does not inhabit a huge territory, as is the case for harp seal.
A more detailed strategy for managing seal populations as part of a wider stock recovery plan for 4Tvn cod is proposed below. While harp seals are being hunted for commercial purposes in the Gulf, little harvesting of the resident grey seal population currently takes place. Establishing a grey seal reduction program based on a scientific protocol that would allow to measure the impact on cod natural mortality is an essential component of a cod recovery strategy.
The MCART believes that a scientific protocol needs to be elaborated to measure the impact on Southern Gulf of Lawrence cod of a grey seal population reduction along the principles outlined by UNEP MMAP. The MCART also believes that a detailed harvesting and product utilization plan need to be elaborated before the project can move forward. The grey seal population increased from about 25,000 to about 55,000 animals in the period when the doubling in natural mortality of the cod occurred. Therefore, MCART believes that some level of reduction of the grey seal population would be required in order to detect whether a reduction of grey seal numbers will result in a corresponding reduction of natural mortality of southern Gulf cod. This number assumes that a difference of natural mortality of 0.1 can be detected and should be sufficient to measure impacts of a reduced grey seal population on the 4TVn cod population in the context of experimental management. At the same time, any population reduction should not endanger the long-term sustainability of the seal population since it would remain well above previously observed levels. At this point, MCART considers unlikely that the reduction would result in significant ecological imbalance, however this issue should be examined in more details.
MCART understands that this approach may be controversial and generate public debate. The debate will likely be on two levels: the principle of reducing the population and the actual number of grey seals to take. MCART recommends that the principle of this approach be examined. If this course of action is chosen it is suggested that a panel of experts be brought together to determine the appropriate number to achieve a balance of measurable results and ecological sustainability.
5. New conservation framework
Efforts to develop a fisheries management approach for rebuilding the 4TVn cod stock must address the stark reality that the measures employed to-date have not been effective. New approaches must be based on rigorous analysis of the available information and on lessons learned from experiences with other stock recovery initiatives.
Over the past few years, there have been a number of new approaches (some of which are still being elaborated), frameworks and developments to improve conservation and management of our fisheries. These include:
- the Precautionary Approach; PA,
- the Species at Risk Act; SARA,
- the FRCC Planning approach,
- the Integrated Fisheries Management Plan,
- the Objective Based Fisheries Management Approach, OBFM, and
- a Comprehensive Ecosystem Analysis.
For the most part, many of these approaches are just now starting to be incorporated in fisheries management and these will need to be part of a comprehensive recovery strategy for 4TVn cod. A description of each of these concepts and approaches are presented below.
5.1 Precautionary Approach
Existing knowledge on fish population dynamics is not definite or absolute. The best scientific research can sometimes generate more questions than answers. Fish harvesters have their own knowledge base that is substantial, but it does not always have all the components to support definite conclusions. By pooling scientific and industry knowledge, as has been the case in past years, we are solidifying a shared knowledge base. This progress is not yet to the point where both sides always arrive at the same conclusions.
The Precautionary Approach (PA) is a concept that has been around for many years and is applicable to many facets of life. The Precautionary Approach is emerging globally as a new framework for fisheries management. It results from several developments that culminated in 1995 with an agreement at the United Nations on the conservation and management of straddling stocks and highly migratory fish stocks. This agreement is commonly called the "UN Fish Stock Agreement" (UNFSA). Canada has been a strong proponent of the management principles outlined in this agreement and ratified it in the fall of 1999.
It is a risk management approach to employ when there is:
- An absence of full scientific certainty;
- A potential risk of serious or irreversible harm, and;
- A pressing need to make a decision.
It requires:
- Objectives that take into account stock conservation and environmental and ecosystem considerations, as well as the socio-economic performance of the fishery.
- Identification of unacceptable outcomes, such as stock collapse.
- Pre-agreed strategies to achieve objectives while avoiding unacceptable outcomes.
- Taking uncertainties into account.
- Greater caution when knowledge is less complete or less reliable.
The PA shifts the focus towards meeting conservation requirements through a rules-based risk management regime with decision rules so that, if the resource status warrants, the management becomes more "conservative". It also implies management by objectives in terms of defined parameters and thresholds for recovery and ongoing viability. From an industry perspective, this approach is intended to result in a controlled harvest with improved predictability and stability.
Some of the PA frameworks developed around the world include the concept of stock status zones to determine management measures. The management measures required by the PA vary according to the zone or condition of the stock. Stocks can be identified as being in one of three zones:
- The Critical Zone
The stock is deemed to be in the Critical Zone when there is high probability of serious or irreversible harm to the resource such as impaired reproductive capacity, and conservation objectives are therefore paramount for the management of the fishery.
- The Cautious Zone
In the Cautious Zone, stocks are considered to be in a state where additional measures need to be taken to avoid declining to the critical zone. In this zone, both conservation and socio-economic objectives can be used in determining harvest levels providing that these levels will not cause serious or irreversible harm to the resource.
- The Healthy Zone
In this zone, the resource is in such condition that there is low probability of declining below the point where reproductive capacity of the resource is severely impaired: thus conservation objectives are met and socio-economic objectives are optimized through the management of the fishery within the limits of sustainability.
There are specific stock management approaches for each category. For example when a stock is in a Critical Zone, conservation objectives are paramount and fishing mortality must be reduced to the lowest levels possible. Directed fishing may occur under specific recovery conditions such as when multi-year trend analyses indicate stock growth, or when recovery targets are explicit, or provisions are made for restrictive by-catch or other extraordinary circumstances.
When the stock is in a Cautious Zone, a moderate directed fishery is permitted to occur. Closure is possible if a limit is approached or is defined by a stock trend (e.g., the multi-year trend analysis indicates no stock growth). Other measures may include by-catch restrictions. Recovery targets are explicit and as the limit is approached, conservation considerations outweigh socio-economic considerations.
When a stock is in the Healthy Zone, fishing is normally conducted at a target exploitation level considered sustainable for the stock. In addition, fishing intensity can be high for short periods as long as stock biomass is not projected to fall in the cautious zone. Socio-economic considerations can be important primary drivers of the fishery.
In all zones fishing may be limited by ecosystem considerations.
The principal implication of this approach is that there is a continuum of fisheries management strategies with increasingly stringent management controls if the resource condition status declines below the level of the Healthy Zone.
Ideally the management principles and measures are set out beforehand for each zone so that as a stock moves from one zone to another the management response is pre-determined. When the stock condition moves from one Zone to another it triggers adjustments to management decisions. Decision rules are clearly spelled out in advance for the fishery in order to avoid unacceptable outcomes in terms of serious harm to the resource with high probability. The notion of avoiding serious harm drives the entire framework.
A PA framework will therefore be part of a strategic vision leading towards long-term recovery and sustainability of the 4TVn cod stock.
5.2 Species at Risk Act
The Species At Risk Act (SARA) came into full force in June of 2004. There are 47 aquatic species now protected under this Act. Once a species is listed it is prohibited "to kill, harm, harass, capture, take, possess, buy, sell, or trade an individual of an extirpated, endangered, or threatened species".
Several cod stocks are now being considered for SARA protection by the Committee on the Status of Endangered Wildlife in Canada (COSEWIC). The final decision on whether to list a species as being at risk rests with the federal Cabinet with advice from Treasury Board. The decision is expected in October 2005. The Cabinet will have required a recommendation from the Minister of Environment to the Privy Council Office by June 2005. For marine species the Minister of Environment will make his recommendation in consultation with the Minister of Fisheries and Oceans.
COSEWIC has thus far divided the cod stocks in Atlantic Canada into four populations units: Arctic, Laurentian North, Maritimes, Newfoundland and Labrador. If a decision is made not to list a particular population it will not be subject to the full regulatory process. An explanation must however be posted on the Public Registry.
The cod population in the Maritimes region is comprised of five separate stocks:
- Southern Gulf of St. Lawrence (4T);
- Cabot Strait (4Vn);
- Eastern Scotian Shelf (4VsW);
- Bay of Fundy-Western Scotian Shelf (4X), and;
- The Canadian portion of Georges Bank (5Zej,m).
COSEWIC has recommended to the Minister of Environment that all these stocks be categorized as "special concern" as opposed to the more serious classification of "endangered" or, with much more serious implications, "threatened". If cod populations were listed as "endangered" or "threatened" the conservation measures needed to mitigate the stock conditions would almost certainly have more serious socio-economic impacts.
Views on whether cod populations should be added to the endangered list are still quite polarized. Cabinet will decide on the COSEWIC recommendation in October of 2005. Among several consequences, the decision could limit the ability of MCART to develop its own management strategy.
5.3 The FRCC Planning Approach
The Fisheries Resource Conservation Council (FRCC) has suggested a long-term planning approach for cod stocks. The Plan has four components: objectives, strategies, control measures, and required information.
- Objectives and Goals
The objectives of the plan are twofold:
- Conservation and rebuilding of commercial groundfish stocks;
- Sustainable utilization and relative stability in the fishery management regime.
Goals for the conservation and rebuilding of stocks would include the following:
- To achieve ecosystem health through prevention or mitigation of disturbances to species diversity, genetic variability, ecosystem productivity, structure, function, and marine environmental quality habitat for target and non-target species.
- To rebuild the spawning stock biomass to the target range.
- To avoid over-exploitation of individual stock components and juvenile rearing areas within the management area.
- To establish strategies regarding the reproductive capacity of the stock, inter-seasonal stock dynamics, and stock interactions with other species in the ecosystem.
Specific goals for sustainable utilization and relative stability in the fishery management regime would include the following:
- To achieve sustainable use of ecosystem resources for the benefit of future generations.
- To maintain the fishery by ensuring a stable stream of income from the groundfish fishery to the communities that depend on it, as well as a steady source of ecosystem information from fish harvesters to complement scientific data.
- To adopt a longer-term view of stock management linked to spawning stock biomass levels and other indicators associated with the health of stock.
- To promote continuous improvement in stewardship of the resource through education.
- Recovery Strategies
A plan to reach the objectives set out above should contain the following elements:
- A planning horizon or timeframe;
- A precautionary approach to making decisions;
- Specific measures to protect juveniles;
- Specific measures to conserve biodiversity, and;
- Effective controls.
- Control Measures
Measures to ensure effective implementation of the plan should include:
- A clearly defined planning cycle and rebuilding schedule;
- Specific targets for rebuilding;
- A timeframe for achievement of targets;
- Definitions of unacceptable situations requiring mitigation or intervention;
- Baseline TAC and quota limits;
- Timeframe for specific changes in TAC and quota limits;
- Spawning closures and plans for protection of sub-stocks;
- Measures to protect juvenile fish;
- Conservation Management measures within conservation harvest plans.
- Research and Information Gathering:
The plan should address the following information issues:
- Data for management during intervals between full stock assessments;
- Stock status information from sentinel surveys, mobile full-coverage surveys, the recruitment index and spawning/reproductive capacity data;
- Predator and Prey Indicators; Regular Review
5.4 The Integrated Fisheries Management Plans (IFMP)
The concept of a more integrated approach to fisheries management plans was introduced in the mid-1990s. The objectives of the Integrated Fisheries Management Plan approach were:
- To increase uniformity in development and implementation of fisheries management plan;
- To increase transparency in the development of fisheries management strategies;
- To achieve a more stable and long-term approach to fisheries management through the development of multi-year plans, and;
- To integrate the roles and contributions of all relevant sectors of DFO.
5.5 An Emerging and Evolving Concept: Objective Based Fisheries Management
The IFMP approach has led to a major improvement in the elaboration of fisheries management plans because it factored in and integrated all the different components of DFO. However there was still a need for a system of measurable objectives.
It was felt that conservation had been approached as a concept and not as an explicit measurable goal. The roles of Science and Fisheries Management were still somewhat unclear and there were no performance objectives for evaluating the management of a fishery. It was also felt that not all risks were assessed or managed, and that the Precautionary Approach and overall ecosystem considerations were not always fully considered in the development of fisheries management plans.
The Objective-Based Fisheries Management concept adds to the IFMP process by setting conservation limits for target species and ecosystems and by setting fisheries management objectives based on biological and socio-economic aspects of the fishery. It also identifies the threats and challenges impacting on the conservation limits and develops strategies to overcome the challenges and mitigate the threats that could block the achievement of the established objectives. The OBFM approach adds more rigor to the IFMP process and produces formal documentation of objectives, principle, roles and accountabilities.
5.6 Comprehensive Ecosystem Analysis Approach
As another layer to an integrated objectives-based planning process within a precautionary approach, DFO Science, DFO Oceans and other technical bodies would present scientific and technical information on the impacts of fishing on a wider range of interdependent species and habitats within the ecosystem. In addition, species interactions (e.g. predator-prey relationships, competition, etc) would be quantified and their influence incorporated in analyses. Undesirable impacts on the ecosystem would be explicitly defined and supporting evidence presented, and conservation objectives and thresholds for the ecosystem would be set.
6. Southern Gulf Cod Recovery Strategy
This section sets out the proposed biomass recovery targets and a planning procedure for the recovery of the 4TVn cod stock. These will provide a basis for consultations with harvester groups and other stakeholders before recommendations to the Minister are finalized.
6.1 General Approach
The general recovery strategy is divided into three major areas of action. The first involves having a well-defined cautious harvesting approach for setting TAC’s and management of the fisheries. This involves several components including some discussed in the previous section. The second part of the strategy is to investigate potential stock recovery through predation control. If this experimental approach is endorsed and generates positive results then it could essentially speed-up recovery of the stock. Finally, the third part of the strategy is the need to maintain and improve the research capacity in order to better determine if progress is made. MCART believes that all areas of action need to be pursued.
At the base of the strategy is the need to have true partnership between stakeholders and the managers of the resource (currently DFO). In a true partnership, decisions are arrived through consensus and are then accepted by all. Shared responsibility for the results of the decisions is also assumed. Cooperation and collaboration become the rule and finger pointing, a past experience.
6.1.1 Components of the Strategy
The first part of the strategy contains several components and many of these are already in place through existing management plans. These include TAC Decision Rules, SARA, the Precautionary Approach, IFMP and OBFM as well as the need to have a well defined fleet management plan. However, the various elements need to be better integrated and form a cohesive approach.
The second part of the strategy involves embarking in an experimental management study of the role of predators (in this particular case, grey seals) on natural mortality. At the same time the strategy would also investigate the role of other potential predators.
Finally, the third part of the strategy involves maintaining research, improving the utilization of the data already collected and providing management plans for special initiatives where industry could conduct research.
6.1.2 Recovery targets
After initial consultations with industry, evaluation of alternative stock recovery strategies and review of the current and historical stock assessment data and the literature on, MCART proposes the following recovery targets for 4Tvn cod:
| Stock Component | Target |
|---|---|
| Threshold Spawning Stock Biomass | |
| Biomass | 70,000 to 90,000 t |
| Achieved by | 2008 to 2010 |
| Healthy Spawning Stock Biomass | |
| Biomass | 165,000 to 185,000 t |
| Achieved by | 2015 to 2020 |
| Optimal Spawning Stock Biomass | |
| Biomass | 200,000 to 250,000 t |
| Achieved by | 2020 to 2025 |
6.2 Fostering True Stewardship
In a chapter entitled "Shared Stewardship", DFO’s new fisheries management policy framework for the Atlantic coast sets out the following principle to govern resource management decision making:
Governments, resource users and others with an interest in the fisheries share responsibility of the sustainable use and economic viability of fisheries.Footnote 9
The framework specifies the areas of industry involvement in shared stewardship.
The new Atlantic fisheries management framework will therefore encourage resource users and the legitimate organizations that represent them, to assume a greater role in operational decision-making processes, in accordance with their capacity and degree of interest, and will hold them accountable for their choices. Resource users should be prepared to bear the incremental costs of the changes they propose.Footnote 10
In principle, DFO is committed to moving decision-making and accountability to industry through co-management arrangements and fisheries management planning processes. Over time, this policy direction should place greater limits on the role of the Minister and the Department. The role of the Minister hasn’t always been well understood or accepted. Many industry leaders will argue that there is too much political interference in decision-making on fisheries management and resource allocations. The alternative is that industry must take greater responsibility for conservation and for resolving conflicts over access and allocations without resorting to the "political route".
In the spirit of shared stewardship, the recovery plan for 4TVn cod will therefore incorporate an industry agreement on dispute resolution mechanisms and on the specific responsibilities of fleet sectors for achievement of conservation and rebuilding targets. The issue of industry contributions to the costs of science and resource protection will also be covered by the management plan.
Other stakeholders – fish processors, plant worker organizations, coastal communities, and environmental groups – also have a role in shared stewardship. The new DFO Policy Framework proposes public forums where these groups can have input to the planning process. This should happen in the context of the development of the 4TVn recovery plan – the planning process should be accessible and transparent.
The new DFO Policy Framework also commits the Department to helping to build the capacities of industry organization to participate fully in shared stewardship. The planning process should identify specific needs among industry groups for assistance in building such capacity.
Shared stewardship should be an integral element of the three major areas of action described below.
6.3 Implementing a Well-defined Cautious Harvesting Approach
6.3.1 TAC Decision Rules
A TAC Decision Rule Process has been initiated by DFO in 2004/2005 and should be completed in 2005. The process would then be used to establish TAC levels for 2006 and beyond. Conservation and management objectives and targets for the stock, including stock rebuilding objectives, have also been established through the process. Clearly defined objectives and measurable stock health indicators will be used as criteria for decision-making on TAC levels. The timing of each step in the decision-making process is predetermined and DFO and industry responsibilities and accountabilities are also clearly defined.
The following points have been identified and agreed to as essential decision-making on a TAC.
- Information sources for decision-making should be highly sensitive to changes in the abundance of the stock.
- If more than one information source is used they must be appropriately weighted.
- The decision-making process should make use of alternative sources of primary and secondary information and be able to withstand the loss of any particular information source.
- The output of the process must be oriented towards protection of the current stock biomass and favour re-building. In other words, the TAC-setting mechanism should be slow to rise and quick to fall.
- Among other outcomes, there must be a specified point, with a sound biological basis, at which there is no option but to close the fishery.
- There must be a binding agreement on all parties to honour a ruling on a TAC for an agreed period.
- There must be a performance review at the end of the planning period making use of previously agreed upon performance measures.
These general guidelines for decision-making have been agreed to between DFO and industry.
As a follow up to these guidelines, the preliminary set of TAC decision rules (see Annex I) established for 4TVn cod needs to be refined and finalized. Once ratified, these rules would then closely be adhered to in setting TACs.
6.3.2 Species At Risk Act
The harvesting strategy needs to recognize that SARA may be invoked in the short-term. While the immediate implication of the suggested SARA designation (special concern) for Southern Gulf cod would only require that a proper management plan be in place, a measure already applied, the strategy needs to recognize that further degradation of stock status could lead to more serious designations. If a more serious designation is applied, then there would be significant implications for the fishery.
6.3.3 Precautionary Approach
Once the status of the stock has been clarified relative to SARA, the next step is to elaborate a precautionary approach framework. If a species is in the Healthy Zone the management measures will be directed towards optimizing the socio-economic benefits derived from the fishery. If a stock is in the Cautious Zone the management approach will be mainly geared towards conservation but will with some socio-economic considerations. However if a stock is deemed to be in the Critical Zone the management framework must focus entirely on conservation and recovery measures.
The 4TVn cod stock is presently situated in the Critical Zone and until improvements occur in the spawning stock biomass the management framework will focus on conservation and recovery measures.
6.3.4 IFMP-OBFM
This Integrated Fisheries Management Plan provides an integrated approach to a specific fishery, including the latest scientific assessment picture, management measures, conservation and protection strategies and industry responsibilities with regard to conservation of stocks.
The IFMP for the stock is comprised of the following four elements:
- Objectives;
- Strategy to achieve objectives;
- Control measures, and;
- Research and information gathering activities.
A detailed description of the planning steps is set out in the following diagram:
[click on image to enlarge]
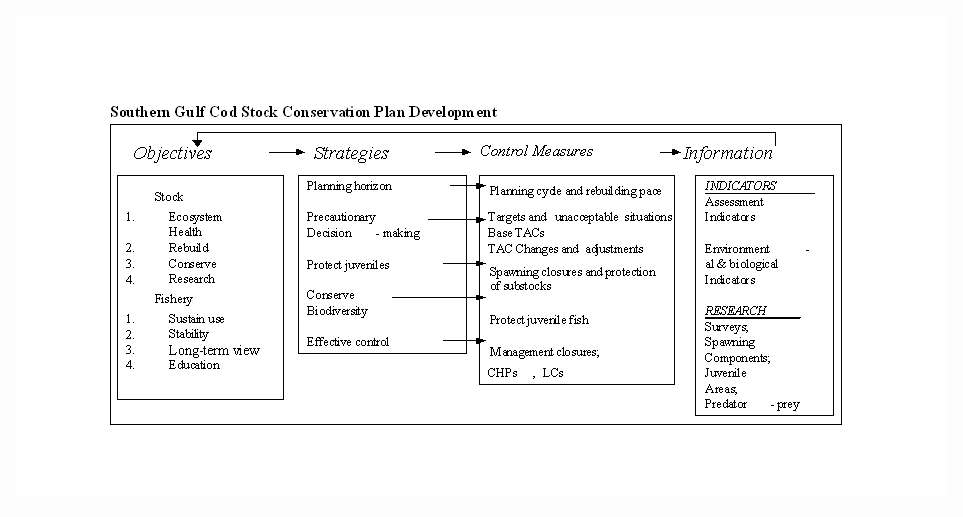
Southern Gulf Cod Conservation Plan Development
1. Ecosystem Health
2. Rebuild
3. Conserve
4. Research
Fishery
1. Sustain use
2. Stability
3. Long-term view
4. Education
- Planning horizon
- Precautionary Decision - making
- Project juveniles
- Conserve Biodiversity
- Effective control
- Planning cycle and rebuilding pace
- Targets and unacceptable situations Base TACs
TAC Changes and adjustments - Spawning closures and protection of substocks
- Protect juvenile fish
- Management closures, CHPs, LCs
Assessment
Indicators
Environmental and biological Indicators
RESEARCH
Surveys,
Spawning Components,
Juvenile
Areas,
Predator - prey
The present IFMP for 4TVn cod sets out the long-term objective in relation to conservation and sustainability and to user groups such as aboriginal fisheries, recreation fisheries and the commercial fishery. The present IFMP delineates the responsibility of industry and includes evaluation criteria for fisheries management and for conservation and protection. The IFMP also identifies the stakeholders and defines the consultative groups and processes. (See annex)
6.3.5 Fleet Management
Harvesting plans have often been a source of conflict between the different fleet sectors in a particular fishery. Sharing issues often arise whenever there is a reduction or an increase in the TAC. There is therefore a need to have a harvesting strategy in place to set out ahead of time how harvesting arrangements will be affected when the status of a stock changes.
If a stock, according to the Precautionary Approach framework, is in a Critical Zone there should be a predetermined limit on the number of vessels in each fleet sector that are allowed to harvest the resource. As the stock condition improves and enters the Cautious Zone there could be a limited increase in the number of vessels operating according to a pre-set formula. Only when the fishery is in the Healthy Zone should the whole fleet be allowed to participate in the fishery.
The recovery plan for 4TVn cod should therefore incorporate an agreement between DFO and industry on a formula for adjusting the numbers of vessels from each fleet type to be allowed into the fishery in each PA Zone. It is imperative that such an approach needs to be elaborated and endorsed by industry otherwise harvesting plan by each fleet sector will need to continue to be submitted on a yearly basis and will need to show that they fall within the cod recovery strategy.
6.4 Examine the Potential for Reduction in Natural Mortality
6.4.1 Predators
The experimental reduction of the grey seal population from the Gulf of St, Lawrence would require strict adherence to the UNEP protocols. This would mean that thorough analyses of the potential impacts of the activity need to be considered. Part of this activity would involve conducting a review of the number of animals to remove from the population and determining the most likely outcomes. A tentative estimate is given in section 4.6.
Given that the current harvesting of seals in Canada is conducted for commercial purposes, it would be desirable though not essential that the animals harvested produce some economic return in addition to the benefits in terms of understanding the potential relationship with cod.
Finally, in order to learn from the experiment, a number of monitoring and research activities will need to be put in place in order to determine whether the level of natural mortality has indeed declined. Ideally, there would be no other source of removals and natural mortality could then be estimated using data from successive surveys. In the presence of a limited fishery, other analyses will need to be conducted. A detailed research planning exercise will need to be conducted to determine the data requirements and analyses that will need to be carried out.
6.4.2 Other Causes
Concurrently, research must continue in examining potential causes for the increased natural mortality of southern Gulf cod over the past 20 years. A number of issues were examined at the National Advisory Process held in Halifax, N.S., in February 2003, however a review of research that has been completed since should be conducted to determine if there could be other likely causes for the increase in natural mortality of southern Gulf of St. Lawrence cod.
6.5 Maintain and Improve Research Capacity
6.5.1 Need for Ongoing Research
A specific step in the planning process for developing a recovery strategy for 4Tvn cod will be for DFO managers, scientists and industry groups to carry out a review of current stock assessment methods and data resources. The objective will be to develop a strategy to improve data collection and to find ways to address gaps in necessary information. In the context of shared stewardship this will likely involve an expanded role for harvesters in collecting data on the water, participating in analysis activities and perhaps contributing more to the costs of data collection.
6.5.2 Improving Data Utilization
Often times, good research or data are not always shared and used to the maximum benefit. An information sharing program needs to be elaborated and evaluated on an ongoing basis to make sure that the information and knowledge collected is used to its fullest by all stakeholders including fishermen at large (not only representatives), conservation and protection officers, and other stakeholders. Clearly, data and information needs to be at the base of all decisions.
6.5.3 Providing for Special Initiatives
With increased partnership and shared stewardship, including the general direction of the DFO to have partners take responsibility for some of the research activities, more research activities will be expected to be conducted by industry. There needs to be mechanisms put in place so that decision–making process on industry projects is well-defined and transparent. This would involve developing a consensus on the priorities, the potential of a quota reserve to cover removals associated with such initiatives and an independent panel to evaluate the scientific merit of individual proposals. Finally, a management board composed of both industry and DFO members could be responsible for making decisions from the list of scientifically sound projects to be supported in accordance with the research priorities.
6.5.4 Shared stewardship (diagram)
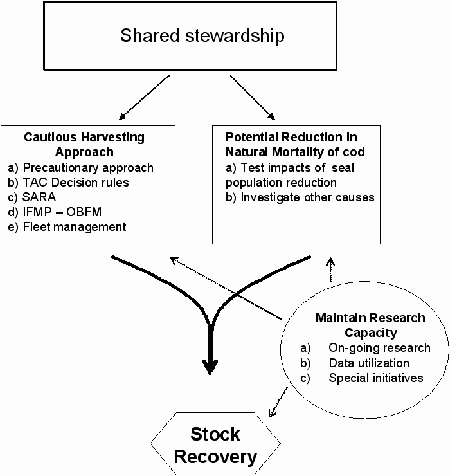
| Cautious Harversting Approach a) Precautionary approach b) TAC Decision rules c) SARA d) IFMP - OBFM e) Fleet Management |
Potential Reduction in Natural Mortality of cod a) Test impacts of seal population reduction b) Investigate other causes |
| Maintain Research Capacity a) On-going research b) Data utilization c) Special initiatives |
|
| Stock Recovery | |
6.5.5 Elements of the Recovery Plan for Southern Gulf of St. Lawrence Cod (table)
| Elements | Status | Action |
|---|---|---|
| General | ||
| Shared Stewardship | Need to identify means to improve shared stewardship | Prepare shared stewardship plan including definitions of responsibilities and accountability |
| Specific | ||
| Cautious Harvesting Approach | ||
| a) Precautionary approach | Interpretation of PA is loosly applied and Critical zone identified |
Clarify the application of the PA for the Canadian fisheries context. Apply management plan required for critical zone |
| b) TAC decision rules | Draft plan prepared in 2004/05 needs to be finalized | Finalize and implement plan |
| c) SARA | Waiting for decision on listing | Implement required management actions if listed |
| d) IFMP-OBFM | 2005-2006 plan in place | Implement plan |
| e) Fleet management | No long term harvesting plan | Prepare harvesting plan in relations to zones in PA and match capacity to resource potential |
| Potential Reduction in Natural Mortality of cod | ||
| a) Test impact of grey seal population reduction | No firm determination of cause in increased natural mortality but increase in grey seal population suspected | Prepared protocol and proceed with grey seal reduction research |
| b) Investigate other causes | Other causes have been investigated partially | Summarize the research on other issues and investigate other causes where necessary |
| Maintain Research Capacity | ||
| a) On going research | Need to maintain and expand going research | Identify research priorities with industry, establish cooperative aggrements |
| b) Data utilization | Need to review data utilization | Prepare Plan to improve utilization |
| c) Special iniatives | Capacity of industry to conduct research initiative not formerly recognized | Promote special research initiatives by industry/DFO collaboration to promote conservation |
Annex I – TAC Decision Rules
A strategy to determine annual TACs for the Southern Gulf cod stock (4TVn)
2005 – 2007 - Draft Decision Rules
Preamble
In May 2004, the Minister of Fisheries and Oceans invited government and industry representatives to jointly establish TAC Decision Rules beginning in 2005. It was apparent from the outset of Working Group discussions that there were some differences of view on the base level of the TAC from which increases or decreases would be implemented. Despite these differences the Working Group decided to proceed with the development of TAC Decision Rules.
The industry feels very strongly that seal predation is the major cause of poor stock performance in 4TVn cod, and that any other measures will be largely futile unless and until strong action is taken to curb the predation by seals on this stock. They believe that TAC rules are very unlikely to lead to increased quotas or even maintenance of the current fishery and as a result industry members expressed muted enthusiasm for this process. Nevertheless, on the provision they could put a strong statement about the effects of seals in the front of any document produced, their consensus was to continue with these discussions. The 2003 Stock Status Report indicates changes in natural mortality of cod (observed in this stock) are consistent with changes in the abundance of grey seals in this area.
This approach has been developed in a spirit of shared stewardship and a joint desire to eventually share a single cohesive view of this important stock and fishery.
Although this annual exercise for proposing TAC Decision Rules has been completed, some work remains to be done to establish a formal accountability accord between DFO and industry. This remains to be carried out in 2005 and should provide the framework for formalizing shared stewardship for this cod stock.
Strategy
The agreed strategy is to test the state of the stock by adjusting the TAC in response to recent changes in stock condition as monitored by a suite of stock abundance indicators and also considering stock productivity. For the decision-making process in 2005, the consolidated signals from these indicators (termed the Overall Adult Stock Indicator (OASI), see appendix III) are to be based on the trend of indicators for the period 1995 to 2004. However, future decisions may incorporate relative trends in indices covering a different period, e.g. fishery catch rates since the re-opening of the fishery relative to those experienced when the stock was in a healthy condition. The percent change in the OASI from 2002 to 2004 will be used for the establishment of the TAC for 2005-2006 and 2006-2007. To establish the TAC for 2007-2008 and 2008-2009, the consolidated signal from these indicators would be based on the trend of indicators for the period between 2005 and 2006. On this basis, it is agreed that the OASI will be used to monitor changes in stock condition during the coming test period.
The process to implement the approved TAC Decision Rules for 2005 involves a formal meeting of the Working Group as soon as possible following the Regional Assessment Process (RAP) for this cod stock. At this meeting, the Working Group will consider all relevant information that was provided by RAP, as it applies to the implementation of the decision rules by making a specific recommendation on the setting of TAC of the applicable 2-year period. A report of the results of the deliberations of the Working Group will be forwarded to the Gulf Groundfish Advisory Committee for comments. Prior to the 2006 RAP for this cod stock the Gulf Groundfish Advisory Committee will be tasked to review the overall process for implementing the approved TAC Decision Rules for the remaining of the trial period (2006 – 2007).
Notwithstanding the above, the Working Group will meet after the RAP yearly, to review all information tabled at the RAP to consider any adjustments to the initial TAC that is derived from the Decision Rules.
The rules are based on the three-zoned approach being developed as a framework for the application of the Precautionary Approach in the Canadian fishery. While these rules have not been formally evaluated it is believed that they would prevent much further harm from occurring if the index declines and would secure stock growth before permitting TAC increases until the stock clears the critical and cautious zones.
[click on image to enlarge]
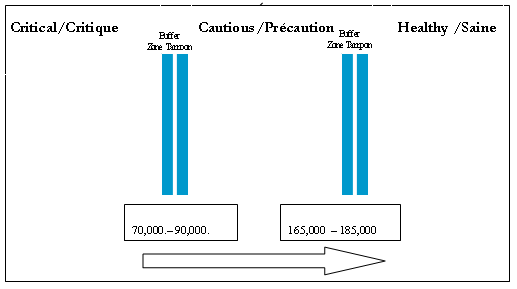
General
- The boundary between the Critical and Cautious Zones for Stock Status is a zone generally represented by the range of 70,000 t to 90,000 t of the Overall Adult stock Biomass (OASB) described herein – see Appendix I for definitions and Appendix III for detailed explanation.
- The boundary between Cautious and Healthy Zones for Stock Status is a zone generally represented by the range of 165,000 t to 185,000 t of the Overall Adult Stock Biomass (OASB) described herein - see Appendix I for definitions and Appendix III for detailed explanation. This designated range is preliminary, subject to confirmation based on further scientific review.
- The general goal is for the stock to rebuild to and remain in the Healthy Zone.
- The TAC is to be set at a level to promote arresting a decline in stock status within a 2-3 year period, and/or promote rebuilding towards the Healthy Zone, and/or maintaining the stock within the Healthy Zone. It is understood that the ability to achieve these objectives can be strongly influenced by non-fishing mortality.
- This suite of decision rules is to remain in effect for an initial trial period of 3 years, subject to there being agreement among industry, and between industry and DFO that an adjustment is required within that period. At the end of this trial period, this framework will be reviewed in terms of its functionality and the overall stock re-building objective.
- In each year during the 3-year trial period, a working group of DFO/Industry representatives will review information provided by the Regional Assessment Process (RAP), and consider proposing options and/or recommendations consistent with these TAC Decision Rules to be considered by the Gulf Groundfish Advisory Committee. Decisions and/or recommendations of the GGAC will be forwarded to the Minister.
- Decisions are to be based on a suite of Abundance/Biomass Indicators summarized in an index called the Overall Adult Stock Indicator (OASI - see Appendix I for definitions and Appendix III for calculations) and the OASB (Overall Adult Stock Biomass), Productivity Indicators and Environmental Indicators (see Appendix II). Especially when the OASB is within the Critical and Cautious Zones, decisions based on Abundance Indicators are to be evaluated and modified as appropriate to reflect circumstance with respect to both Productivity Indicators and Environmental Indicators. The order of rule application, indicating the primary measure involved, will be as followed:
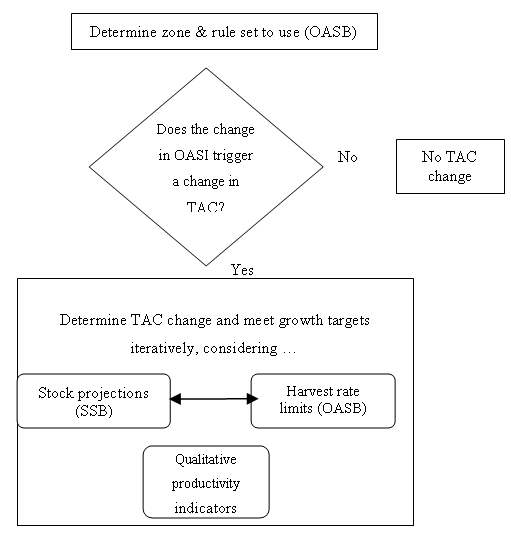
Determine zone & rule set to use (OASB)
Does the change in OASI trigger a change in TAC?
If no, no TAC change.
If yes, determine TAC change and meet growth targets iteratively, considering...
Qualitative productivity indicators
- The starting TAC for the purpose of these rules shall be the 2004 TAC of 3,000 tons. The TACs for the trial period 2005-2007 may be adjusted based on rules, which respond to incremental changes in the OASI. In future, the base TAC to which these rules shall be applied will be the TAC in effect at that time.
- The use of 2-year periods for TACs will be implemented and is intended to enhance stability and reduce the impact of year-to-year fluctuations in indicators on the TAC.
- If the OASB is within the buffer of a boundary, then the zone will be determined by the direction of the OASI. If the OASI is declining then the zone will be determined to be the one where management action is more prudent (e.g. in the critical/cautious buffer with OASI declining then zone = critical). If the OASI is increasing then the zone will be determined to be the one where management action is relatively more liberal (e.g. critical/cautious with OASI increasing then zone=cautious).
Critical Zone
- Harvest and conservation-related decisions will reflect extreme caution, particularly if the stock is declining.
- Beginning with the 2005-06 season, the TAC will be set for 2-year periods, unless it is reduced by the interim year rule (#5)
- If the OASI declines by >10% over the most recent 2 years, (e.g. for 2005-2006, the change from 2002 to 2004) and a two year projection does not show a subsequent reversal in the decline without a reduction in fishing mortality, then the TAC will be reduced.
- An increase in the TAC may be contemplated if the OASI has increased by at least 10% over the most recent 2 years, and productivity indicators project an overall growth of the assessment SSB greater than 15% within the following 2 years of the increase.
- In the interim year of a 2-year TAC period, a TAC reduction could result from one of two situations:
- If, over the previous 2-year period, consecutive declines in the OASI total 15% or greater, and a 2-year projection does not show a subsequent reversal in the decline without a reduction in fishing mortality, then the TAC will be reduced.
- If, over the previous 2-year period, an increase in the OASI followed by a decrease produce a net decline over 2-years totalling 15% or greater, the Working Group will consider whether a reduction in the TAC is warranted.
- Harvest rate to be set no greater than 7% of the OASB.
- Any increase in the TAC will be at minimum increments or multiples of 1,000 tons.
- If the OASB is below 70,000 t and stable or declining, the application of rules 6 and 7 above would limit TAC options for total removals to be either 3000 tons, 2000 tons, 1000 tons, or as close to zero as possible.
Cautious Zone
There are two key factors to guide decisions on the harvest rate to be employed (up to 19%) when the OASB is in this zone, i.e. the position/level of the OASB within the zone, and the dynamic/direction of change in the OASI. Conceptually, the harvest rate would be at the higher part of the range when the OASB is near the Healthy zone and is increasing, but much lower when the OASB is near the Critical zone and the OASI is decreasing.
- Harvest and conservation-related decisions will reflect caution, particularly if the stock is declining.
- A reduction in the TAC is to be initiated even if the current OASI has not actually declined, if a decline projected 3 years in the future is again projected for 2 years in the future in the following year’s assessment. Management action to reduce the TAC is to be relatively more aggressive if the OASB is closer to the Critical Zone.
- In the cautious zone, the maximum harvest rate is to be set at a maximum level of 19% with the rate being must lower as the OASB nears the Critical Zone.
- When the OASI is increasing, the harvest rate to be set at a level that promotes continued rebuilding of the OASB towards the Healthy Zone at a rate of >10% over the 2-year period, with the maximum harvest rate not to exceed 19% of the OASB.
- TAC to be set for 2-year periods.
- The TAC will not change if the current change in the OASI is less than 10% over the 2-year period, unless the projections identified in item 2 above indicate a reduction in the TAC is warranted to arrest an anticipated decline in the OASB.
- Any change in the TAC will be at increments or multiples of 1,000 tons.
Healthy Zone
- TAC to be set for 2-year periods.
- Maximum harvest rate not to exceed 23% of the OASB, or the equivalent of F0.1 converted to the percentage harvest rate of the OASB. Selection of the harvest rate is to promote rebuilding/maintaining a healthy age structure of the OASB.
- Any change in the TAC will be at increments or multiples of 1,000 tons.
Species at Risk Act (SARA)
Notwithstanding all of the above, if this cod population is listed under SARA during the trial period, the Working Group will meet to consider the situation related to the impact on the decision rules. All parties recognize that the Minister is bound by the Species at Risk Act, which would override the above decision rules subject to related listing.
Appendix I - Definitions
SSB (Spawning Stock Biomass): refers to the estimate of spawning stock biomass contained in the DFO stock status and based on the assessment of the resource. For this stock, the SSB is usually obtained by calibration of an age structured population model.
OASI(Overall Adult Stock Indicator): refers to the indicator of adult stock derived from the abundance indicators (see Appendix III for calculation details).
OASB(Overall Adult Stock Biomass): refers to the equivalent of the OASI in terms of biomass (see Appendix III for calculation details).
Appendix II - LIST OF INDICATORS (In no order of priority)
Abundance:
- Age 5+ weight per tow for cod from the September Southern Gulf survey conducted by DFO (1971-2002, 2004)
- Sentinel longline standardized catch rate (kg/1000 hooks) (1995 – 2004)
- Spawning stock biomass from the analytical assessments (1950 – 2004)
- Fishermen Views Index derived from the telephone survey of about 25% of the active groundfish fishers (1997 – 2002, 2004)
- Age 5+ weight per tow from the August sentinel mobile gear survey (2003 – 2004)
- Fishery catch rates since the re-opening of the fishery relative to those experienced when the stock was in a healthy condition (1999-2002, 2004, details to be reviewed at RAP in 2005).
Productivity:
- Number of predators (grey seals, 1970 – most recent levels available)
- Recruitment index (1950-2004)
- Weight at age (fishery and survey) (1950 – 2004)
- Biomass of pelagics (mackerel and herring) (1970- most recent levels available)
Environment:
- Area of the bottom with temperatures less than 1o C (1971 – 2004)
Appendix III - Details on the calculation and use of the Overall Adult Stock Indicator (OASI) and Overall Adult Stock Biomass (OASB) for TAC Decision Rules of Southern Gulf of St. Lawrence Cod
One of the components of the TAC Decision Rules for Southern Gulf of St. Lawrence cod is the calculation of an Overall Adult Stock Indicator (OASI). The following describes how the OASI would be calculated. The status and the rate of change of the OASI would be used in the TAC Decision Rules. Because the TAC is for the exploitable portion of the population, the OASI should be representative of that part of the stock. The exploitable portion of the stock is approximately equivalent to the spawning stock biomass.
The OASI will be based on the following six indicators, weighted equally subject to further consideration if a significant outlier is produced by any of the indicators in a given year.
- Age 5+ weight per tow for cod from the September Southern Gulf survey conducted by DFO (1971-2002, 2004)
- Sentinel longline standardized catch rate (kg/1000 hooks) (1995 – 2004)
- Spawning stock biomass from the analytical assessments (1950 – 2003)
- Fishermen Views Index derived from the telephone survey of about 25% of the active groundfish fishers (1996 – 2002, 2004)
- Age 5+ weight per tow from the August sentinel mobile gear survey (2003 – 2004)
- Fishery catch rates since the re-opening of the fishery relative to those experienced when the stock was in a healthy condition (1999-2004, details to be reviewed at RAP in 2005).
The OASI would be calculated in the following manner:
- Each individual indicator will be normalized to a common reference period. This is achieved by dividing each value of the indicator by the average for the common reference period for that indicator. The common reference could be the average of a set of years (for example: 1996-2002) or an individual year. Because the sentinel mobile gear survey only starts in 2003, the common reference for all indices would be the year 2004 (Note that there are some difficulties with the 2003 RV survey).
- The un-weighted average of the normalized indicators would be calculated. This average would be considered the OASI. It is understood that in some years some of the indicators may not be available but there should be a minimum of 4 indicators to calculate the OASI.
Rate of Change of the OASI:
For the purpose of the TAC Decision Rules, a one year and a two year rate of change in the OASI will be calculated. This will be calculated as follows
One year = {(OASIYear 2 - OASIYear 1 )/ OASIYear 1 } X 100
Two year = {(OASIYear 3 - OASIYear 1 )/ OASIYear 1 } X 100
It should be noted that the rates of change of the OASI depend to some extent on the common reference used to normalize the indices. However differences are usually small providing several indices are used to arrive at the OASI.
Overall Adult Stock Indicator and the Critical/Cautious and Cautious/Healthy boundaries:
Because the boundaries of the Critical/Cautious and Cautious/Healthy boundaries have been derived from the stock assessment SSB, these boundaries would be translated in units of the OASI by dividing the boundary (and buffer) values by the average of the SSB for the common reference period. For example, if the average of the common reference period for SSB is 70,000, then the estimates of the boundaries (C/C =80,000 and C/H = 175,000) would be divided by 70,000 and plotted with the OASI.
Uses of the Overall Adult Stock Indicator:
- The OASI will be used to calculate the OASB to determine the zone that the stock is considered to be in (critical, cautious or healthy). If the OASB is within the buffer of a boundary, then the zone will be determined by the direction of the OASI. If the OASI is declining then the zone will be determined to be the one where management action is more prudent (e.g. in the critical/cautious buffer with OASI declining then zone = critical). If the OASI is increasing then the zone will be determined to be the one where management action is less prudent (e.g. critical/cautious with OASI increasing then zone=cautious).
- The rate of change in the OASI (over one or two years) will be used in the decision to increase or reduce the harvest rates (see the decision rules).
- If the rate of change in the OASI suggests that an increase in the TAC may be appropriate, a 3-year projection using SSB from the assessment will be done. Projections will be done using the most realistic values for growth, recruitment and natural mortality given current information and trends. Projections will be done for the current harvest rates and for higher harvest rates resulting in steps of 1,000 t in catch biomass or steps of 1% of harvest rate. If projections at higher harvest rates indicate that a 15% increase in the assessment SSB is possible then the ‘‘working group’’ would need to make a decision on the harvest rate to use. The harvest rate would not exceed those specified in the rules for the zone.
- Once a harvest rate has been decided (combination of decision rule and judgment based on indicators of productivity, environment, etc), the TAC would be determined by converting the OASI in biomass and applying the harvest rate. The conversion of the OASI to biomass would be done by multiplying the OASI by the average SSB for the common reference period. This quantity is called the Overall Adult Stock Biomass (OASB) for the purpose of the TAC decision rules.
Appendix IV - Incorporating Non-Abundance Indicators into Decision Rule Framework
In the TAC decision rules for Southern Gulf of St. Lawrence cod, the decision regarding the harvest rate to be applied would be based on the decision rules and judgment of suite of indicators relating to productivity and environment. For Southern Gulf of St. Lawrence, the indicators of productivity would include recruitment estimates based on SPA, weights-at-age (age 6) from research surveys (indicator of growth), the number of grey seals (indicator of M) and estimates of pelagic biomass (indicator of conditions for egg and larvae survival). Currently, the indicator of the environment incorporates the bottom area with temperatures less than 1 °C. Other indicators may be added to each of these categories.
Given that each of these indicators extend over long periods (30+ to 50+ years), they can regarded to cover the range of potential values for these indicators. In this context, the lowest third of the observations can be considered as poor (red, black in the figure below), the middle third as average (or neutral - white) and the upper third as good (green, hatched in the figure). For indicators where a negative effect is postulated (e.g. high area of cold water (< 1) having likely negative effects, high number of seals causing increases in M (a negative), etc), the zones would be reversed (lowest third –green and upper third –red).
To classify each observation in the appropriate zone, the observations are first ranked and the value of the observation at the 33 percentile would correspond to one boundary and that of the 66 percentile corresponds to the other. For example, if there are 30 observations, the values are first ranked from the lowest to the highest. The values of the 10th and 20th observations would thus correspond to the boundaries to classify the observations.
For each indicator, a graph showing the time series of values and their different colours corresponding to each zone would be presented. For the most recent year, a composite (e.g. a pie chart) could show the colors for each indicator of productivity. The Working Group would use judgment in determining the harvest rate but, in general, if indicators are predominantly poor (red), a lower harvest rate would be suggested while a higher harvest rate could be used if indicators are predominantly good (green).
Recruitment
Example of poor (black), neutral (white) and good (hatched) values for recruitment.
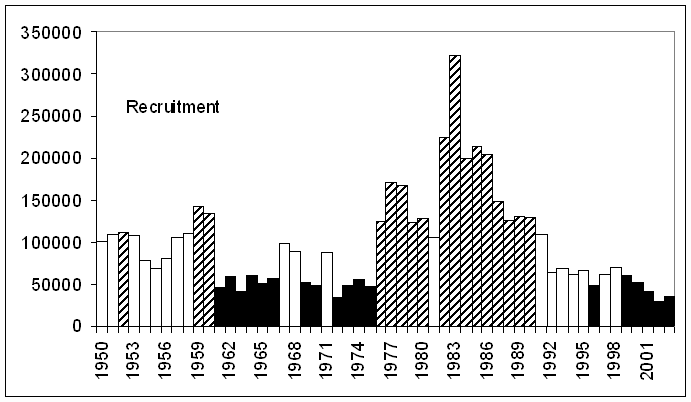
Annex II - IFMP 4TVn cod
LONG-TERM OBJECTIVES FOR THE FISHERY
- To ensure the conservation and protection of the stocks through the application of sound management practices.
- In consultation with resource users, to develop Conservation Harvesting Plans (CHPs) and implement management approaches that will enable the stocks to either rebuild to their former TAC levels or maintain existing healthy levels, depending on the stock.
- To determine the linkages, if any, of this stock with adjacent stocks of the same species.
- To manage the fishery so that catches are in line with the current quota shares.
- To ensure the essential data is gathered to assess the health of the stock.
III. MANAGEMENT OBJECTIVES
To work with commercial, aboriginal and recreational users of the resources to ensure sustainable utilization of stocks that will allow an economically viable, self reliant fishing industry.
To work with industry to ensure proper monitoring and control of all catches while minimizing by-catches of closed species and small fish.
To provide for the food, social and ceremonial requirements of aboriginal communities within the conservation requirements of stocks.
Conservation/sustainability
- To determine, in partnership with industry and the Department, the management measures that will most likely result in the attainment of the long-term objectives for this stock.
- Allocation of the stocks will continue to be on the basis of equity taking into account adjacency to the resource, the relative dependence of coastal communities and the various fleet sectors upon a given resource, economic efficiency and fleet mobility.
- Coordination of the deployment of fishing fleets over the fishing grounds and the length of the operating season.
- Utilization of the fishery resources over the calendar year to the degree possible.
- All gear types to be subject to quota management.
- Conservation Harvesting Plans are required for all fleets involved in groundfish fisheries or other fisheries with groundfish bycatches.
- Comprehensive management measures will be enhanced to sharply reduce catches of small fish and bycatches.
Domestic Considerations
Aboriginal
The Aboriginal Fisheries Strategy (AFS) was a response to the 1990 Supreme Court of Canada decision in the Sparrow case which found that an Aboriginal right to fish for food, social and ceremonial purposes has priority, after conservation, over other uses of fisheries resources and that the right is communal in nature.
The AFS encourages Aboriginal involvement in all aspects of the fisheries and fish habitat management and limited participation by First Nations in commercial fishing and related economic opportunities. Agreements are negotiated with First Nations in areas where the Department manages the fishery (British Columbia, the Atlantic provinces, Quebec and Arctic Canada).
The Allocation Transfer Program (ATP) has been initiated to voluntarily retire licences from the commercial fishery so that they can be transferred to Aboriginal groups. The program applies to a broad range of commercial fishing activities of interest to Aboriginal communities.
Any fishing licence, including those with groundfish components, acquired by First Nations and First Nation organizations through the AFS program are subject to the same terms and conditions as those applied to non-Aboriginal commercial licences.
Recreational
Groundfish recreational fisheries take place in most areas of eastern Canada. As well, areas such as Newfoundland and Quebec's Lower North Shore have a substantial food fishery. In 1999, the three-weekend long food fishery on the west and south coast of Newfoundland landed about 380 t of groundfish, most of which was cod.
Recreational fisheries can basically be divided into two types. Many people fish recreationally from their private boats on the weekend. As well, in some areas such (e.g. Prince Edward Island) a charter boat industry takes people out fishing for groundfish and other fish.
Commercial
The vast majority of groundfish are caught in the commercial fisheries. Overall objective is to manage the fisheries on a sustainable level to ensure the long-term economic viability of the industry.
Exploratory
Exploratory fisheries exist for species or stocks that are not currently under quota management. Exploratory, or emerging fisheries, have taken on a bigger role in recent years with the downturn in traditional species. Each Region manages a number of exploratory fisheries under the newly developed Emerging Fisheries Policy. This policy basically sets out guidelines for such fisheries so that they are managed on a small scale in order to gain enough scientific information to be in a position to assess future viability for the species/stocks.
IV. INDUSTRY RESPONSIBILITIES
Industry is responsible for the following:
- Implementation of a catch monitoring strategy that is acceptable to the Department.
- Participation in the development of CHPs for the fishing season.
- Participation in the development and evaluation of the management plan.
- The fixed gear sector in the Scotia-Fundy sector is responsible for reallocation of the fixed gear <45’ quota into the various community quota groups. Each community group will be responsible for developing its harvesting plans complete with seasonal quotas and further sub-allocations for the different gear types. At the present time, any fixed gear boat quota system will be managed by the industry.
V. MANAGEMENT PLAN EVALUATION CRITERIA
- Quota levels not exceeded.
- Essential data to assess the health of all groundfish stocks collected and supplied to Science for analysis and input into stock assessment process.
- Bycatch and small fish protocols followed.
VI. CONSERVATION & PROTECTION PLAN EVALUATION CRITERIA
Measuring the effectiveness of enforcement programs and the level of compliance achieved is a challenge for all law enforcement agencies. At best, DFO can only use indicators to identify trends as to whether the level of non-compliance is increasing or decreasing. In this regard, the following criteria are being used:
- Number of incident reports
- Number of vessels checked
- Number of boardings (at sea/dockside)
- Number of dockside checks
- Number of persons checked
- Number of vehicles checked
- Number of vessel sightings
- Number of sightings of illegal gear
- Number of seizures of illegal gear
- Number of violations (by type)
- Number of written warnings given (by type)
- Number of charges laid (by type)
- Number of prosecutions and penalties
- Number of patrols by type
- Number of sanctions and penalties
- Number of violations detected as a result of vehicle patrols
- Number of violations detected as a result of vessel patrols
- Number of violations detected as a result of air patrols
- Results of client surveys
- Feedback from Fishery Officers
- Feedback from advisory groups
- Media Coverage
- Comparison of catch data between observed and non-observed vessels
- Analysis of catch data gathered from random at-sea boardings
VII. CONSULTATIVE GROUP
There is no Atlantic-wide consultative mechanism. Each Region or Sector has its own advisory process. All committees include: representatives of fishermen’s groups; processors and provincial governments.
Gulf Groundfish Advisory Committee
This committee provides recommendations on the management of all 4RST, 3Pn stocks. It is comprised of industry and provincial representatives from Quebec, New Brunswick, Prince Edward Island, western Newfoundland and Gulf Nova Scotia.
References
Management Strategies for Recovery of Atlantic Cod Stocks on the Eastern Scotian Shelf (4VsW) and in Sydney Bight (4Vn(May-Oct.) draft: 17 march, 2005. Halliday &Lock
1.Marine mammals and Fisheries; Edited by J.R. Beddington, R.J.H. Beverton,D.M.Lavigne; London; George Allen and Unwin
Factors implicated in the lack of recovery of southern Gulf of St. Lawrence cod since the early 1990’s; G. A. Chouinard, A.F. Sinclair and D.P. Swain. Department of Fisheries and Oceans, Gulf Fisheries Center, P.O. Box 5030, 343 University Ave. Moncton, NB, E1C 9B6 CANADA
Effect of the North Atlantic Oscillation of recruitment of Atlantic cod (Gadus morhur); K Brander and R Mohn . Can. J. Fish Aquat. Sci. 61 1558-1564 (2004)
Reconciling overfishing and climat change with stock dynamics of Atlantic cod (Gadus morhua) G. A. Rose Can. J. Fish. Aquat. Sci. 61 1553-1557 (2004)
Fact sheet on Norwegian coastal seals, Ministry of Fisheries and Coastal Affairs, Olso, Norway. The Ministry’s homepage in English
Principles and realities for successful fish stock recovery oe a review of some successes and failures; Joseph E. Powers, Southeast Fisheries Science Center, National Marine Fisheries Services, National Oceanic and Atmospheric Administration, 75 Virginia Beach Drive, Miami, FL 33149 USA
Atlantic Mackerel of the Northwest Atlantic-Update (2001) Fisheries and Oceans Canada, Science, Quebec region, stock status report B4-04 (2002)
An improved link between industry, management and science: review of the case history of the Southwestern Gulf of St. Lawrence snow crab fishery; John S. Loch, Mikio Moriyasu, and James B Jones, Department of Fisheries and Oceans, Science Branch and Fisheries Management Branch, Gulf Fisheries Center, P.O. Box 5030, Moncton, NB E1C 9B6, Canada May 31,1995
Comment – An improved link between industry, management and science: review of case history of the southwesthern Gulf of St. Lawrence snow crab fishery: Bernard Sainte –Marie, Can. J. Fish. Aqaut. Sci. 54: 496-500 (1997)
Reply- An improved link between industry, management and science: review of case history of the southwesthern Gulf of St. Lawrence snow crab fishery. Can. J. Fish. Aqaut. Sci. 54:501-502 (1997)
Review of population structure, distribution and abundance of cod (Gadus morhua) in Atlantic Canada in a species-at-risk context; R" K. Smedbol, P.A. Shelton, D.P. Swain, A. Fréchet, and G.A. Chouinard, Fisheries and Oceans Canada, Science , Canadian Science Advisory Secretariat , Research Document 2002/082
Production analysis of southern Gulf of St. Lawrence cod for the identification of biological reference points; Fisheries and Oceans Canada, Science: Canadian Science Advisory Secretariat; Research Document 2004/039
Invasive Invaders: http:/www.upea.net/districts/lawenforcement/aNaturalRes2.htm
Present Distribution of the Rabbit in Australia: Economic and Ecological Impacts of Rabbits- History of the European Wild Rabbit in Australia. http://rubens. Anu.edu.au/student.projects/rabbits/history.html
Deer Cull to Conserve British Birds; The High North publication, The International Harpoon, No. 1, 1995, published during the 1995 Annual Meeting of the International Whaling Commission
National deer cull disastrous; http:/news.bbc.co.uk-news/3489825.stm
Crying wolf? By Adam Killick, Yukon News reporter
B.C. government ponders, wolf, cougar kill to protect rare marmots: by Dirk Meissner Victoria (CP)
Cormorant cull begins as controversy rages; Anglers and hunters, animal rights groups battle over ministry plan; By John Dunford; The Independent, May 12, 2004
Biologist Sounds Battle Against Unwelcome Amphivian (American bullfrog) CBC News Online at http://www.cbc.ca/news
Kangaroo cull targets millions: By Phil Mercer, BBC regional reporter In Brisbane; Feb. 21, 2002
Norway suggests tourist seal hunts: BBC World News, November 7,2001
Cod in the Southern Gulf of St. Lawrence: Fisheries and Oceans Canada, Science Gulf Region, Stock status report 2005/007
Objective-based Fisheries Management, Gulf Region, DFO; Gulf Region pre-pilot workshop, March 7, 2001, Moncton, New Brunswick
Estimated Consumption of Atlantic Cod (Gadus morhua) and some Other Prey by Grey Seals (halichoerus grypus) and Harp seals ( Phoca groenlandica), in the southern Gulf of St. Lawrence (NAFO Division 4T) : by M.O. Hammill and G.B. Stenson. Fisheries and Oceans Canada, Science, Canadian Advisory Secretariat, Research Document 2002/054
Assessment of the Status of Division 4x/5y Haddock in 2003: P.C.F Hurley, G.A.P. Black, J.E. Simon, R.K. Mohn, and P.A. Comeau. Fisheries and Oceans Canada, Science, Canadian Advisory Secretariat, Research Document 2003/104
Recovering Canadian Atlantic Stocks: The Shape of things to come? Jake C. Rice, Peter A.Shelton, Denis Rivard, Chislain A. Chouinard and Alain Fréchet; International Council for Exploration of the Sea; CM 2003/U:06, The Scope and Effectiveness of Stock Recovery in Fishery Management
Golf of St. Lawrence Cod Fisheries; Development of TAC Decision Rules for 2005 and beyond, draft, DFO Gulf Region, Moncton, N.B.
Canada-Maritime Action Team for Cod Recovery; Profile of the Groundfish Fishery in the Gulf Region, Policy and Economics Branch, March 2004
The 2004 Working Draft of the Precautionary Approach (PA) Framework for Management of Fisheries in DFO, Department of Fisheries and Oceans draft July 9th 2004
Summary of information on the status of the Southern Gulf of St. Lawrence cod stock (NAFO 4t-Vn November-April) in the context of rebuilding: G.A. Chouinard, Gulf Fisheries Centre, P.O. Box 5030, Moncton, N.B. E1C 9B6
Species at Risk Act: Summary presented for the Canada/Maritime Action Team for Cod Recovery, September 21, 2004. Prepared by DFO
Cod in the Southern Gulf of St. Lawrence, Fisheries and Oceans Canada, Gulf Region, DFO Science, Stock Status report 2003/016
The agreed recovery plan in the management of Norwegian spring-spawning herring; ICES CM 2003/U:01
Management of a straddling fish stock: the case of the Norwegian spring-spawning herring fishery: by Trond Bjorndal, Center for Fisheries Economics, Institute for Research in Economics and Business Administration, Breiviken 2, N-5045 Bergen, Norway
Recent history of Atlanto-Scandian herring stocks: by Erling Bakken, Institute of Marine Research, Bergen, Norway.
The rise and fall of cod (Gadus morhua) in the North Sea; R. Collin A. Bannister, Center for Environment, Fisheries and Aquaculture Science, Pakefield Road, Lowestoft, Suffolk NR33 OHT, UK. Extracted from book: Management of Shared Fish Stocks, Edited by A.I.L. Payne, C.M. O’Brien and S.I. Rogers, Center for Environment, Fisheries and Aquaculture Science (CEFAS) Lowestoft Laboratory, Pakefield Road, Lowestoft, Suffolk. Blackwell Publishing
Haddock on the Southern Scotian Shelf and Bay of Fundy (Div. 4x/5y) Fisheries and Oceans Canada, Science, Maritimes Region, Stock Status Report 2003/051
Canada-Newfoundland and Labrador Action for Cod Recovery: Workshop on Cod Recovery briefing book, Delta Hotel and Convention Center, February 1-2, 2005
- Date modified: