
Monitoring and Compliance - 2007 Cod Fisheries - March 26, 2008
The text version of the presentation is available below.
The PowerPoint presentation is also available as a Microsoft PowerPoint file (*.ppt).
Slide 1: Monitoring and Compliance - 2007 Cod Fisheries - March 26, 2008 - Conservation & Protection Division
Slide 2: C&P Division
The Conservation & Protection (C&P) Division carries out fisheries monitoring and compliance-related work for DFO
This presentation is about monitoring and compliance in 2007 cod fisheries.
Slide 3: How did we monitor cod fisheries?
Commercial/Stewardship fishery:
- At-Sea Observers
- Dockside Monitoring Program
- Fishery Officers (land, sea and air)
Recreational fishery:
- Fishery Officers (land, sea and air)
Slide 4: At Sea Observers
- Commercial / Stewardship fishery
- 570 "sea days" by At-Sea Observers
- 380 cod fishery deployments
Slide 5: Dockside Monitoring
All stewardship cod fishery landings were subject to the Dockside Monitoring Program
- Total of 100 ports in 2J3KL:
- 36 with 100% dockside monitoring
- 64 with random dockside monitoring
- Monitoring performed by Fish Harvesters' Resource Centre
- ~ 90% of landings (by weight) were to be physically monitored
Slide 6: Dockside Monitoring
Commercial cod fishery landings were also subject to the Dockside Monitoring Program
- Total of 100 ports in 4R 3Pn:
- 36 with 100% dockside monitoring
- 64 with random dockside monitoring
- in 3Ps:
- 37 ports with random dockside monitoring
- The remaining have with 100% dockside monitoring
- ~ 90% of landings (by weight) were to be physically monitored
Slide 7: Monitoring Fishery Officer Patrols
There are ~ 100 Fishery Officers stationed in NL Region.
In 2007:
Officers spent 6,452 hours on the recreational groundfish fishery:
4,460 patrol hours and 1,992 hrs on other activities
2,051 vessel checks and 4,599 persons checked
Officers spent 16,266 hours on the commercial / stewardship cod fishery:
5,984 patrol hours and 10,274 on other activities
(mostly investigations)
949 vessel checks and 1185 persons checked
Slide 8: Recreational Fishery Monitoring
Fishery Officers recorded daily estimates, for their areas of responsibility, of:
- average weight of cod caught,
- average number of cod per person,
- average number of persons per boat, and
- number of boat trips made.
Estimates based on observations during patrols, knowledge of local area, and on other available information.
Information on weather conditions, patrols and inspections also recorded.
Slide 9: Recreational Fishery Monitoring
Fishery Officer information was rolled up by Detachments on a weekly basis, and sent to RHQ for roll-up.
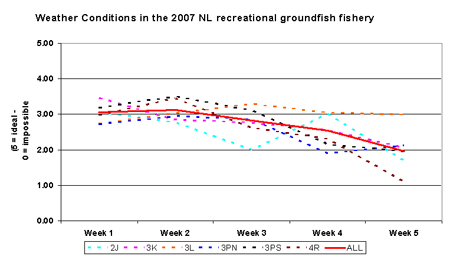
Slide 10: Monitoring of Rec. Fishery Weather
Slide 11: Monitoring of Rec. Fishery - Participation 2007
| NAFO Div | Week 1 | Week 2 | Week 3 | Week 4 | Week 5 | Total |
|---|---|---|---|---|---|---|
| 2J | 190 | 129 | 148 | 282 | 168 | 917 |
| 3K | 4,461 | 3,566 | 2,856 | 2,923 | 3,561 | 17,366 |
| 3L | 3,190 | 3,962 | 4,806 | 3,846 | 12,402 | 28,206 |
| 3PN | 820 | 564 | 626 | 336 | 824 | 3,170 |
| 3PS | 1,486 | 1,765 | 1,806 | 912 | 1,201 | 7,170 |
| 4R | 2,635 | 3,422 | 2,844 | 2,151 | 1,289 | 12,341 |
| ALL | 12,782 | 13,408 | 13,086 | 10,450 | 19,445 | 69,170 |
Slide 12: Monitoring of Rec. Fishery - Landings 2007
| NAFO Div | Week 1 | Week 2 | Week 3 | Week 4 | Week 5 | Total |
|---|---|---|---|---|---|---|
| 2J | 581 | 363 | 729 | 1,706 | 1,706 | 5,085 |
| 3K | 28,003 | 23,597 | 20,037 | 26,289 | 42,257 | 140,182 |
| 3L | 28,141 | 25,669 | 37,375 | 24,462 | 110,085 | 225,733 |
| 3PN | 4,616 | 2,820 | 3,326 | 2,442 | 5,364 | 18,567 |
| 3PS | 12,816 | 15,455 | 14,948 | 7,448 | 11,578 | 62,244 |
| 4R | 15,154 | 24,827 | 19,186 | 12,628 | 6,069 | 77,865 |
| ALL | 89,311 | 92,730 | 95,600 | 74,974 | 177,059 | 529,675 |
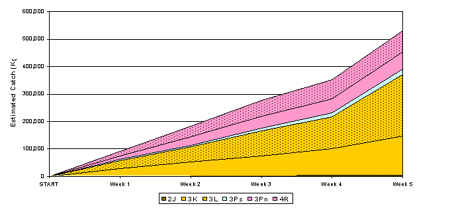
Slide 13: Monitoring of Rec. Fishery - Landings 2007
Estimated cumulative weekly catches by NAFO Division
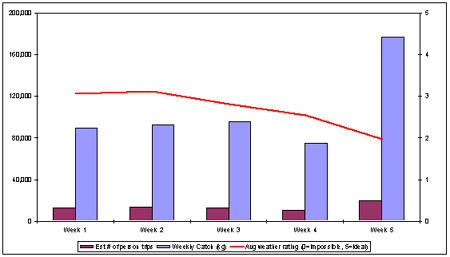
Slide 14: Monitoring of Rec. Fishery - Summary
Summary of weather conditions, number of participants, and catches – All NL
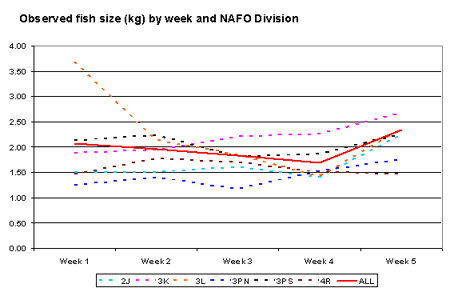
Slide 15: Monitoring of Rec. Fishery - Fish Size
Slide 16: Monitoring of Rec. Fishery - Inspection Rates
| Week 1 | Week 2 | Week 3 | Week 4 | Week 5 | Totals | |
|---|---|---|---|---|---|---|
| Est. # persons participating | 12,782 | 13,408 | 13,086 | 10,450 | 19,445 | 69,170 |
| Est. # of boat trips | 4,743 | 5,105 | 4,885 | 3,944 | 7,823 | 26,500 |
| # of persons checked | 930 | 519 | 756 | 540 | 1854 | 4,599 |
| # of boats checked | 362 | 237 | 323 | 227 | 902 | 2,051 |
| Fisher inspection rate | 7.3% | 3.9% | 5.8% | 5.2% | 9.5% | 6.6% |
| Boat inspection rate | 7.6% | 4.6% | 6.6% | 5.8% | 11.5% | 7.7% |
Slide 17: Compliance - "Occurrences"
Fishery Officers recorded a total of 648 "Occurrences" (including complaints, etc)
| Division | Commercial/ Stewardship Fishery |
Recreational Fishery |
Total |
|---|---|---|---|
| 2J | 7 | 2 | 9 |
| 3K | 60 | 7 | 67 |
| 3L | 54 | 65 | 119 |
| 3Ps | 121 | 18 | 139 |
| 3Pn | 0 | 1 | 1 |
| 4R | 298 | 15 | 313 |
| Total | 540 | 108 | 648 |
Slide 18: Compliance - Violations
There were a significant number of violations detected in both the commercial / stewardship fishery and the recreational cod fishery.
Slide 19: Compliance - Violations
| Division | Charges Laid of Pending |
Seizures - Persons Unknown |
Written Warnings |
Total | |
|---|---|---|---|---|---|
| Commercial & Stewardship | 2J 3k 3L 3PS 4R SubTotal |
- 6 3 32 44 85 |
- - 9 1 1 11 |
7 34 10 25 223 299 |
7 49 14 57 268 395 |
| Recreational Cod | 3K 3L 3PN 3PS 4R SubTotal |
6 41 2 9 9 67 |
2 14 7 7 30 |
8 55 2 16 16 97 |
|
| Grand Total | 152 | 11 | 329 | 492 |
Slide 20: Compliance - Violations
The 64 charges laid in the commercial / stewardship fishery arising from only 25 separate incidents, and were for:
- fishing during close time
- failing to tend gear, or leaving gear out after season,
- landing fish without having it monitored, and
- registration / licence.
The 56 charges in the recreational fishery arose from 28 separate incidents, and were for:
- fishing during close time and
- exceeding daily bag limits
- Illegal buy / sell.
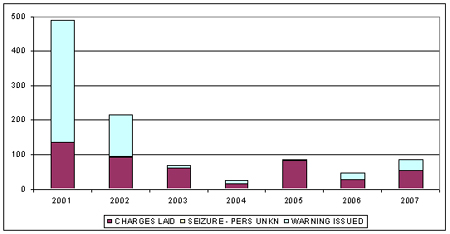
Slide 21: Compliance - Recreational Violations
Violations in recent NL recreational groundfish fisheries by year (all NL)
Slide 22: Summary - Recreational Fishery
- Well monitored with high compliance
- Relatively short time-frame manageable
- Positive response from public and enforcement personnel
- Date modified: