
Rebuilding Plan: Northern Shrimp, Pandalus borealis – Areas 8, 9, and 10
Quebec Region
- Date stocks were determined to be at or below LRP: October 27, 2023
- Date rebuilding plan was approved: October 27, 2025
On this page
- Foreword
- Introduction and context
- Stock status and trends
- 2.1 Precautionary approach
- 2.2 Stock trends
- Probable causes of stock decline
- Measurable objectives aimed at rebuilding the stock
- Management measures aimed at achieving the objectives
- Socio-economic analysis
- Method to track progress to achieve the objectives
- Periodic review of the rebuilding plan
- References
- Tab 1: Composition of the working group on the rebuilding plan for northern shrimp in the Estuary and Gulf of St. Lawrence (2024-2025)
List of figures
- Figure 1. Biomass distribution (kg/km2) of shrimp in the 2024 DFO survey
- Figure 2. Shrimp Fishing Areas in the Estuary and Gulf of St. Lawrence
- Figure 3. Shrimp landings (kt) by fishing area — Esquiman (8), Anticosti (9), Sept-Îles (10), and Estuary (12), from 2004 to 2024
- Figure 4. EGSL shrimp landings from 2001 to 2024, by region of residence, in thousands of tonnes
- Figure 5. EGSL shrimp landing prices in $/kg from 2001 to 2024
- Figure 6. Value of EGSL shrimp landings from 2001 to 2024, by fisher’s region of residence, in millions of dollars
- Figure 7. Number of enterprises that landed EGSL shrimp, by region of residence, 2001 to 2024
- Figure 8. Average revenues from EGSL shrimp for active enterprises in this fishery, by region of residence, from 2001 to 2024
- Figure 9. Number of active enterprises from Newfoundland and Labrador (Group A) participating in the EGSL shrimp fishery, by the proportion of this fishery in their total fishing revenues, from 2015 to 2024. The curve represents the percentage of active enterprises relative to the total number of enterprises
- Figure 10. Number of non-Indigenous enterprises from Quebec (Group B) participating in the EGSL shrimp fishery, by the proportion of this fishery in their total fishing revenues, from 2015 to 2024. The curve represents the percentage of active enterprises relative to the total number of enterprises
- Figure 11. Number of non-Indigenous enterprises from New Brunswick (Group B) participating in the EGSL shrimp fishery, by the proportion of this fishery in their total fishing revenues, from 2015 to 2024. The curve represents the percentage of active enterprises relative to the total number of enterprises
- Figure 12. Number of Indigenous enterprises participating in the EGSL shrimp fishery (Group B), by the proportion of this fishery in their total fishing revenues, from 2015 to 2023. The curve represents the percentage of active enterprises relative to the total number of enterprises
- Figure 13. Trajectory of the Esquiman, Anticosti and Sept-Îles, stocks based on biomass relative to the biomass at maximum sustainable yield (B/BMSY)
- Figure 14. Relative exploitation rate for the Sept-Îles, Anticosti, and Esquiman stocks
- Figure 15. Harvest control rule (HCR) showing the relative exploitation rate (F/FMSY, top) and the relative harvest projected (bottom) as a function of the stock status indicator (B/BMSY). The relative reference points are shown on the graphs as vertical lines that define the three PA zones
List of tables
- Table 1. Provincial breakdown of licences for each participant group in the EGSL shrimp fishery in 2024
- Table 2. Allocation distribution in percentage in the four fishing areas by group
- Table 3. Summary of reference points under the PA framework for shrimp in SFAs 8, 9, and 10
- Table 4. Measurable objectives and timelines for shrimp stock rebuilding
- Table 5. Summary of objectives, main management measures, and expected outcomes to achieve the rebuilding plan objectives
- Table 6. Summary of progress measures and monitoring frequency for each rebuilding plan objective
Foreword
In 2009, Fisheries and Oceans Canada (DFO) prepared the document A fishery decision-making framework incorporating the precautionary approach (PA) Policy under the auspices of the Sustainable Fisheries Framework. It outlines the departmental methodology for applying the precautionary approach (PA) to Canadian fisheries. A key component of the PA Policy requires that when a stock has declined to or below its limit reference point (LRP), a rebuilding plan must be in place with the aim of having a high probability of the stock growing above the LRP within a reasonable timeframe.
In addition, under section 6.2 of the Fish Stocks Provisions (FSP) of the amended Fisheries Act (2019), rebuilding plans must be developed and implemented for prescribed major stocks that have declined to or below their LRP. This legislated requirement is supported by section 70 of the Fishery (General) Regulations (FGR), which set out the required contents of those rebuilding plans and establish a timeline for each rebuilding plan’s development.
The purpose of this plan is to identify the main rebuilding objectives for northern shrimp for Shrimp Fishing Areas (SFAs) 8, 9, and 10, as well as the management measures that will be used to achieve these objectives. The plan also aims to promote a common understanding of the basic rules for rebuilding the stocks. These stocks are prescribed under the Fishery (General) Regulations (section 69) and thus are subject to section 6.2 of the Fisheries Act and regulatory requirements.
Although the information presented in several sections of this rebuilding plan includes the shrimp stock in the Estuary area (SFA 12), it is not subject to the same requirements as other northern shrimp stocks because it is above its LRP. This plan therefore does not apply to that stock.
The objectives and measures outlined in this plan are applicable until the stocks have reached their rebuilding targets. Once the stocks are determined to be at their targets, the stocks will be managed through the standard Integrated Fisheries Management Plan (IFMP) or another fishery management process in order to fulfill the requirements of the FSP. Management measures outlined in this rebuilding plan are mandatory and may be modified, or additional measures may be added if they fail to promote the rebuilding of the species.
This rebuilding plan is not a legally binding instrument which can form the basis of a legal challenge. The plan can be modified at any time and does not fetter the Minister’s discretionary powers set out in the Fisheries Act. The Minister can, for reasons of conservation or any other valid reasons, modify any provision of the rebuilding plan in accordance with the powers granted pursuant to the Fisheries Act.
Decisions flowing from the application of this rebuilding plan must respect the rights of Indigenous Peoples of Canada recognized and affirmed by section 35 of the Constitution Act (1982), including those through modern treaties. Where DFO is responsible for implementing a rebuilding plan in an area subject to a modern treaty, the rebuilding plan will be implemented in a manner consistent with that agreement. The plan should also be guided by the 1990 Sparrow decision of the Supreme Court of Canada, which found that the right of Indigenous groups to fish for food, social and ceremonial purposes takes precedence, subject to conservation, over any other use of the resource.
The Honourable Joanne Thompson
Minister of Fisheries
Date of approval of the rebuilding plan: October 27, 2025
1 Introduction and context
1.1 Stock distribution
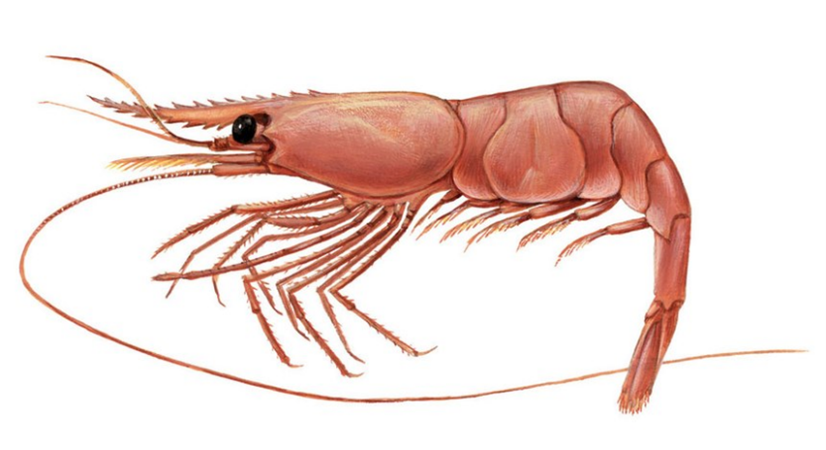
Northern shrimp (Pandalus borealis), hereafter referred to as shrimp, is a cold-water crustacean that inhabits bottoms with fine, consolidated sediments where the temperature ranges between 1°C and 6°C (DFO, 2022). Its distribution in the northwest Atlantic extends from Davis Strait in the north to the Gulf of Maine in the south, including the Estuary and Gulf of St. Lawrence (EGSL), which is near its southern limit.
Shrimp are widely distributed throughout the EGSL. They are found over more than 90,000 km2 at depths between 150 and 350 metres, below the cold intermediate layer (CIL), in the deep water layer. Although the shrimp’s area of occupancy has remained relatively stable over the last 30 years, since 2008 there has been a decrease in the surface area of high shrimp concentration areas in the EGSL. Shrimp are now mainly concentrated at the head of channels (Figure 1). EGSL shrimp form a distinct population from adjacent ones on the Scotian Shelf and Newfoundland/Labrador/Arctic regions (Bourret et al. 2024).
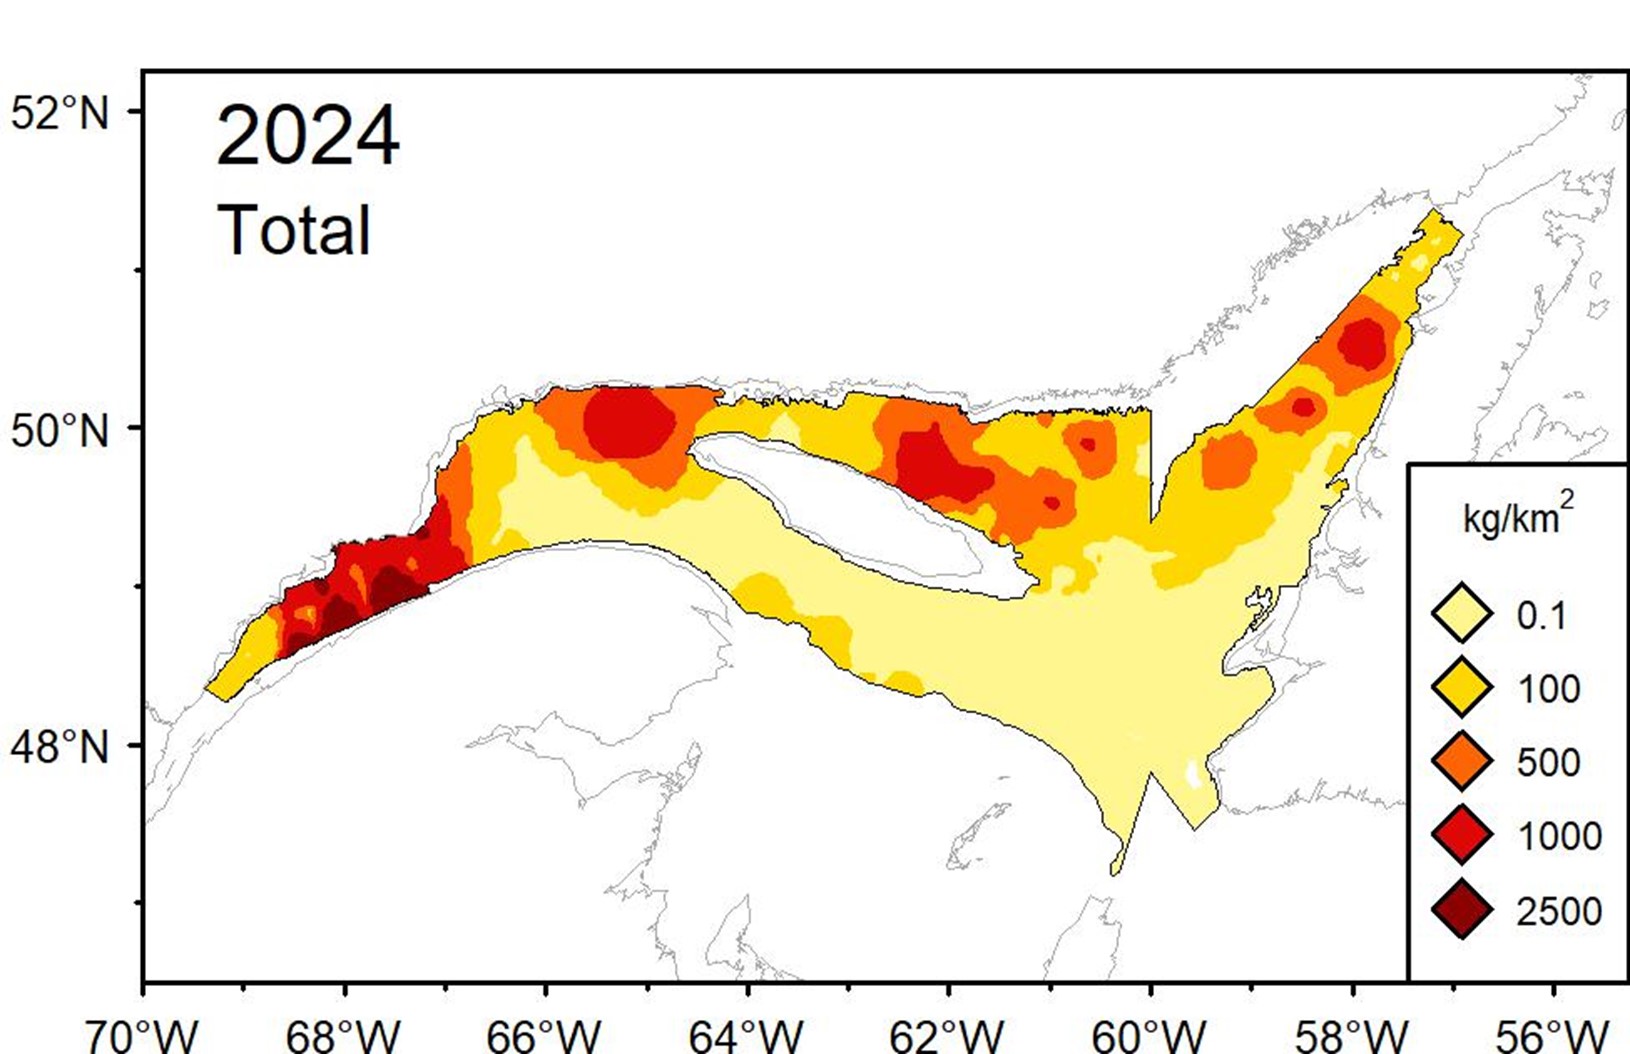
Figure 1 - Text version
This figure is a colour map showing the estimated density of shrimp (in kilograms per square kilometre) in the Estuary and Gulf of St. Lawrence (EGSL) for the year 2024, based on data from the DFO research survey.
The map spans west to east from approximately 70 degrees west longitude (upper estuary area) to about 56 degrees west longitude (off Newfoundland), and south to north between 48 and 52 degrees north latitude. It includes the:
- Laurentian Channel and its extensions
- lower estuary
- Gaspé Peninsula
- Lower North Shore
- areas around Anticosti Island
- Strait of Belle Isle
The legend shows five shrimp density classes, colour-coded as follows:
- very pale yellow for 0.1 kg/km2 (very low density)
- yellow for 100 kg/km2
- orange for 500 kg/km2
- red for 1,000 kg/km2
- dark red for 2,500 kg/km2 (very high density)
Shrimp are present across most of the EGSL seabed at depths of 150 to 350 metres, primarily below the Cold Intermediate Layer (CIL), in the bottom layer. Most areas show low to moderate densities (pale yellow to orange), indicating a diffuse presence.
High-density zones (red and dark red) are limited and concentrated at the heads of deep channels, specifically: west of the Laurentian Channel in the Estuary, in the Sept-Îles Basin, north and east of Anticosti Island, and north of the Esquiman Channel near the Strait of Belle Isle.
1.2 Biology and ecosystem factors affecting the stocks
Shrimp are protandric hermaphrodites, meaning they change sex during their life cycle. They start life as males and become female around the age of 4 or 5 years. Since females are larger in size, they are primarily targeted by the commercial fishery. Males begin reproducing in the fall at about 2 or 3 years of age. Females lay eggs in early fall and carry them attached to their abdomen until the following spring, a period of approximately eight months. The larvae hatch in spring during the phytoplankton bloom and are pelagic. By the end of summer, they metamorphose and settle on the seafloor. Females participate in the reproductive cycle for 2 or 3 years.
Shrimp migrate to shallower waters during winter. At night, they leave the bottom to feed on small planktonic organisms.
Shrimp are a key forage species in the EGSL. They play an important role in transferring energy from lower trophic levels to higher levels because they feed on phytoplankton and zooplankton, and are consumed by predators such as redfish (Sebastes spp.), Greenland halibut (Reinhardtius hippoglossoides), and Atlantic cod (Gadus morhua) (Bourdages et al. 2018).
The population dynamics of shrimp—and more specifically their abundance, distribution, growth, reproduction, and trophic relationships—are strongly influenced by water temperature. The EGSL is a dynamic environment affected by changing environmental and ecosystem conditions due to climate change. Since 2009, deep-water temperatures have increased under the stronger influence of the Gulf Stream, which counteracts the cold water from the Labrador Current, also causing a decrease in oxygen concentration. Additional details are available in the section “Probable causes of stock decline.”
1.3 Overview of the commercial shrimp fishery
The directed commercial shrimp fishery in the EGSL is conducted by inshore fleets (less than 65 feet) and midshore fleets (65 to 100 feet) using mobile gear from the provinces of Quebec, New Brunswick, Newfoundland and Labrador, as well as Prince Edward Island and Nova Scotia. The fishery is carried out using bottom trawls. In the EGSL, four Shrimp Fishing Areas (SFAs) have been defined since 1993: Estuary (SFA 12), Sept-Îles (SFA 10), Anticosti (SFA 9), and Esquiman (SFA 8) (Figure 2). Fishing primarily occurs in areas along the Laurentian Channel, as well as in the Anticosti and Esquiman Channels, at depths ranging from 200 to 300 metres. Since 2018, a significant shift of shrimp from deeper to shallower waters has been observed in some areas in response to environmental changes. This is particularly the case in the Sept-Îles and Anticosti areas, where shrimp appear to have abandoned depths greater than 275 metres.
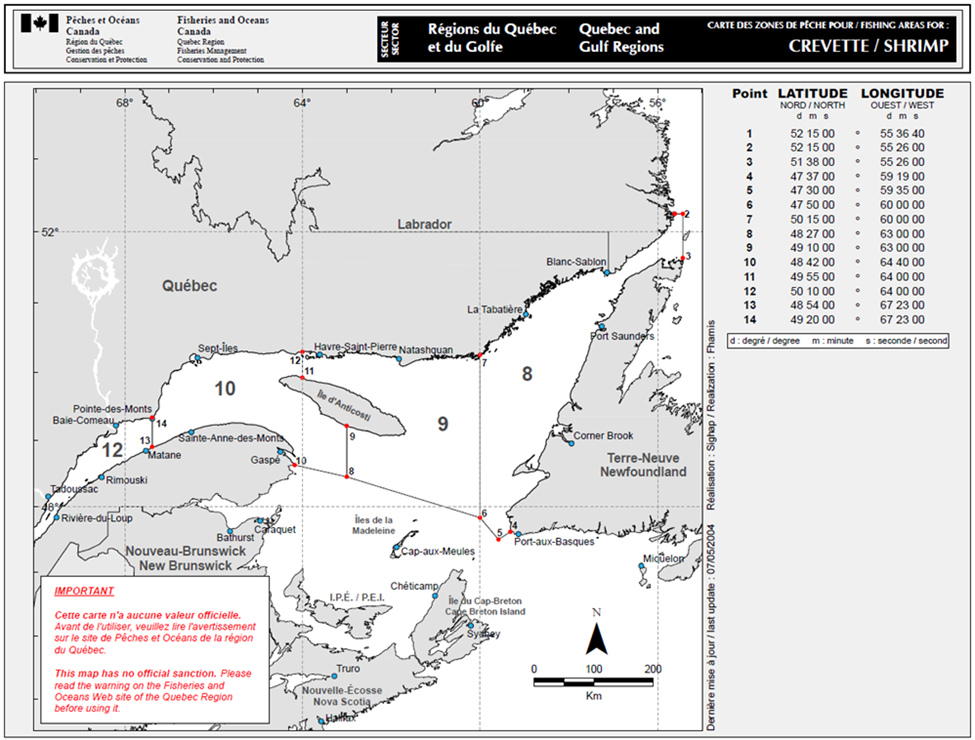
Figure 2 - Text version
Figure 2 is a geographic map representing the Gulf of St. Lawrence region, located in eastern Canada. The map is structured around four management areas: Estuary (12), Sept-Îles (10), Anticosti (9), and Esquiman (8). Black lines indicate the boundaries between the management areas.
The Estuary area, located at the far west of the map, covers the mouth of the St. Lawrence River and is defined as west of Pointe-des-Monts on the North Shore and Matane on the south shore.
The Sept-Îles area is bounded to the west by the longitude of Pointe-des-Monts and to the east along the North Shore by the Jacques-Cartier Strait, northwest of Anticosti Island (a shallow area). The area also includes the Laurentian Channel south of Anticosti Island up to the boundary connecting the south-central part of Anticosti Island and the junction of NAFO divisions 4RST in the centre of the Laurentian Channel.
The Anticosti area corresponds to the Anticosti Channel, located north of Anticosti Island. It lies between Sept-Îles to the west, Anticosti Island to the south, and Esquiman to the east.
The Esquiman area corresponds to NAFO Division 4R and the northeastern part of Division 4S, east of the 60th meridian.
Since 1982, a total allowable catch (TAC) for each SFA has been established annually based on scientific advice and socio-economic considerations. The TAC is allocated according to a fixed established sharing formula (see the “Allocation and Governance” section). The fishery operates under individual quota (IQ) regime in Newfoundland and Labrador, Prince Edward Island and Nova Scotia and under individual transferable quotas (ITQ) regime in Quebec and New Brunswick. The fishing season runs from April 1 to December 31 each year.
Commercial fishing management and monitoring measures comply with the Integrated Fisheries Management Plan (IFMP), which was revised in 2018. The measures set out in this rebuilding plan take precedence over any conflicting measures affecting the Sept-Îles (ZPC 10), Anticosti (ZPC 9), and Esquiman (ZPC 8) shrimp stocks. Guided by the IFMP and the rebuilding plan, the general and fleet-specific management measures for the commercial shrimp fishery are outlined in the Conservation Harvesting Plan (CHP) and licence conditions.
1.3.1 Other sources of removals
No other type of shrimp fishing is authorized in the EGSL, except for scientific surveys conducted by the department. Shrimp are not caught as bycatch in other directed fisheries.
1.4 Allocation and governance
Shrimp fishing in the EGSL is a limited access fishery. In 2024, there were 103 shrimp fishing licences granting access to areas 8, 9, 10, and/or 12 (see Table 1 for additional details). The participants in this fishery are divided into three groups:
- Group A
- Group B
- Fishers’ groups from Prince Edward Island and Nova Scotia
Table 1. Provincial breakdown of licences for each participant group in the EGSL shrimp fishery in 2024
- Group A
- Quebec: 4
- Newfoundland and Labrador: 34
- Group B
- Quebec: 40, including 6 licences issued to First Nations
- New Brunswick: 22, including 2 licences issued to First Nations
- Fisher groups from Prince Edward Island and Nova Scotia
- Prince Edward Island : 2
- Nova Scotia : 1
- Total number of licences: 103
The TACs for the four SFAs are distributed according to a sharing formula in effect since 2010 (see Table 2 for additional details).
Table 2. Allocation distribution in percentage in the four fishing areas by group
- Prince Edward Island
- Estuary: 0 %
- Sept-Îles: 1.18 %
- Anticosti: 1.18 %
- Esquiman: 1.18 %
- Nova Scotia
- Estuary: 0 %
- Sept-Îles: 1.18 %
- Anticosti: 1.18 %
- Esquiman: 1.18 %
- Group A
- Estuary: 0 %
- Sept-Îles: 0 %
- Anticosti: 0 %
- Esquiman: 73.2 %
- Group B
- Estuary: 100 %
- Sept-Îles: 97.6 %
- Anticosti: 97.6 %
- Esquiman: 24.4 %
The Estuary and Gulf of St. Lawrence Shrimp Advisory Committee (EGSAC) is the main consultation body for the shrimp fishery. The committee is composed of representatives of harvesters’ associations, First Nations, processors, provincial governments, and DFO. Coordination of the EGSAC consultation is carried out by Fisheries Management Quebec Region, in collaboration with the two other DFO administrative regions involved in the fishery, namely the Newfoundland and Labrador Region and the Gulf Region, which consists of New Brunswick, Prince Edward Island, and part of Nova Scotia.
1.5 History of the fishery
Shrimp fishing in the EGSL was developed in the 1960s, primarily by midshore groundfish fishers who chose to diversify their fishing operations. Commercial exploitation began in 1965 off Sept-Îles with landings of around 10 tonnes. In the 1970s, the commercial shrimp fishery expanded within EGSL as well as along the Labrador coast. The rapid increase in shrimp landings, combined with declines in cod and redfish stocks and low prices for these species, contributed to strong demand for shrimp fishing licences.
In 1980, the Gulf Shrimp Advisory Committee (now the Estuary and Gulf Shrimp Advisory Committee) was created, and management measures were progressively implemented to protect the resource and control the development of the fishery (limits on the number of licences, imposition of an annual TAC and a fishing season, etc.). Monitoring programs were also established in the 1980s and 1990s to allow annual tracking of the fishery and the status of shrimp populations in the EGSL (DFO, 2016).
By the mid-1980s, two groups of fishers were defined: Group A, composed of fishers from western Newfoundland and Labrador and the North Shore of Quebec, and Group B, composed of fishers from Quebec and New Brunswick. Sharing agreements and individual quota programs were implemented for Group B in 1991 and then for Group A in 1996.
Over time, the expansion of the fishery, advances in detection techniques, increased fishing vessel power, and refinements in population assessment methods led stakeholders to seek, among other things, a redefinition of the framework for optimal and sustainable resource use. Starting in 1993, a mid-term management strategy was adopted, and several management measures were modified or reinforced. The use of the Nordmøre grate, aimed at reducing groundfish bycatch, was made mandatory starting in 1993. Management areas were reduced from five to four to better match shrimp aggregations observed in research surveys with sectors used by harvesters. Starting in 1997, following increases in TACs and expansion of the fishery, temporary shrimp allocations through new accesses were granted to groundfish dependent fishers from Quebec, New Brunswick, and to groups of fishers from Prince Edward Island and Nova Scotia who did not hold regular shrimp fishing licences.
In 2000, following the Marshall decision, an initiative was launched to negotiate provisional fishing agreements providing First Nations with increased and immediate access to the commercial fishery. That same year, following the purchase of 6 licences in Quebec, the Gesgapegiag, Gespeg, Listuguj, and Wolastoqiyik Wahsipekuk First Nations gained access to shrimp fishing in the EGSL. In New Brunswick, the Eel River Bar and Metepenagiag First Nations obtained access in 2004 following the purchase of two licences in that province. Finally, the Innu Takuaikan Uashat Mak Mani-Utenam community acquired its first licence in 2003 and a second in 2008. Thus, five First Nations from Quebec and two from New Brunswick have since participated in shrimp fishing in the EGSL under licences issued pursuant to the Aboriginal Communal Fishing Licences Regulations.
Until the late 1990s, the 4 shrimp stocks exhibited similar trends and annual TAC variations were synchronized across fishing areas. Starting in the early 2000s, local differences between stocks were observed, suggesting that stock resilience to fishing pressure could vary. Thus since 2003, the TACs for the four EGSL areas have not been synchronized, which has affected the sharing of the overall shrimp allocation for Group B. In 2005, to partially reconcile the gap between the historical sharing of the overall EGSL shrimp allocation granted to Group B fishers in each province (Quebec and New Brunswick) and the effective sharing, an adjustment mechanism was implemented between Group B fleets. Since 2010, a stable sharing formula has been in place between the traditional fleet and the groundfish-dependent harvesters.
Starting in the early 2010s, shrimp biomass and TACs began to decline for the first time. In 2012, a precautionary approach, including reference points and harvest control rules, was adopted and used to set the TACs. In 2017, the Estuary and Sept-Îles stocks were in the cautious zone, while the Anticosti and Esquiman stocks were at the lower end of the healthy zone. In 2018, TACs for the Estuary and Sept-Îles areas were significantly reduced (by 75% and 60%, respectively), while TACs for the other two stocks decreased by 15%, bringing the overall EGSL shrimp TAC to less than 20,000 tonnes for the first time in over 20 years.
In response to the difficult situation facing the EGSL shrimp fishery, in 2019 DFO established a subcommittee under the EGSL Shrimp Advisory Committee, composed of stakeholders from the harvesting sector and DFO Fisheries Management. This subcommittee was tasked with initiating a reflection on the challenges facing the shrimp fishery industry in the EGSL, considering long term perspectives, and identifying possible solutions. Industry participants identified three main solutions: reduce the price of licences, reduce or eliminate quotas reserved for fish harvester associations, and increasing access to redfish. They also requested that DFO review harvest control rules and the entire precautionary approach to better integrate ecosystem factors.
In 2022, a cautious approach to setting TACs using the existing precautionary approach was proposed and implemented over a two-year period to account for increased risk due to ecosystem changes (Bourdages et al. 2022). In 2023, the assessment units for the Sept-Îles and Anticosti areas were slightly modified (Figure 2) to better align them with the biological units (Bourdages et al. 2023). Following the review of assessment units and the adoption of a new stock assessment model in 2023, new reference points and harvest control rules were proposed. TACs for the Sept-Îles, Anticosti, and Esquiman areas decreased significantly (by more than 80 %) to around 2,500 tonnes, the lowest historical level for these three areas. The steep TAC reductions combined with rising operating costs have significantly impacted the viability of the shrimp fleets in the EGSL.
On August 10, 2024, the Marine Stewardship Council (MSC) certification of the EGSL shrimp fishery was suspended due to the critical status of three of the four shrimp stocks. This fishery had been certified since March 31, 2009 (MSC, 2024).
Additional information on the history of the fishery is available in the Integrated Fisheries Management Plan (IFMP).
1.6 Socio-economic profile
Between 2004 and 2022, more than 97% of the shrimp landings in the EGSL came from Areas 8 (Esquiman), 9 (Anticosti), and 10 (Sept-Îles). On average during this period, only 2.9% of landings came from the Estuary Area (SFA 12). Shrimp landings in the EGSL began to decline starting in the 2010s, with this decrease accelerating in 2017 and again in 2023. However, the decline was not uniform across the four fishing areas.
The Sept-Îles Area, historically the most productive for shrimp catches, experienced the sharpest decline of 98% between 2010 and 2024, dropping from 15,777 tonnes to 160 tonnes. This was followed by the Anticosti and Esquiman Areas, with decreases of 95% and 90%, respectively, over the same period. The Estuary Area also saw a decline starting in 2010 (down 65%), but to a lesser extent than the other areas (Figure 3).
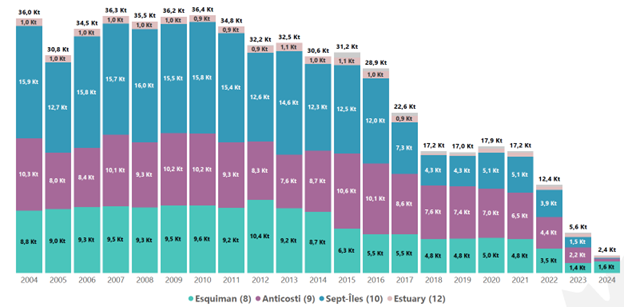
Figure 3 - Text version
- Year: 2004
- Esquiman landings: 8.8 kt
- Anticosti landings: 10.3 kt
- Sept-Îles landings: 15.9 kt
- Estuary landings: 1.0 kt
- Total landings: 36.0 kt
- Year: 2005
- Esquiman landings: 9.0 kt
- Anticosti landings: 8.0 kt
- Sept-Îles landings: 12.7 kt
- Estuary landings: 1.0 kt
- Total landings: 30.8 kt
- Year: 2006
- Esquiman landings: 9.3 kt
- Anticosti landings: 8.4 kt
- Sept-Îles landings: 15.8 kt
- Estuary landings: 1.0 kt
- Total landings: 34.5 kt
- Year: 2007
- Esquiman landings: 9.5 kt
- Anticosti landings: 10.1 kt
- Sept-Îles landings: 15.7 kt
- Estuary landings: 1.0 kt
- Total landings: 36.3 kt
- Year: 2008
- Esquiman landings: 9.3 kt
- Anticosti landings: 9.3 kt
- Sept-Îles landings: 16.0 kt
- Estuary landings: 1.0 kt
- Total landings: 35.5 kt
- Year: 2009
- Esquiman landings: 9.5 kt
- Anticosti landings: 10.2 kt
- Sept-Îles landings: 15.5 kt
- Estuary landings: 1.0 kt
- Total landings: 36.2 kt
- Year: 2010
- Esquiman landings: 9.6 kt
- Anticosti landings: 10.2 kt
- Sept-Îles landings: 15.8 kt
- Estuary landings: 0.9 kt
- Total landings: 36.4 kt
- Year: 2011
- Esquiman landings: 9.2 kt
- Anticosti landings: 9.3 kt
- Sept-Îles landings: 15.4 kt
- Estuary landings: 0.9 kt
- Total landings: 34.8 kt
- Year: 2012
- Esquiman landings: 10.4 kt
- Anticosti landings: 8.3 kt
- Sept-Îles landings: 12.6 kt
- Estuary landings: 0.9 kt
- Total landings: 32.2 kt
- Year: 2013
- Esquiman landings: 9.2 kt
- Anticosti landings: 7.6 kt
- Sept-Îles landings: 14.6 kt
- Estuary landings: 1.1 kt
- Total landings: 32.5 kt
- Year: 2014
- Esquiman landings: 8.7 kt
- Anticosti landings: 8.7 kt
- Sept-Îles landings: 12.3 kt
- Estuary landings: 1.0 kt
- Total landings: 30.6 kt
- Year: 2015
- Esquiman landings: 8.2 kt
- Anticosti landings: 9.4 kt
- Sept-Îles landings: 12.5 kt
- Estuary landings: 1.1 kt
- Total landings: 31.2 kt
- Year: 2016
- Esquiman landings: 7.0 kt
- Anticosti landings: 9.1 kt
- Sept-Îles landings: 11.8 kt
- Estuary landings: 1.0 kt
- Total landings: 28.9 kt
- Year: 2017
- Esquiman landings: 7.0 kt
- Anticosti landings: 7.5 kt
- Sept-Îles landings: 7.2 kt
- Estuary landings: 0.9 kt
- Total landings: 22.6 kt
- Year: 2018
- Esquiman landings: 6.0 kt
- Anticosti landings: 6.8 kt
- Sept-Îles landings: 4.2 kt
- Estuary landings: 0.2 kt
- Total landings: 17.2 kt
- Year: 2019
- Esquiman landings: 6.0 kt
- Anticosti landings: 6.9 kt
- Sept-Îles landings: 4.0 kt
- Estuary landings: 0.1 kt
- Total landings: 17.0 kt
- Year: 2020
- Esquiman landings: 6.0 kt
- Anticosti landings: 6.3 kt
- Sept-Îles landings: 5.0 kt
- Estuary landings: 0.6 kt
- Total landings: 17.9 kt
- Year: 2021
- Esquiman landings: 5.6 kt
- Anticosti landings: 6.1 kt
- Sept-Îles landings: 4.9 kt
- Estuary landings: 0.6 kt
- Total landings: 17.2 kt
- Year: 2022
- Esquiman landings: 4.3 kt
- Anticosti landings: 3.8 kt
- Sept-Îles landings: 3.9 kt
- Estuary landings: 0.4 kt
- Total landings: 12.4 kt
- Year: 2023
- Esquiman landings: 1.7 kt
- Anticosti landings: 2.0 kt
- Sept-Îles landings: 1.5 kt
- Estuary landings: 0.4 kt
- Total landings: 5.6 kt
- Year: 2024
- Esquiman landings: 1.6 kt
- Anticosti landings: 0.4 kt
- Sept-Îles landings: 0.2 kt
- Estuary landings: 0.2 kt
- Total landings: 2.4 kt
During the period from 2001 to 2024, 58 % of landings were made by enterprises from Quebec, 23 % by enterprises from the Gulf Region (mainly from New Brunswick), and 19 % by enterprises from Newfoundland and Labrador. It is worth noting that enterprises from Newfoundland and Labrador are active exclusively in the Esquiman Area (Area 8), while enterprises from Quebec have exclusive access to the Estuary Area (Area 12) (Figure 4).
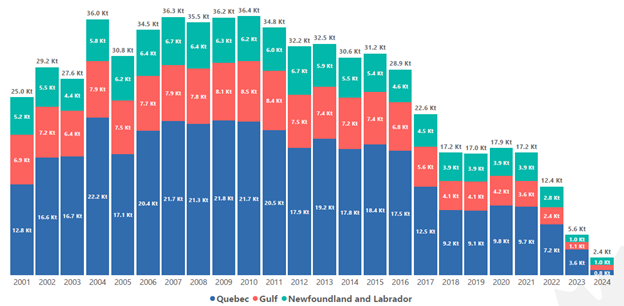
Figure 4 - Text version
- Year : 2001
- Québec landings : 12.8 Kt
- Gulf landings : 6.9 Kt
- Newfoundland and Labrador landings : 5.2 Kt
- Total landings : 25.0 Kt
- Year : 2002
- Québec landings : 16.6 Kt
- Gulf landings : 7.2 Kt
- Newfoundland and Labrador landings : 5.5 Kt
- Total landings : 29.2 Kt
- Year : 2003
- Québec landings : 16.7 Kt
- Gulf landings : 6.4 Kt
- Newfoundland and Labrador landings : 4.4 Kt
- Total landings : 27.6 Kt
- Year : 2004
- Québec landings : 22.2 Kt
- Gulf landings : 7.9 Kt
- Newfoundland and Labrador landings : 5.8 Kt
- Total landings : 36.0 Kt
- Year : 2005
- Quebec landings : 17.1 Kt
- Gulf landings : 7.5 Kt
- Newfoundland and Labrador landings : 6.2 Kt
- Total landings : 30.8 Kt
- Year : 2006
- Quebec landings : 20.4 Kt
- Gulf landings : 7.7 Kt
- Newfoundland and Labrador landings : 6.4 Kt
- Total landings : 34.5 Kt
- Year : 2007
- Quebec landings : 21.7 Kt
- Gulf landings : 7.9 Kt
- Newfoundland and Labrador landings : 6.7 Kt
- Total landings : 36.3 Kt
- Year : 2008
- Quebec landings : 21.3 Kt
- Gulf landings : 7.8 Kt
- Newfoundland and Labrador landings : 6.4 Kt
- Total landings : 35.5 Kt
- Year : 2009
- Quebec landings : 21.8 Kt
- Gulf landings : 8.1 Kt
- Newfoundland and Labrador landings : 6.3 Kt
- Total landings : 36.2 Kt
- Year : 2010
- Quebec landings : 21.7 Kt
- Gulf landings : 8.5 Kt
- Newfoundland and Labrador landings : 6.2 Kt
- Total landings : 36.4 Kt
- Year : 2011
- Quebec landings : 20.5 Kt
- Gulf landings : 8.4 Kt
- Newfoundland and Labrador landings : 6.0 Kt
- Total landings : 34.8 Kt
- Year : 2012
- Quebec landings : 17.9 Kt
- Gulf landings : 7.5 Kt
- Newfoundland and Labrador landings : 6.7 Kt
- Total landings : 32.2 Kt
- Year : 2013
- Quebec landings : 19.2 Kt
- Gulf landings : 7.4 Kt
- Newfoundland and Labrador landings : 5.9 Kt
- Total landings : 32.5 Kt
- Year : 2014
- Quebec landings : 17.8 Kt
- Gulf landings : 7.2 Kt
- Newfoundland and Labrador landings : 5.5 Kt
- Total landings : 30.6 Kt
- Year : 2015
- Quebec landings : 18.4 Kt
- Gulf landings : 7.4 Kt
- Newfoundland and Labrador landings : 5.4 Kt
- Total landings : 31.2 Kt
- Year : 2016
- Quebec landings : 17.5 Kt
- Gulf landings : 6.8 Kt
- Newfoundland and Labrador landings : 4.6 Kt
- Total landings : 28.9 Kt
- Year : 2017
- Quebec landings : 12.5 Kt
- Gulf landings : 5.6 Kt
- Newfoundland and Labrador landings : 4.5 Kt
- Total landings : 22.6 Kt
- Year : 2018
- Quebec landings : 9.2 Kt
- Gulf landings : 4.1 Kt
- Newfoundland and Labrador landings : 3.9 Kt
- Total landings : 17.2 Kt
- Year : 2019
- Quebec landings : 9.1 Kt
- Gulf landings : 4.1 Kt
- Newfoundland and Labrador landings : 3.9 Kt
- Total landings : 17.0 Kt
- Year : 2020
- Quebec landings : 9.8 Kt
- Gulf landings : 4.2 Kt
- Newfoundland and Labrador landings : 3.9 Kt
- Total landings : 17.9 Kt
- Year : 2021
- Quebec landings : 9.7 Kt
- Gulf landings : 3.6 Kt
- Newfoundland and Labrador landings : 3.9 Kt
- Total landings : 17.2 Kt
- Year : 2022
- Quebec landings : 7.2 Kt
- Gulf landings : 2.4 Kt
- Newfoundland and Labrador landings : 2.8 Kt
- Total landings : 12.4 Kt
- Year : 2023
- Quebec landings : 3.6 Kt
- Gulf landings : 1.1 Kt
- Newfoundland and Labrador landings : 1.0 Kt
- Total landings : 5.6 Kt
- Year : 2024
- Quebec landings : 0.8 Kt
- Gulf landings : 0.6 Kt
- Newfoundland and Labrador landings : 1.0 Kt
- Total landings : 2.4 Kt
From 2001 to 2010, shrimp landing prices were relatively low (Figure 5). This coincided with an increase in shrimp catches observed in Canada (northern shrimp stocks and EGSL shrimp) and elsewhere in the world during that period. Starting in 2010, as global shrimp catches began to decline, prices started to rise sharply: from $1.02/kg in 2009 to $3.03/kg in 2015, a 196 % increase. Over the following nine years, from 2016 to 2024, prices experienced many fluctuations but remained significantly higher than in previous years. A record price was reached in 2019 ($3.55/kg), followed by a sharp 34 % drop in 2020, the first year of the COVID-19 pandemic, when prices fell to $2.35/kg. Since then, prices have risen by 37 %, reaching $3.23/kg in 2024.
Over the full period from 2001 to 2024, prices increased from $1.25/kg to $3.23/kg, representing a 158 % rise. However, when expressed in constant dollars to account for inflation, the increase was limited to 57.2 % over the same period.
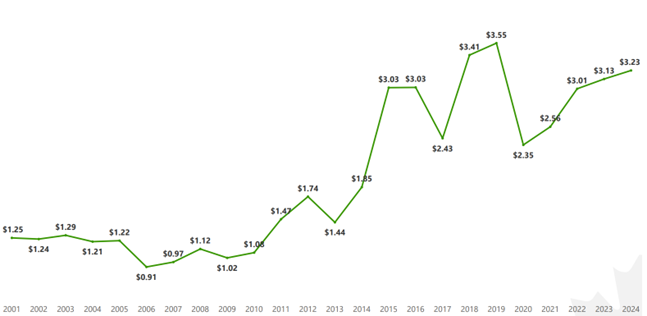
Figure 5 - Text version
- 2001: $1.25/kg
- 2002: $1.24/kg
- 2003: $1.29/kg
- 2004: $1.21/kg
- 2005: $1.22/kg
- 2006: $0.91/kg
- 2007: $0.97/kg
- 2008: $1.12/kg
- 2009: $1.02/kg
- 2010: $1.08/kg
- 2011: $1.47/kg
- 2012: $1.74/kg
- 2013: $1.44/kg
- 2014: $1.85/kg
- 2015: $3.03/kg
- 2016: $3.03/kg
- 2017: $2.43/kg
- 2018: $3.41/kg
- 2019: $3.55/kg
- 2020: $2.35/kg
- 2021: $2.56/kg
- 2022: $3.01/kg
- 2023: $3.13/kg
- 2024: $3.23/kg
The value of landings behaved differently from the quantities landed due to the high variability in prices. The value peaked at $94.3 million in 2015, when landing prices reached unprecedented levels ($3.03/kg) and quantities landed remained relatively high (31,200 tonnes). From 2017 to 2022, while landed quantities were at historically low levels, their value remained relatively high due to elevated prices. However, even the very high prices recorded in 2023 and 2024 were not enough to offset the extremely low quantities landed. Like the landed quantities, the value of EGSL shrimp landings in 2023 and 2024 was very low, at $17.6 million and $7.8 million, respectively (Figure 6).
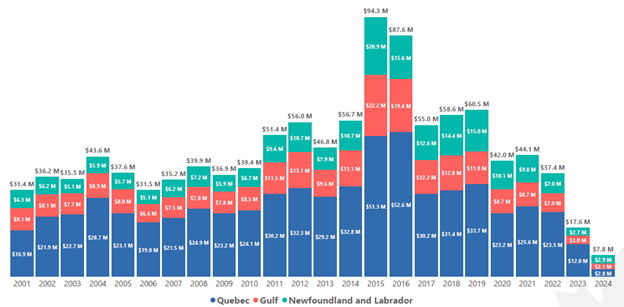
Figure 6 - Text version
- Year: 2001
- Quebec: $16.9M
- Gulf: $8.1M
- Newfoundland and Labrador: $6.3M
- Total: $31.4M
- Year: 2002
- Quebec: $21.9M
- Gulf: $8.1M
- Newfoundland and Labrador: $6.2M
- Total: $36.2M
- Year: 2003
- Quebec: $22.7M
- Gulf: $7.7M
- Newfoundland and Labrador: $5.1M
- Total: $35.5M
- Year: 2004
- Quebec: $28.7M
- Gulf: $8.9M
- Newfoundland and Labrador: $5.9M
- Total: $43.6M
- Year: 2005
- Quebec: $23.1M
- Gulf: $8.8M
- Newfoundland and Labrador: $5.7M
- Total: $37.6M
- Year: 2006
- Quebec: $19.8M
- Gulf: $6.6M
- Newfoundland and Labrador: $5.1M
- Total: $31.5M
- Year: 2007
- Quebec: $21.5M
- Gulf: $7.5M
- Newfoundland and Labrador: $6.2M
- Total: $35.2M
- Year: 2008
- Quebec: $24.9M
- Gulf: $7.8M
- Newfoundland and Labrador: $7.2M
- Total: $39.9M
- Year: 2009
- Quebec: $23.2M
- Gulf: $7.8M
- Newfoundland and Labrador: $5.9M
- Total: $36.9M
- Year: 2010
- Quebec: $24.1M
- Gulf: $8.3M
- Newfoundland and Labrador: $6.7M
- Total: $39.4M
- Year: 2011
- Quebec: $30.2M
- Gulf: $11.5M
- Newfoundland and Labrador: $9.6M
- Total: $51.4M
- Year: 2012
- Quebec: $32.3M
- Gulf: $13.1M
- Newfoundland and Labrador: $10.7M
- Total: $56.0M
- Year: 2013
- Quebec: $29.2M
- Gulf: $9.6M
- Newfoundland and Labrador: $7.9M
- Total: $46.8M
- Year: 2014
- Quebec: $32.8M
- Gulf: $13.1M
- Newfoundland and Labrador: $10.7M
- Total: $56.7M
- Year: 2015
- Quebec: $51.3M
- Gulf: $22.2M
- Newfoundland and Labrador: $20.9M
- Total: $94.3M
- Year: 2016
- Quebec: $52.6M
- Gulf: $19.4M
- Newfoundland and Labrador: $15.6M
- Total: $87.6M
- Year: 2017
- Quebec: $30.2M
- Gulf: $12.2M
- Newfoundland and Labrador: $12.6M
- Total: $55.0M
- Year: 2018
- Quebec: $31.4M
- Gulf: $12.8M
- Newfoundland and Labrador: $14.4M
- Total: $58.6M
- Year: 2019
- Quebec: $33.7M
- Gulf: $11.8M
- Newfoundland and Labrador: $15.0M
- Total: $60.5M
- Year: 2020
- Quebec: $23.2M
- Gulf: $8.7M
- Newfoundland and Labrador: $10.1M
- Total: $42.0M
- Year: 2021
- Quebec: $25.6M
- Gulf: $8.7M
- Newfoundland and Labrador: $9.8M
- Total: $44.1M
- Year: 2022
- Quebec: $23.5M
- Gulf: $7.0M
- Newfoundland and Labrador: $7.0M
- Total: $37.4M
- Year: 2023
- Quebec: $12.0M
- Gulf: $3.0M
- Newfoundland and Labrador: $2.7M
- Total: $17.6M
- Year: 2024
- Quebec: $2.9M
- Gulf: $2.0M
- Newfoundland and Labrador: $2.9M
- Total: $7.8M
The total number of active enterprises in the EGSL shrimp fishery increased from 135 to 149 between 2001 and 2007. This growth is partly explained by the integration of new harvesters following the collapse of groundfish stocks a few years earlier. Additionally, it is worth noting that in the early 2000s, following the Marshall decision, seven Indigenous communities in Quebec and the Gulf region joined the shrimp fishery through DFO licence buyback programs. Due in part to a consolidation process enabled by individual transferable quotas, the number of active enterprises gradually declined starting in 2008, reaching 102 in 2021, a 32 % decrease compared with 2007 (Figure 7). Since 2023, the number of active enterprises has been decreasing in all regions due to the low profitability of operations. In 2024, the number of active enterprises stood at 53, the lowest recorded in the past two decades.
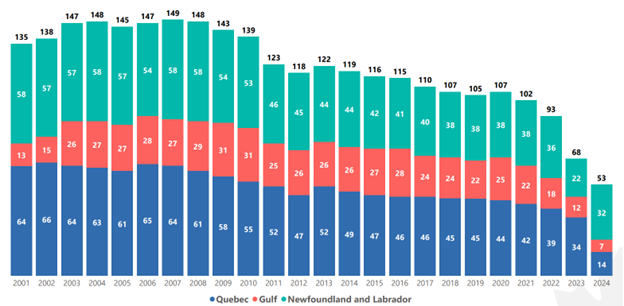
Figure 7 - Text version
- Year: 2001
- Quebec: 64
- Gulf: 13
- Newfoundland and Labrador: 58
- Total: 135
- Year: 2002
- Quebec: 66
- Gulf: 15
- Newfoundland and Labrador: 57
- Total: 138
- Year: 2003
- Quebec: 64
- Gulf: 26
- Newfoundland and Labrador: 57
- Total: 147
- Year: 2004
- Quebec: 63
- Gulf: 27
- Newfoundland and Labrador: 58
- Total: 148
- Year: 2005
- Quebec: 61
- Gulf: 27
- Newfoundland and Labrador: 57
- Total: 145
- Year: 2006
- Quebec: 65
- Gulf: 28
- Newfoundland and Labrador: 54
- Total: 147
- Year: 2007
- Quebec: 64
- Gulf: 27
- Newfoundland and Labrador: 58
- Total: 149
- Year: 2008
- Quebec: 61
- Gulf: 29
- Newfoundland and Labrador: 58
- Total: 148
- Year: 2009
- Quebec: 58
- Gulf: 31
- Newfoundland and Labrador: 54
- Total: 143
- Year: 2010
- Quebec: 55
- Gulf: 31
- Newfoundland and Labrador: 53
- Total: 139
- Year: 2011
- Quebec: 52
- Gulf: 25
- Newfoundland and Labrador: 46
- Total: 123
- Year: 2012
- Quebec: 47
- Gulf: 26
- Newfoundland and Labrador: 45
- Total: 118
- Year: 2013
- Quebec: 52
- Gulf: 26
- Newfoundland and Labrador: 44
- Total: 122
- Year: 2014
- Quebec: 49
- Gulf: 26
- Newfoundland and Labrador: 44
- Total: 119
- Year: 2015
- Quebec: 47
- Gulf: 27
- Newfoundland and Labrador: 42
- Total: 116
- Year: 2016
- Quebec: 46
- Gulf: 28
- Newfoundland and Labrador: 41
- Total: 115
- Year: 2017
- Quebec: 46
- Gulf: 24
- Newfoundland and Labrador: 40
- Total: 110
- Year: 2018
- Quebec: 45
- Gulf: 24
- Newfoundland and Labrador: 38
- Total: 107
- Year: 2019
- Quebec: 45
- Gulf: 21
- Newfoundland and Labrador: 38
- Total: 104
- Year: 2020
- Quebec: 44
- Gulf: 24
- Newfoundland and Labrador: 38
- Total: 106
- Year: 2021
- Quebec: 42
- Gulf: 22
- Newfoundland and Labrador: 38
- Total: 102
- Year: 2022
- Quebec: 39
- Gulf: 17
- Newfoundland and Labrador: 36
- Total: 92
- Year: 2023
- Quebec: 34
- Gulf: 12
- Newfoundland and Labrador: 22
- Total: 68
- Year: 2024
- Quebec: 14
- Gulf: 7
- Newfoundland and Labrador: 32
- Total: 53
Although between 2001 and 2022 the number of active enterprises in Newfoundland and Labrador was nearly as high as in Quebec, the total value of their landings was significantly lower (Figure 6). As a result, the average income of active enterprises in Newfoundland and Labrador is lower than that of enterprises in the Quebec or Gulf regions (Figure 8). This can be partly explained by the fact that they have access to one of the four Shrimp Fishing Areas (Esquiman), whereas enterprises from Quebec and the Gulf generally have access to three.
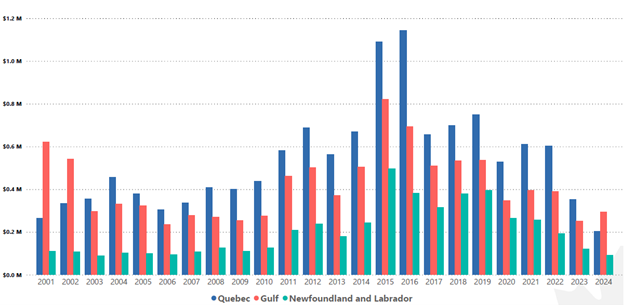
Figure 8 - Text version
- Year: 2001
- Quebec: $0.26M
- Gulf: $0.62M
- Newfoundland and Labrador: $0.11M
- Year: 2002
- Quebec: $0.33M
- Gulf: $0.54M
- Newfoundland and Labrador: $0.11M
- Year: 2003
- Quebec: $0.35M
- Gulf: $0.30M
- Newfoundland and Labrador: $0.09M
- Year: 2004
- Quebec: $0.46M
- Gulf: $0.33M
- Newfoundland and Labrador: $0.10M
- Year: 2005
- Quebec: $0.38M
- Gulf: $0.32M
- Newfoundland and Labrador: $0.10M
- Year: 2006
- Quebec: $0.30M
- Gulf: $0.24M
- Newfoundland and Labrador: $0.09M
- Year: 2007
- Quebec: $0.34M
- Gulf: $0.28M
- Newfoundland and Labrador: $0.11M
- Year: 2008
- Quebec: $0.41M
- Gulf: $0.27M
- Newfoundland and Labrador: $0.12M
- Year: 2009
- Quebec: $0.40M
- Gulf: $0.25M
- Newfoundland and Labrador: $0.11M
- Year: 2010
- Quebec: $0.44M
- Gulf: $0.28M
- Newfoundland and Labrador: $0.13M
- Year: 2011
- Quebec: $0.58M
- Gulf: $0.46M
- Newfoundland and Labrador: $0.21M
- Year: 2012
- Quebec: $0.69M
- Gulf: $0.50M
- Newfoundland and Labrador: $0.24M
- Year: 2013
- Quebec: $0.56M
- Gulf: $0.37M
- Newfoundland and Labrador: $0.18M
- Year: 2014
- Quebec: $0.67M
- Gulf: $0.51M
- Newfoundland and Labrador: $0.24M
- Year: 2015
- Quebec: $1.09M
- Gulf: $0.82M
- Newfoundland and Labrador: $0.50M
- Year: 2016
- Quebec: $1.14M
- Gulf: $0.69M
- Newfoundland and Labrador: $0.38M
- Year: 2017
- Quebec: $0.66M
- Gulf: $0.51M
- Newfoundland and Labrador: $0.31M
- Year: 2018
- Quebec: $0.70M
- Gulf: $0.53M
- Newfoundland and Labrador: $0.38M
- Year: 2019
- Quebec: $0.75M
- Gulf: $0.56M
- Newfoundland and Labrador: $0.40M
- Year: 2020
- Quebec: $0.53M
- Gulf: $0.36M
- Newfoundland and Labrador: $0.26M
- Year: 2021
- Quebec: $0.61M
- Gulf: $0.43M
- Newfoundland and Labrador: $0.26M
- Year: 2022
- Quebec: $0.60M
- Gulf: $0.41M
- Newfoundland and Labrador: $0.19M
- Year: 2023
- Quebec: $0.35M
- Gulf: $0.25M
- Newfoundland and Labrador: $0.12M
- Year: 2024
- Quebec: $0.20M
- Gulf: $0.29M
- Newfoundland and Labrador: $0.09M
The number of active enterprises in the EGSL shrimp fishery in Newfoundland and Labrador decreased by 48 % between 2015 and 2023, from 42 to 22 (Figure 9). This number increased by 36 % in 2024, reaching 30 active enterprises. Between 2017 and 2022, EGSL shrimp accounted for more than 50 % of revenues for the majority of active enterprises. However, in 2023, only nine enterprises—about 41 % of the total—still depended on shrimp for more than 50 % of their revenue, and in 2024, they were six, representing 20 % of active enterprises.
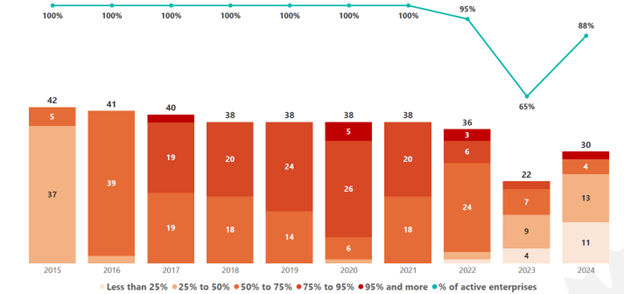
Figure 9 - Text version
The curve represents the percentage of active enterprises relative to the total number of enterprises.
- Year: 2015
- less than 25%: 0
- between 25% and 50%: 37
- between 50% and 75%: 5
- between 75% and 95%: 0
- greater than 95%: 0
- Total: 42
- Percentage of active enterprises relative to the total number of EGSL enterprises in Newfoundland and Labrador (Group A): 100%
- Year: 2016
- less than 25%: 0
- between 25% and 50%: 2
- between 50% and 75%: 39
- between 75% and 95%: 0
- greater than 95%: 0
- Total: 41
- Percentage of active enterprises relative to the total number of EGSL shrimp enterprises in Newfoundland and Labrador (Group A): 100%
- Year: 2017
- less than 25%: 0
- between 25% and 50%: 0
- between 50% and 75%: 19
- between 75% and 95%: 19
- greater than 95%: 2
- Total: 40
- Percentage of active enterprises relative to the total number of EGSL enterprises in Newfoundland and Labrador (Group A): 100%
- Year: 2018
- less than 25%: 0
- between 25% and 50%: 0
- between 50% and 75%: 18
- between 75% and 95%: 20
- greater than 95%: 0
- Total: 38
- Percentage of active enterprises relative to the total number of EGSL enterprises in Newfoundland and Labrador (Group A): 100%
- Year: 2019
- Number of Newfoundland and Labrador (Group A) fishing enterprises that participated in shrimp fishing and for which shrimp fishing revenue was less than 25%: 0
- between 25% and 50%: 0
- between 50% and 75%: 14
- between 75% and 95%: 24
- greater than 95%: 0
- Total: 38
- Percentage of active enterprises relative to the total number of EGSL enterprises in Newfoundland and Labrador (Group A): 100%
- Year: 2020
- less than 25%: 0
- between 25% and 50%: 1
- between 50% and 75%: 6
- between 75% and 95%: 26
- greater than 95%: 5
- Total: 38
- Percentage of active enterprises relative to the total number of EGSL enterprises in Newfoundland and Labrador (Group A): 100%
- Year: 2021
- less than 25%: 0
- between 25% and 50%: 0
- between 50% and 75%: 18
- between 75% and 95%: 20
- greater than 95%: 0
- Total: 38
- Percentage of active enterprises relative to the total number of EGSL enterprises in Newfoundland and Labrador (Group A): 100%
- Year: 2022
- less than 25%: 1
- between 25% and 50%: 2
- between 50% and 75%: 24
- between 75% and 95%: 6
- greater than 95%: 3
- Total: 36
- Percentage of active enterprises relative to the total number of EGSL enterprises in Newfoundland and Labrador (Group A): 95%
- Year: 2023
- less than 25%: 4
- between 25% and 50%: 9
- between 50% and 75%: 7
- between 75% and 95%: 2
- greater than 95%: 0
- Total: 22
- Percentage of active enterprises relative to the total number of EGSL enterprises in Newfoundland and Labrador (Group A): 65%
- Year: 2024
- less than 25%: 11
- between 25% and 50%: 13
- between 50% and 75%: 4
- between 75% and 95%: 0
- greater than 95%: 2
- Total: 30
- Percentage of active enterprises relative to the total number of EGSL enterprises in Newfoundland and Labrador (Group A): 88%
The number of non-Indigenous fishing enterprises (Group B) active in EGSL shrimp fishing in Quebec decreased by 25% between 2015 and 2023, from 36 to 27, and then by another 60% in 2024, reaching 11 enterprises (Figure 10). Over the same period, the proportion of active non-Indigenous enterprises declined from 90% to 79%, and then to 32% in 2024. Figure 10 also shows the number of active non-Indigenous enterprises in the shrimp fishery according to the proportion of their revenue derived from this fishery. It can be observed that throughout the 2015 to 2023 period, the majority of active non-Indigenous enterprises depended on EGSL shrimp for more than 95% of their total fishing revenue. In 2024, 45% of Quebec’s active non-Indigenous enterprises depended on EGSL shrimp for more than 95% of their total fishing revenue—that is, five out of 11.
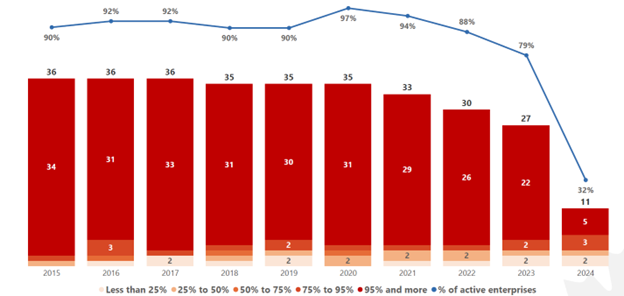
Figure 10 - Text version
The curve represents the percentage of active enterprises relative to the total number of enterprises.
- Year: 2015
- less than 25%: 0
- between 25% and 50%: 1
- between 50% and 75%: 0
- between 75% and 95%: 1
- over 95%: 34
- Total: 36
- Percentage of active non-Indigenous enterprises relative to the total number of non-Indigenous enterprises from Quebec (Group B) in the EGSL: 90%
- Year: 2016
- less than 25%: 1
- between 25% and 50%: 0
- between 50% and 75%: 1
- between 75% and 95%: 3
- over 95%: 31
- Total: 36
- Percentage of active non-Indigenous enterprises relative to the total number of non-Indigenous enterprises from Quebec (Group B) in the EGSL: 92%
- Year: 2017
- less than 25%: 2
- between 25% and 50%: 0
- between 50% and 75%: 0
- between 75% and 95%: 1
- over 95%: 33
- Total: 36
- Percentage of active non-Indigenous enterprises relative to the total number of non-Indigenous enterprises from Quebec (Group B) in the EGSL: 92%
- Year: 2018
- less than 25%: 1
- between 25% and 50%: 1
- between 50% and 75%: 1
- between 75% and 95%: 1
- over 95%: 31
- Total: 35
- Percentage of active non-Indigenous enterprises relative to the total number of non-Indigenous enterprises from Quebec (Group B) in the EGSL: 90%
- Year: 2019
- less than 25%: 2
- between 25% and 50%: 1
- between 50% and 75%: 0
- between 75% and 95%: 2
- over 95%: 30
- Total: 35
- Percentage of active non-Indigenous enterprises relative to the total number of non-Indigenous enterprises from Quebec (Group B) in the EGSL: 90%
- Year: 2020
- less than 25%: 0
- between 25% and 50%: 2
- between 50% and 75%: 1
- between 75% and 95%: 1
- over 95%: 31
- Total: 35
- Percentage of active non-Indigenous enterprises relative to the total number of non-Indigenous enterprises from Quebec (Group B) in the EGSL: 97%
- Year: 2021
- less than 25%: 1
- between 25% and 50%: 2
- between 50% and 75%: 0
- between 75% and 95%: 1
- over 95%: 29
- Total: 33
- Percentage of active non-Indigenous enterprises relative to the total number of non-Indigenous enterprises from Quebec (Group B) in the EGSL: 94%
- Year: 2022
- less than 25%: 1
- between 25% and 50%: 2
- between 50% and 75%: 0
- between 75% and 95%: 1
- over 95%: 26
- Total: 30
- Percentage of active non-Indigenous enterprises relative to the total number of non-Indigenous enterprises from Quebec (Group B) in the EGSL: 88%
- Year: 2023
- less than 25%: 2
- between 25% and 50%: 1
- between 50% and 75%: 0
- between 75% and 95%: 2
- over 95%: 22
- Total: 27
- Percentage of active non-Indigenous enterprises relative to the total number of non-Indigenous enterprises from Quebec (Group B) in the EGSL: 79%
- Year: 2024
- less than 25%: 2
- between 25% and 50%: 1
- between 50% and 75%: 0
- between 75% and 95%: 3
- over 95%: 5
- Total: 11
- Percentage of active non-Indigenous enterprises relative to the total number of non-Indigenous enterprises from Quebec (Group B) in the EGSL: 32%
Between 2015 and 2024, the number of non-Indigenous actives enterprises in EGSL shrimp fishing (Group B) in New Brunswick decreased by 71%, from 24 to 6 (Figure 11). During the same period, the proportion of active non-Indigenous enterprises dropped from 100% to 35%. This figure also shows that over the same period, the number of active non-Indigenous enterprises that depended on EGSL shrimp for more than 95% of their fishing revenues declined significantly. While there were 11 out of 24 (46%) in New Brunswick in 2015, only 3 out of 6 (50%) remained in 2024.
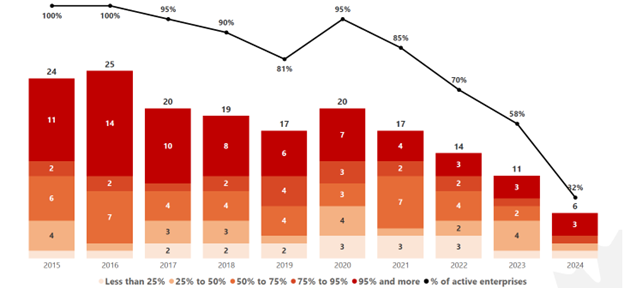
Figure 11 - Text version
The curve represents the percentage of active enterprises relative to the total number of enterprises.
- Year: 2015
- less than 25%: 1
- between 25% and 50%: 4
- between 50% and 75%: 6
- between 75% and 95%: 2
- over 95%: 11
- Total: 24
- Percentage of active non-Indigenous enterprises relative to the total number of non-Indigenous enterprises from New Brunswick (Group B) in the EGSL: 100%
- Year: 2016
- less than 25%: 1
- between 25% and 50%: 1
- between 50% and 75%: 7
- between 75% and 95%: 2
- over 95%: 14
- Total: 25
- Percentage of active non-Indigenous enterprises relative to the total number of non-Indigenous enterprises from New Brunswick (Group B) in the EGSL: 100%
- Year: 2017
- less than 25%: 2
- between 25% and 50%: 3
- between 50% and 75%: 4
- between 75% and 95%: 1
- over 95%: 11
- Total: 21
- Percentage of active non-Indigenous enterprises relative to the total number of non-Indigenous enterprises from New Brunswick (Group B) in the EGSL: 100%
- Year: 2018
- less than 25%: 2
- between 25% and 50%: 3
- between 50% and 75%: 4
- between 75% and 95%: 2
- over 95%: 8
- Total: 19
- Percentage of active non-Indigenous enterprises relative to the total number of non-Indigenous enterprises from New Brunswick (Group B) in the EGSL: 100%
- Year: 2019
- less than 25%: 2
- between 25% and 50%: 1
- between 50% and 75%: 4
- between 75% and 95%: 4
- over 95%: 7
- Total: 18
- Percentage of active non-Indigenous enterprises relative to the total number of non-Indigenous enterprises from New Brunswick (Group B) in the EGSL: 95%
- Year: 2020
- less than 25%: 3
- between 25% and 50%: 4
- between 50% and 75%: 3
- between 75% and 95%: 3
- over 95%: 8
- Total: 21
- Percentage of active non-Indigenous enterprises relative to the total number of non-Indigenous enterprises from New Brunswick (Group B) in the EGSL: 100%
- Year: 2021
- less than 25%: 3
- between 25% and 50%: 1
- between 50% and 75%: 7
- between 75% and 95%: 2
- over 95%: 6
- Total: 19
- Percentage of active non-Indigenous enterprises relative to the total number of non-Indigenous enterprises from New Brunswick (Group B) in the EGSL: 100%
- Year: 2022
- less than 25%: 3
- between 25% and 50%: 2
- between 50% and 75%: 4
- between 75% and 95%: 2
- over 95%: 4
- Total: 15
- Percentage of active non-Indigenous enterprises relative to the total number of non-Indigenous enterprises from New Brunswick (Group B) in the EGSL: 83%
- Year: 2023
- less than 25%: 1
- between 25% and 50%: 4
- between 50% and 75%: 2
- between 75% and 95%: 1
- over 95%: 3
- Total: 11
- Percentage of active non-Indigenous enterprises relative to the total number of non-Indigenous enterprises from New Brunswick (Group B) in the EGSL: 65%
- Year: 2024
- less than 25%: 1
- between 25% and 50%: 1
- between 50% and 75%: 0
- between 75% and 95%: 1
- over 95%: 3
- Total: 6
- Percentage of active non-Indigenous enterprises relative to the total number of non-Indigenous enterprises from New Brunswick (Group B) in the EGSL: 35%
Between 2015 and 2023, five of the seven Indigenous enterprises (Group B) were active in this fishery. The other two enterprises transferred their allocations (Figure 12). This figure also shows that in 2023, EGSL shrimp accounted for less than 25% of the revenues of these five enterprises, whereas eight years earlier, in 2015, four of them derived 25% to 50% of their total revenues from EGSL shrimp, and one enterprise derived more than 50% of its total revenues from EGSL shrimp.
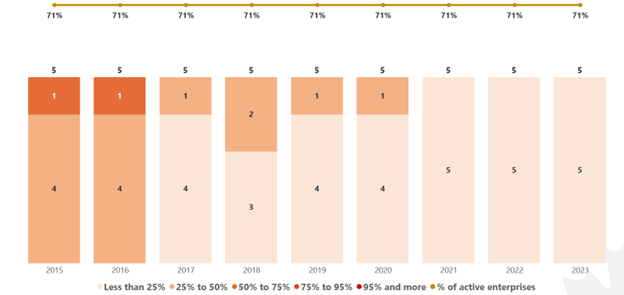
Figure 12 - Text version
The curve represents the percentage of active enterprises relative to the total number of enterprises.
- Year: 2015
- less than 25%: 0
- between 25% and 50%: 4
- between 50% and 75%: 1
- between 75% and 95%: 0
- over 95%: 0
- Total: 5
- Percentage of active Indigenous enterprises relative to the total number of Indigenous enterprises in the EGSL: 71%
- Year: 2016
- less than 25%: 0
- between 25% and 50%: 4
- between 50% and 75%: 1
- between 75% and 95%: 0
- over 95%: 0
- Total: 5
- Percentage of active Indigenous enterprises relative to the total number of Indigenous enterprises in the EGSL: 71%
- Year: 2017
- less than 25%: 4
- between 25% and 50%: 4
- between 50% and 75%: 0
- between 75% and 95%: 0
- over 95%: 0
- Total: 5
- Percentage of active Indigenous enterprises relative to the total number of Indigenous enterprises in the EGSL: 71%
- Year: 2018
- less than 25%: 3
- between 25% and 50%: 2
- between 50% and 75%: 0
- between 75% and 95%: 0
- over 95%: 0
- Total: 5
- Percentage of active Indigenous enterprises relative to the total number of Indigenous enterprises in the EGSL: 71%
- Year: 2019
- less than 25%: 4
- between 25% and 50%: 1
- between 50% and 75%: 0
- between 75% and 95%: 0
- over 95%: 0
- Total: 5
- Percentage of active Indigenous enterprises relative to the total number of Indigenous enterprises in the EGSL: 71%
- Year: 2020
- less than 25%: 4
- between 25% and 50%: 1
- between 50% and 75%: 0
- between 75% and 95%: 0
- over 95%: 0
- Total: 5
- Percentage of active Indigenous enterprises relative to the total number of Indigenous enterprises in the EGSL: 71%
- Year: 2021
- less than 25%: 5
- between 25% and 50%: 0
- between 50% and 75%: 0
- between 75% and 95%: 0
- over 95%: 0
- Total: 5
- Percentage of active Indigenous enterprises relative to the total number of Indigenous enterprises in the EGSL: 71%
- Year: 2022
- less than 25%: 5
- between 25% and 50%: 0
- between 50% and 75%: 0
- between 75% and 95%: 0
- over 95%: 0
- Total: 5
- Percentage of active Indigenous enterprises relative to the total number of Indigenous enterprises in the EGSL: 71%
- Year: 2023
- less than 25%: 5
- between 25% and 50%: 0
- between 50% and 75%: 0
- between 75% and 95%: 0
- over 95%: 0
- Total: 5
- Percentage of active Indigenous enterprises relative to the total number of Indigenous enterprises in the EGSL: 71%
1.7 Stakeholder participation in the development of the plan
A working group composed of DFO representatives, First Nations, provincial governments, and fishing industry stakeholders was formed to gather perspectives on the elements to be included in the shrimp rebuilding plan for Areas 8, 9, and 10. Members of the Estuary and Gulf of St. Lawrence Shrimp Advisory Committee (EGSAC) were invited to participate in this process. The list of working group members is provided in Tab 1. The proposed rebuilding plan elements developed by the working group were brought to the EGSAC as well as to two ENGOs for their input and recommendations before being submitted to the Minister of DFO for decision.
Stock status and trends
2.1 Precautionary approach
In 2009, DFO introduced A Fishery Decision-Making Framework Incorporating the Precautionary Approach (PA Policy), which applies to key harvested stocks managed by DFO. In accordance to the PA policy, all removals by all types of fishing must be taken into account. For each stock, a PA framework is established that includes:
- reference points and stock status zones (healthy, cautious and critical);
- harvest control rules; and
- the need to account for uncertainty and risk when developing and implementing decision rules.
In the case of the EGSL shrimp, an initial precautionary approach was adopted in 2012 (DFO, 2011) and an updated PA was proposed in 2023. The PA was revised in part as the prevailing ecosystem conditions differed from those at the time the first one was developed, and because a bias had been observed in the main stock status indicator. New limit reference points (LRPs), upper stock reference points (USRs), and target reference points (TRPs), along with various harvest control rule (HCR) scenarios, were proposed and peer-reviewed in 2023. The reference points are based on the relative trajectory of biomass compared to the biomass at maximum sustainable yield (B/BMSY), using the longest available data series (1990 to 2023) (DFO 2023).
Table 3. Summary of reference points under the PA framework for shrimp in SFAs 8, 9, and 10
- Limit Reference Point (LRP) stock-specific reference value: 0.4
- Proposed Upper Stock Reference Point (USR) stock-specific reference value: 0.8
- Proposed Target Reference Point (TRP) stock-specific reference value: 1.0
2.2 Stock trends
After a period of growth in the 1990s through the mid-2000s, the estimated relative biomasses for Sept-Îles, Anticosti, and Esquiman have shown a declining trend over the past two decades. Since 2022, they have reached the lowest values in the time series beginning in 1990 (Figure 13) (DFO, 2025).
In 2023, the three stocks were assessed as being below their LRP for the first time (DFO, 2023). In 2024, the biomass of the Anticosti and Esquiman stocks was estimated at 0.22 BMSY (55% of the LRP) and 0.30 BMSY (75% of the LRP), respectively. The biomass of the Sept-Îles stock was estimated at only 0.09 BMSY, or 23% of the LRP. The stock status indicators for all three stocks are therefore below their limit reference point, with very high or high probabilities, placing these stocks in the critical zone of the PA.
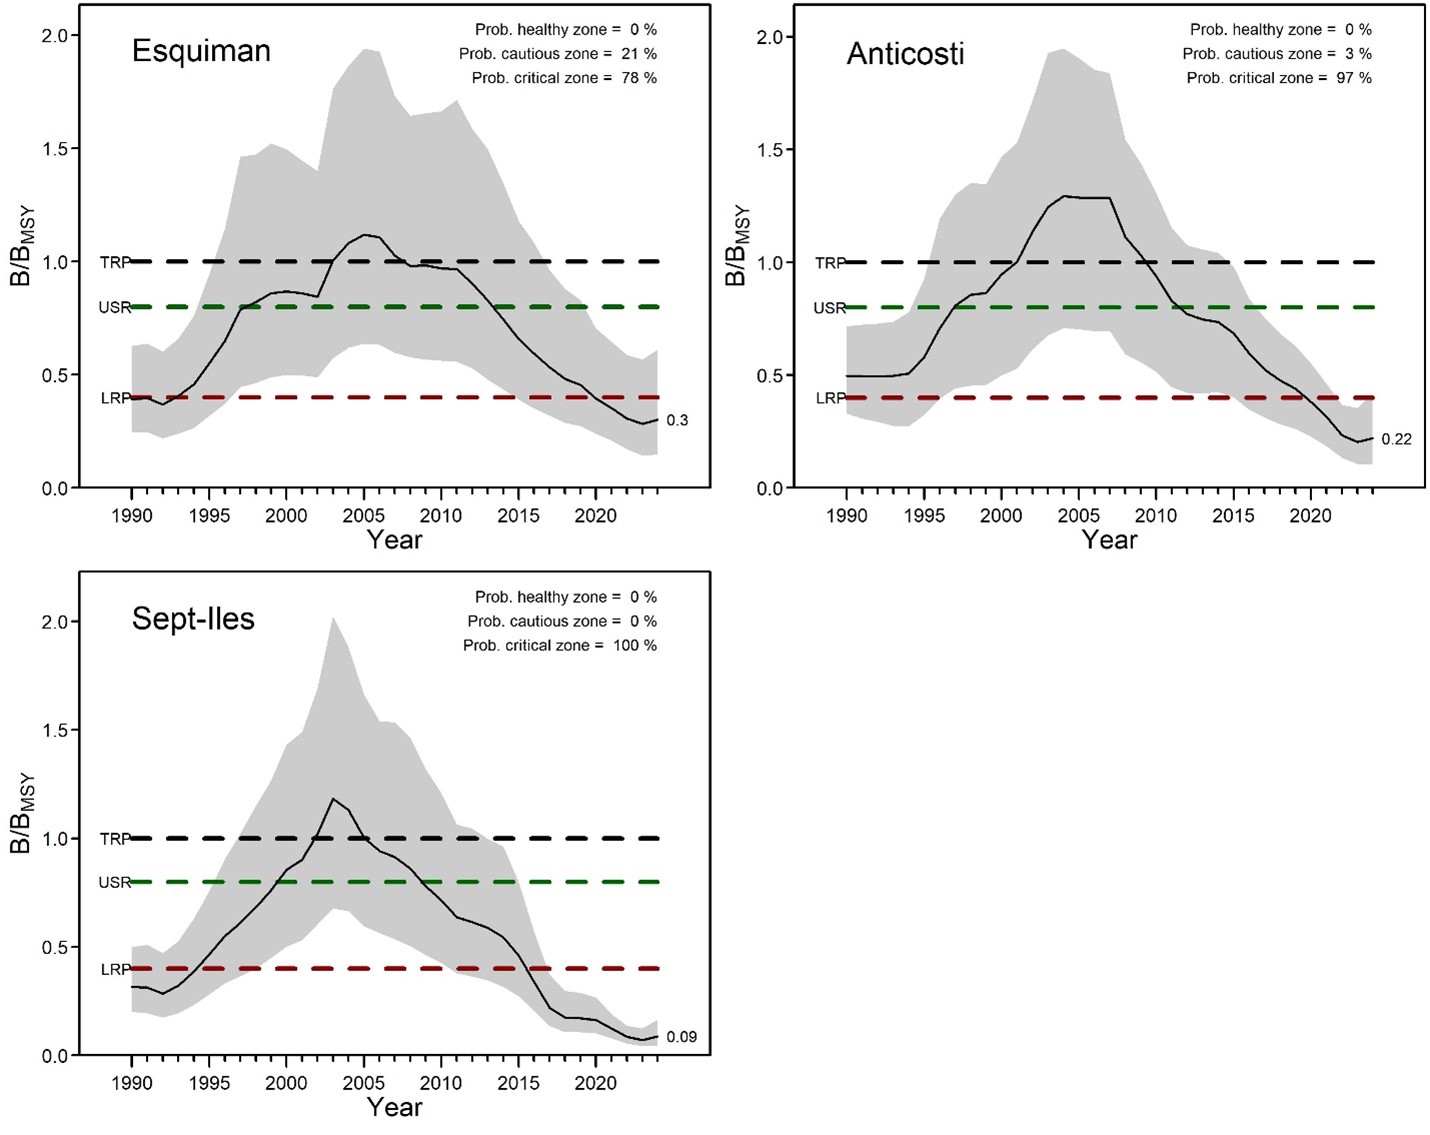
Figure 13 - Text version
Figure 13 shows the trajectory of estimated relative shrimp biomass from 1990 to 2024, based on the surplus production model, for the Esquiman (top left), Anticosti (top right), and Sept-Îles (bottom left) stocks. Relative biomass corresponds to the ratio between annual biomass and the biomass at maximum sustainable yield (B/ BMSY). The reference points for each stock are shown as horizontal lines: the limit reference point (LRP) as a red dashed line at 0.4, the upper stock reference point (USR) as a green dashed line at 0.8, and the target reference point (TRP) as a black dashed line at 1.0. The grey area around the B/ BMSY black line represents the 95% credibility interval. The LRP marks the boundary between the critical zone of the DFO’s precautionary approach (below the red line) and the cautious zone (above). At higher B/ BMSY values lies the healthy zone of the DFO’s precautionary framework, although the exact B/ BMSY level separating the cautious and healthy zones has not yet been officially established.
- Esquiman stock: The estimated relative biomass increased from 1990, peaking in 2006. Since 2007, it has declined, reaching the lowest values in the time series since 2022. The biomass has been in the critical zone since 2020, and in 2024, it was estimated at 0.30 BMSY, or 75% of the LRP. The Esquiman stock is currently below the LRP and therefore in the critical zone of the PA, with a 78% probability.
- Anticosti stock: The estimated relative biomass increased from 1990, peaking between 2004 and 2007. Since 2008, it has declined, reaching the lowest values in the time series that began in 1990. Biomass has been in the critical zone since 2020, and in 2024, it was estimated at 0.22 BMSY, or 55% of the LRP. The Anticosti stock is currently below the LRP and therefore in the critical zone of the PA, with a 97% probability.
- Sept-Îles stock: The estimated relative biomass increased from 1990, reaching a peak in 2003. Since 2004, it has declined, reaching the lowest values since 2022 in the time series since that began in 1990. Biomass has been in the critical zone since 2016, and in 2024, it was estimated at 0.09 BMSY, or 23% of the LRP. The Sept-Îles stock is currently below the LRP and therefore in the critical zone of the PA, with a 100% probability.
The exploitation rate trajectories of the three stocks followed similar trends over time (Figure 14). In the early 1990s, exploitation rates declined. In the late 1990s and early 2000s, exploitation rates were at their lowest. Starting in 2005, exploitation rates increased, reaching historic highs in 2021 and 2022. This upward trend reversed in 2023. Relative exploitation rates dropped significantly in 2023 and 2024 due to reduced landings. In 2024, they were the lowest in the time series beginning in 1990.
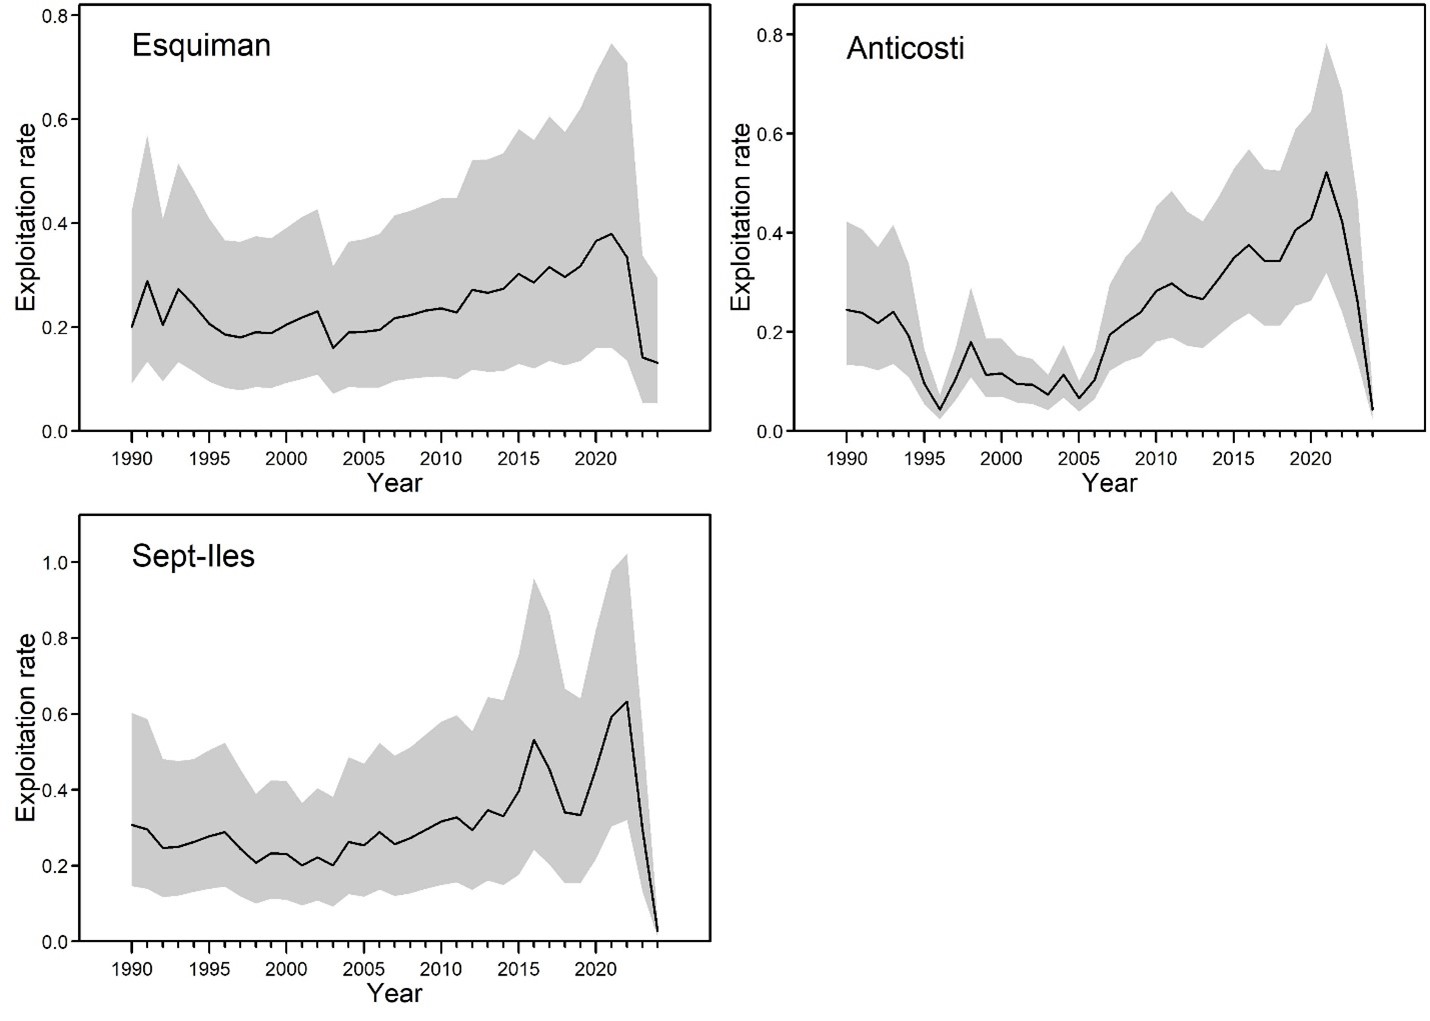
Figure 14 - Text version
Figure 14 shows the trajectory of the relative exploitation rate estimated by the surplus production model from 1990 to 2024 for the Esquiman (top left), Anticosti (top right), and Sept-Îles (bottom left) stocks. The grey area around the black line representing the relative exploitation rate indicates the 95 % credibility interval.
- Esquiman stock: The increasing trend in relative exploitation rates observed since 2005 reversed in 2022. Since then, the exploitation rate has declined, reaching a low value in 2024.
- Anticosti stock: The increasing trend in relative exploitation rates observed since 2005 reversed in 2022. Since then, the exploitation rate has declined, reaching a low value in 2024.
- Sept-Îles stock: The increasing trend in relative exploitation rates observed since 2005 reversed in 2023. Since then, the exploitation rate has declined, reaching a low value in 2024.
3 Probable causes of stock decline
The decline in shrimp stocks in the EGSL is attributable to a combination of environmental, biological, and anthropogenic factors.
- Adverse environmental conditions:
Northern shrimp is a cold-water species. The Gulf of St. Lawrence lies near the southern limit of its distribution range, and deep-water temperatures are approaching the upper limit of its thermal preference. With the warming and deoxygenation of deep waters observed over the past 15 years, northern shrimp is now exposed to increasingly unfavourable environmental conditions. Although deep-water temperatures have stabilized in 2023 and 2024, part of the shrimp population remains exposed to historically warm and oxygen-poor conditions.
Females are less tolerant to hypoxia than males, but in general, both sexes become more sensitive as temperatures rise. Between 2022 and 2024, at least 50 % of female shrimp from the Sept-Îles, Anticosti, and Esquiman stocks were exposed to oxygen levels below laboratory-established critical thresholds and to temperatures above 6.3 °C, and even 7 °C in some areas. A recent study assessing the impact of warming, acidification, and hypoxia in laboratory conditions shows that shrimp survival and aerobic performance could decrease significantly when exposed to these combined stressors (Guscelli et al. 2023). This prolonged exposure to suboptimal conditions could compromise shrimp growth, survival, and reproduction, thereby limiting stock rebuilding. These conditions may continue to deteriorate in the long term according to various climate change models (Lavoie et al. 2020).
The combined effect of warming and oxygen depletion in deep waters is leading to a loss of favourable habitat for shrimp, forcing the species to concentrate in shallower areas and on smaller surfaces, near the cold intermediate layer. This increases their vulnerability to external pressures and has probably contributed to their decline.
- Increased predation pressure:
Predation pressure from redfish has been high over the past eight years (Senay et al. 2023) and is considered a major factor contributing to the decline of shrimp. In 2023, the biomass of redfish (Sebastes mentella) in the EGSL was estimated at 2.3 million tonnes, compared with less than 0.1 million tonnes before 2013 (DFO, 2024). Although redfish biomass has been declining since 2020, predation pressure is expected to remain at historically high levels in the coming years.
Other shrimp predators, such as Greenland halibut and cod, are currently at low abundance. Observations in the northern Gulf have shown that stomach fullness indices for both Greenland halibut and cod are low, and the contribution of northern shrimp to their diet has decreased compared with previous years.
- Low productivity and recruitment:
The low abundance of juveniles and males in recent years, along with the declining trend in female size, indicate reduced stock productivity.
- Fishing pressure:
The extent to which fishing has contributed to the decline of EGSL shrimp stocks is unknown. Although fishing pressure has decreased in recent years, its combination with other factors increases the vulnerability of the stocks to harvesting.
- Low genetic adaptability:
Studies show low genetic variability in thermal plasticity, which limits the ability of northern shrimp to adapt to rapid environmental changes (Leung et al. 2023).
In summary, the outlook for these stocks depends on the sensitivity and resilience of shrimp to environmental changes, predation pressure, and fishing pressure. Given current conditions, stock rebuilding appears unlikely in the short to medium term, even in the absence of fishing mortality. High predation pressure and unfavourable environmental conditions are not expected to improve significantly in the short to medium term and are likely to hinder stock growth.
4 Measurable objectives aimed at rebuilding the stock
As outlined in the PA Policy, the primary objective of a rebuilding plan is to promote stock growth out of the critical zone (i.e., grow the stock above the LRP with a high to very high likelihood). Thus, the objectives described below strictly concern the Sept-Îles, Anticosti and Esquiman areas, as the Estuary area is not in the critical zone.
The rebuilding targets, milestones, rebuilding plan objectives, and associated timelines are described below. If the rebuilding targets can be reached, the rebuilding plan will end and the fishery for the stocks will be subject to an IFMP or another form of management plan. The latter will contain objectives to promote sustainable management and further growth and maintenance of the stocks above their USR or at their TRP.
4.1 Rebuilding targets and timelines
4.1.1 Rebuilding target
Based on the Guidelines for writing rebuilding plans per the Fish Stocks Provisions and A Fishery Decision-making Framework Incorporating the Precautionary Approach, the rebuilding target is a biomass level above the LRP such that there is a very low to low probability that the stock is below its LRP (< 5% to 25% probability).
Given that a model-based quantitative assessment is in place for the EGSL shrimp, rebuilding targets and the subsequent monitoring of stock dynamics were carried out using the surplus production model, which incorporates relative biomass values (B/BMSY). Assuming the quality of the assessment remains consistent, the relative errors on current B/BMSY estimates should reflect the relative errors on future estimates and can be used to define rebuilding targets that meet the above requirements.
The rebuilding targets for the three shrimp stocks are:
- SFA 8 Esquiman: Increase biomass to a level above the LRP with a probability of 75%, i.e., to a value greater than 49% of B/BMSY.
- SFA 9 Anticosti: Increase biomass to a level above the LRP with a probability of 75%, i.e., to a value greater than 49% of B/BMSY.
- SFA 10 Sept-Îles: Increase biomass to a level above the LRP with a probability of 75%, i.e., to a value greater than 48% of B/BMSY.
4.1.2 Rebuilding timeline
It is not feasible to establish a timeline for reaching the rebuilding targets for the three shrimp stocks due to the inability to calculate Tmin or to provide expert judgment regarding the generation time for the species. In accordance with subsection 70(6) of the Fishery (General) Regulations, rebuilding timelines have been omitted from the plan.
Shrimp stock productivity has declined and has not yet stabilized. The rebuilding targets are based on historical conditions and are not expected to be reached under current productivity conditions. Rebuilding the shrimp stocks appears unlikely under current productivity levels, even in the absence of fishing. The main factor limiting the likelihood of stock growth is high natural mortality. The shrimp stocks are currently undergoing a productivity regime shift. It is considered premature and not prudent to adjust the objectives based on current productivity (Mormede et al., in prep). During each periodic review of the plan, the factors limiting the potential for stock growth will be reassessed to determine whether they continue to affect the stocks and whether a rebuilding timeline can be calculated (see section on periodic review of the rebuilding plan).
4.2 Other measurable objectives and timelines
To support rebuilding of the stocks toward their rebuilding targets, secondary rebuilding objectives have been established for the EGSL shrimp stocks (Table 4).
Milestones, or intermediate targets, have been set for each shrimp stock. These milestones will help track the progress of the stocks toward the rebuilding targets and are as follows:
- SFA 8 Esquiman: Achieve a positive stock growth trajectory with a probability of 75% within 5 years.
- SFA 9 Anticosti: Achieve a positive stock growth trajectory with a probability of 75% within 5 years.
- SFA 10 Sept-Îles: Achieve a positive stock growth trajectory with a probability of 75% within 5 years.
The timeline for reaching these milestones has been set to five years, as this also corresponds to the review period of the rebuilding plan. The first year of this timeline is 2025.
The rebuilding plan also includes three objectives aimed at addressing knowledge gaps related to natural mortality:
- Continue to study the predation of shrimp by groundfish, particularly redfish
Considering redfish predation is crucial for a complete understanding of the factors influencing natural mortality in shrimp stocks. This will help ensure that the rebuilding plan is based on a realistic understanding of the ecosystem, thereby supporting sustainable shrimp management. - Continue to study the impact of environmental changes on shrimp
Environmental changes are causing shrimp to shift their distribution within the EGSL, thereby affecting the extent of their critical habitat and productivity of the stocks. Understanding the availability of current and future critical habitats for the different shrimp stocks is vital in the context of climate change and will allow for the adjustment of management measures accordingly. - Advance the stock assessment model to account for the productivity regime shift
Integrate productivity regime shifts into the shrimp stock assessment model. This is fundamental to ensuring the effectiveness of the rebuilding plan. It will allow for better tracking of natural mortality and more reliable diagnostics of stock status and therefore inform appropriate management measures that reflect current realities.
Table 4. Measurable objectives and timelines for shrimp stock rebuilding
- Objective 1: SFA 8 Esquiman – Increase biomass to a level above the LRP with a probability of 75%, i.e., to a value greater than 49% of B/BMSY.
- Type or category of objective: Rebuilding target
- Timeline: A timeline cannot be established at this time, see Section 4.1. Progress will be assessed through stock assessments and periodic reviews of the rebuilding plan.
- Objective 2: SFA 9 Anticosti – Increase biomass to a level above the LRP with a probability of 75%, i.e., to a value greater than 49% of B/BMSY.
- Type or category of objective: Rebuilding target
- Timeline: A timeline cannot be established at this time, see Section 4.1. Progress will be assessed through stock assessments and periodic reviews of the rebuilding plan.
- Objective 3: SFA 10 Sept-Îles – Increase biomass to a level above the LRP with a probability of 75%, i.e., to a value greater than 48% of B/BMSY.
- Type or category of objective: Rebuilding target
- Timeline: A timeline cannot be established at this time, see Section 4.1. Progress will be assessed through stock assessments and periodic reviews of the rebuilding plan.
- Objective 4: SFA 8 Esquiman – Achieve a positive stock growth trajectory with a probability of 75% within 5 years.
- Type or category of objective: Rebuilding milestone
- Timeline: 5 years, aligned with the periodic review of the plan.
- Objective 5: SFA 9 Anticosti – Achieve a positive stock growth trajectory with a probability of 75% within 5 years.
- Type or category of objective: Rebuilding milestone
- Timeline: 5 years, aligned with the periodic review of the plan.
- Objective 6: SFA 10 Sept-Îles – Achieve a positive stock growth trajectory with a probability of 75% within 5 years.
- Type or category of objective: Rebuilding milestone
- Timeline: 5 years, aligned with the periodic review of the plan.
- Objective 7: Continue to study the predation of shrimp by groundfish, particularly redfish.
- Type or category of objective: Knowledge gap
- Timeline: Progress will be assessed during each stock assessment.
- Objective 8: Continue to study the impact of environmental changes on shrimp.
- Type or category of objective: Knowledge gap
- Timeline: Progress will be assessed following the CSAS peer review scheduled for 2028.
- Objective 9: Advance the stock assessment model to account for the productivity regime shift.
- Type or category of objective: Knowledge gap
- Timeline: Progress will be assessed during the periodic review of the rebuilding plan.
5 Management measures aimed at achieving the objectives
Several management or departmental measures are required to achieve the objectives outlined in Section 4. These measures and their expected outcomes are presented below.
5.1 Key management measures
A harvest control rule (HCR) is implemented for the three shrimp stocks under this rebuilding plan to support stock growth toward their rebuilding targets and milestones (Objectives 1 to 6). The HCR prescribes the maximum exploitation rate based on the stock status indicator. According to this HCR, the exploitation rate is maintained at a maximum of 50% of the removal reference rate when the stock is below the LRP (Figure 15 – top), and projected removals decrease or increase proportionally based on the stock status indicator (Figure 15 – bottom).
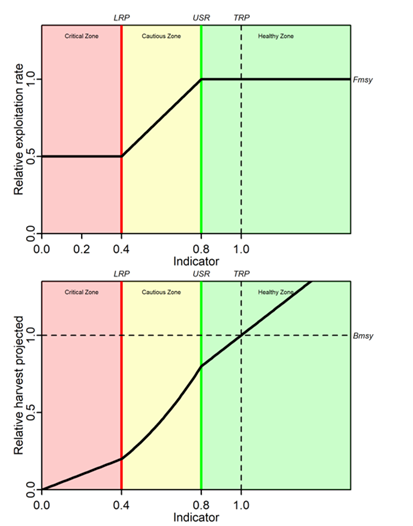
Figure 15 - Text version
The relative reference points are shown on the graphs as vertical lines that define the three PA zones.
Both panels in the figure represent the three stock status zones and reference points according to the precautionary approach framework. The critical zone (on the left), which extends from 0.0 to 0.4 on the horizontal axis, is separated from the cautious zone by a solid vertical line representing the LRP (Limit Reference Point). The cautious zone (in the centre), which extends from 0.4 to 0.8, is separated from the healthy zone by a green vertical line representing the USR (Upper Stock Reference). A black dotted vertical line marks the TRP (Target Reference Point), at a stock status indicator value of 1.0.
In the top panel, the relative exploitation rate is on the vertical axis, and the stock status indicator (B/BMSY) is on the horizontal axis. A black curve crosses the three zones and represents the recommended exploitation rate based on stock status. In the critical zone, the curve is flat at a constant exploitation rate of 0.5, indicating a reduced level of exploitation. Upon entering the cautious zone, the curve rises quickly, reflecting a gradual increase in exploitation rate as stock status improves until 1.0. In the healthy zone, the curve levels off at a maximum exploitation rate of 1.0, corresponding to the target rate (FMSY).
In the bottom panel, the relative harvest projected is on the vertical axis, and the stock status indicator (B/BMSY) is on the horizontal axis. The black curve represents projected catches. It starts at the origin of the graph and rises slowly in the critical zone, indicating that projected catches remain very low when stock status is poor. As it enters the cautious zone, the slope increases, reflecting a moderate rise in harvest as the stock improves. In the healthy zone, the slope increases further, indicating greater tolerance for harvest when the stock is in good condition.
5.1.1 Expected outcomes of the harvest control rule
In accordance with DFO’s 2009 PA Policy Framework, as long as stocks remain in the critical zone, management measures must promote stock growth, removals from all sources must be kept at the lowest possible level, and there should be no tolerance for preventable declines.
The most recent stock status update (2024) concluded that the outlook for these stocks depends on the sensitivity and resilience of shrimp to environmental changes, predation pressure, and fishing pressure. While fishing remains one of the factors influencing shrimp stocks dynamics, the exact level of fishing that would be compatible with the rebuilding of each stock remains particularly uncertain in the absence of a model that distinguishes between fishing mortality and natural mortality.
Applying the HCR to determine the authorized removals in 2024 allowed relative exploitation rates to be maintained at low or very low levels. Continuing to manage the fishery under this approach is unlikely to hinder short-term rebuilding efforts.
According to this HCR, an exploitation rate below 50% of the target exploitation rate may be applied, particularly if the most recent scientific advice indicates the need to reduce exploitation to support rebuilding.
The rebuilding plan will be reviewed periodically so that new information can guide adjustments to the HCR.
5.1.2 Measures to address knowledge gaps
This rebuilding plan outlines a work plan to improve understanding of the main causes of stock decline and to enhance the sustainable management of shrimp stocks.
Ongoing work is being conducted to improve the estimation of shrimp predation by redfish and other predators in support of Objective 7. Annual monitoring of the diet of shrimp predators is carried out during the August scientific survey in the EGSL. In addition, results from the scientific project “How many is too many? Deciphering the role of density-dependent factors in redfish (Sebastes mentella and S. fasciatus) and their predator-prey interaction with northern shrimp in the context of climate change” are expected to be available in 2028.
An assessment of the current and future availability of preferred and critical habitats for EGSL shrimp stocks will be conducted using projections from the Gulf of St. Lawrence regional climate model, as part of a three-year funded project (2025–2028), in support of Objective 8.
Finally, a revision of the stock assessment model will be undertaken to address Objective 9. If possible, the stock assessment model will be improved to incorporate the productivity regime shift. This exercise may also lead to a reassessment of the reference points for these stocks.
5.1.3 Habitat loss or degradation
In accordance with section 6.2(5) of the Fisheries Act and based on current knowledge using the best available data, habitat loss or degradation has contributed to the decline of the stocks due to rising water temperatures and reduced dissolved oxygen levels caused by large-scale climate change. No measures to restore shrimp habitat can be considered or implemented under this rebuilding plan, as oceanographic conditions are beyond DFO’s control.
Improving knowledge related to the impacts of ecosystem conditions on shrimp, as outlined in the rebuilding plan, will help inform potential management measures.
The management measures that will be implemented to achieve the objectives outlined in the previous section are presented in Table 5.
Table 5. Summary of objectives, main management measures, and expected outcomes to achieve the rebuilding plan objectives
- Objective 1: SFA 8 Esquiman – Increase biomass to a level above the LRP with a probability of 75%, i.e., to a value greater than 49% of B/BMSY.
- Main management measure: Harvest control rule
- Expected outcomes: See Section 5.1.1
- Biological or environmental conditions considered: HCR application is based on stock assessments that incorporate available information on stock biology and environmental factors.
- Objective 2: SFA 9 Anticosti – Increase biomass to a level above the LRP with a probability of 75%, i.e., to a value greater than 49% of B/BMSY.
- Main management measure: Harvest control rule
- Expected outcomes: See Section 5.1.1
- Biological or environmental conditions considered: HCR application is based on stock assessments that incorporate available information on stock biology and environmental factors.
- Objective 3: SFA 10 Sept-Îles – Increase biomass to a level above the LRP with a probability of 75%, i.e., to a value greater than 48% of B/BMSY.
- Main management measure: Harvest control rule
- Expected outcomes: See Section 5.1.1
- Biological or environmental conditions considered: HCR application is based on stock assessments that incorporate available information on stock biology and environmental factors.
- Objective 4: SFA 8 Esquiman – Achieve a positive stock growth trajectory with a probability of 75% within 5 years.
- Main management measure: Harvest control rule
- Expected outcomes: See Section 5.1.1
- Biological or environmental conditions considered: HCR application is based on stock assessments that incorporate available information on stock biology and environmental factors.
- Objective 5: SFA 9 Anticosti – Achieve a positive stock growth trajectory with a probability of 75% within 5 years.
- Main management measure: Harvest control rule
- Expected outcomes: See Section 5.1.1
- Biological or environmental conditions considered: HCR application is based on stock assessments that incorporate available information on stock biology and environmental factors.
- Objective 6: SFA 10 Sept-Îles – Achieve a positive stock growth trajectory with a probability of 75% within 5 years.
- Main management measure: Harvest control rule
- Expected outcomes: See Section 5.1.1
- Biological or environmental conditions considered: HCR application is based on stock assessments that incorporate available information on stock biology and environmental factors.
- Objective 7: Continue to study the predation of shrimp by groundfish, particularly redfish.
- Main measure: Obtain a reliable estimate of shrimp predation
- Expected outcomes: This measure will improve stock assessments and understanding of redfish impacts on shrimp
- Biological or environmental conditions considered: This measure addresses likely causes of stock decline identified in Section 3
- Objective 8: Continue to study the impact of environmental changes on shrimp.
- Main measure: Assess future usable shrimp habitat
- Expected outcomes: This measure will improve stock assessments and shrimp distribution knowledge
- Biological or environmental conditions considered: This measure addresses likely causes of stock decline identified in Section 3
- Objective 9: Advance the stock assessment model to account for the productivity regime shift.
- Main measure: Undertake a revision of the stock assessment model
- Expected outcomes: This measure will improve stock assessments
- Biological or environmental conditions considered: This measure addresses likely causes of stock decline identified in Section 3.
5.2 Additional management measures
Shrimp fishing in Canada is governed by the Fisheries Act, its regulations, and DFO policies. Existing management measures and monitoring programs ensure the protection and long-term sustainability of marine resources and therefore support the objectives of this rebuilding plan.
The management measures for the commercial shrimp fishery in the EGSL are aligned with the Integrated Fisheries Management Plan (IFMP) for Northern Shrimp – Areas 8, 9, 10, and 12 (Estuary and Gulf of St. Lawrence), which was established in 2018 and is available online. This IFMP is currently being updated, and the measures outlined in this rebuilding plan take precedence over any conflicting measures affecting EGSL shrimp stocks. Guided by the IFMP and the rebuilding plan, fleet-specific management measures for the commercial shrimp fishery are detailed in Conservation Harvesting Plans (CHPs) and licence conditions.
6 Socio-economic analysis
Section 1.6 of this document outlines the socio-economic profile of the EGSL shrimp fishery, including the level of dependence on this fishery by licence-holding enterprises. The main management measures proposed in this rebuilding plan will not result in changes to the method used to establish annual TACs, nor do they propose any modifications to quota allocation. The HCR, which has been used to determine TACs since 2023, will remain the primary measure for managing the fishery under this rebuilding plan. Therefore, the implementation of this rebuilding plan is not expected to have any incremental socio-economic impacts on fishing enterprises, processing plants, Indigenous communities, or affected coastal communities.
7 Method to track progress to achieve the objectives
Progress measurement parameters provide DFO with means to assess the rebuilding plan’s progress relative to its objectives. For each objective, Table 6 below outlines how and when progress will be measured.
The stock status indicator for EGSL shrimp is the B/BMSY estimated from the surplus production model. The next full stock assessment is scheduled for winter 2026. In the interim years between full assessments, the same indicator is used and calculated. This indicator will allow for annual monitoring of stock status and rebuilding progress, and will be used to calculate annual projected removals according to the HCR.
Table 6. Summary of progress measures and monitoring frequency for each rebuilding plan objective
- Objective 1: SFA 8 Esquiman – Increase biomass to a level above the LRP with a probability of 75%, i.e., to a value greater than 49% of B/BMSY.
- Progress measure: B/BMSY
- Monitoring frequency: At each stock assessment or stock status update by CSAS.
- Progress measure: B/BMSY
- Objective 2: SFA 9 Anticosti – Increase biomass to a level above the LRP with a probability of 75%, i.e., to a value greater than 49% of B/BMSY.
- Progress measure: B/BMSY
- Monitoring frequency: At each stock assessment or stock status update by CSAS.
- Progress measure: B/BMSY
- Objective 3: SFA 10 Sept-Îles – Increase biomass to a level above the LRP with a probability of 75%, i.e., to a value greater than 48% of B/BMSY.
- Progress measure: B/BMSY
- Monitoring frequency: At each stock assessment or stock status update by CSAS.
- Progress measure: B/BMSY
- Objective 4: SFA 8 Esquiman – Achieve a positive stock growth trajectory with a probability of 75% within 5 years.
- Progress measure: B/BMSY
- Monitoring frequency: At each periodic review of the rebuilding plan.
- Progress measure: B/BMSY
- Objective 5: SFA 9 Anticosti – Achieve a positive stock growth trajectory with a probability of 75% within 5 years.
- Progress measure: B/BMSY
- Monitoring frequency: At each periodic review of the rebuilding plan.
- Progress measure: B/BMSY
- Objective 6: SFA 10 Sept-Îles – Achieve a positive stock growth trajectory with a probability of 75% within 5 years.
- Progress measure: B/BMSY
- Monitoring frequency: At each periodic review of the rebuilding plan.
- Progress measure: B/BMSY
- Objective 7: Continue to study the predation of shrimp by groundfish, particularly redfish.
- Progress measure: DFO-approved products and results published (e.g., peer-reviewed CSAS publications)
- Monitoring frequency: According to the groundfish stock assessment schedule.
- Progress measure: DFO-approved products and results published (e.g., peer-reviewed CSAS publications)
- Objective 8: Continue to study the impact of environmental changes on shrimp.
- Progress measure: DFO-approved products and results published (e.g., peer-reviewed CSAS publications)
- Monitoring frequency: 2028 peer review.
- Progress measure: DFO-approved products and results published (e.g., peer-reviewed CSAS publications)
- Objective 9: Advance the stock assessment model to account for the productivity regime shift.
- Progress measure: DFO-approved products and results published (e.g., peer-reviewed CSAS publications)
- Monitoring frequency: One-time, based on the shrimp stock assessment schedule and progress of the work.
- Progress measure: DFO-approved products and results published (e.g., peer-reviewed CSAS publications)
8 Periodic review of the rebuilding plan
The rebuilding plan will be reviewed every five years to determine whether progress has been made toward reaching its objectives and to assess whether adjustments are needed. A five-year interval has been deemed appropriate to evaluate stock performance and the effectiveness of the management measures outlined in the plan. Full stock assessments for these stocks will be conducted every two years. Therefore, by the time of each five-year review, two full assessments will have been completed, providing up-to-date data to support the plan’s revision. A report will be published on DFO’s website following each review.
The first full review of the plan is scheduled for 2030. The analysis of additional data collected over the coming years may improve understanding of current stock productivity and help determine whether the scientific assumptions used to develop the management strategy remain appropriate.
Stakeholder and First Nations participation in the plan’s review will be assessed based on the scope of the revisions required. It is expected that members of the EGSL Shrimp Advisory Committee will be consulted to provide feedback and perspectives, either through targeted engagement or during regular meetings.
The rebuilding plan may be reviewed earlier than the five-year interval in the event of exceptional circumstances, such as when scientific information indicates a major change in stock understanding (e.g., availability of a new peer-reviewed stock assessment model accepted for management purposes, establishment of revised LRPs, etc.).
Stock rebuilding is not always a slow, steady, or predictable process. Stocks may fluctuate and/or remain at low levels for years until conditions support surplus production, leading to rapid population growth. Therefore, a lack of progress toward rebuilding does not necessarily indicate that the plan’s objectives or management measures are inadequate or ineffective.
9 References
Bourdages, H., Marquis, M. C., Nozères, C. and J. Ouellette-Plante (2018). Assessment of northern shrimp stocks in the Estuary and Gulf of St. Lawrence in 2017: data from the research survey (PDF, 17.5 MB), DFO Can. Sci. Advis. Sec. Res. Doc. 2018/057 : 68 p.
Bourdages, H., Roux, M.-J., Marquis, M.-C., Galbraith, P. and Isabel, L. 2022. Assessment of northern shrimp stocks in the Estuary and Gulf of St. Lawrence in 2021: commercial fishery and research survey data (PDF, 68.1 MB). DFO Can. Sci. Advis. Sec. Res. Doc. 2022/027. xv + 197 p.
Bourdages, H., Bourret, A., and G. J. Parent (2023). Delineation of stock assessment units for northern shrimp in the Estuary and northern Gulf of St. Lawrence (PDF, 6.9 MB), DFO Can. Sci. Advis. Sec. Res. Doc. 2023/082 : 30 p.
Bourret, A., Leung, C., Puncher, G., Le Corre, N., Deslauriers, D., Skanes, K., Bourdages, H., Di Cassista Ross, M., Walkusz, W., Jeffery, N. W., Stanley, R. E. E., and Parent, G. J. 2024. Diving into large scale genomics to decipher drivers of structure and climatic vulnerability in a widespread marine shrimp. Molecular Ecology, 33(15), 20 p.
DFO. 2009. A fishery decision-making framework incorporating the precautionary approach. Date modified 2009-03-23.
DFO 2011. Reference points consistent with the precautionary approach for northern shrimp in the Estuary and Gulf of St. Lawrence. DFO Can. Sci. Advis. Sec., Sci. Advis. Rep. 2011/062.
DFO. 2016. Assessment of Northern Shrimp stocks in the Estuary and Gulf of St. Lawrence in 2015 (PDF, 3.1 MB). DFO Can. Sci. Advis. Sec. Res. Doc. 2016/012.
DFO. 2018. Integrated fisheries management plans.
DFO. 2022. Assessment of Northern Shrimp stocks in the Estuary and Gulf of St. Lawrence in 2021. DFO Can. Sci. Advis. Sec. Res. Doc. 2022/006.
DFO. 2023. Review of the Precautionary Approach and Assessment of Northern Shrimp in the Estuary and Gulf of St. Lawrence in 2023. DFO Can. Sci. Advis. Sec. Sci. Resp. 2023/044.
DFO. 2024. Unit 1 Redfish (Sebastes mentella and S. fasciatus) Update in 2023. DFO Can. Sci. Advis. Sec. Sci. Resp. 2024/008.
DFO. 2025. Estuary and Gulf of St. Lawrence Northern Shrimp (Pandalus borealis) Stock Status Update in 2024. DFO Can. Sci. Advis. Sec. Sci. Resp. 2025/002.
Guscelli, E., Noisette, F., Chabot, D., Blier, P.U., Hansen, T., Cassista-Da Ros, M., Pepin, P., Skanes, K.R. et Caliso, P. 2023. Northern shrimp from multiple origins show similar sensitivity to global change drivers, but different cellular energetic capacity. J.Exp. Biol. 226(16).
Lavoie, D., Lambert, N., Rousseau, S., Dumas, J., Chassé, J., Long, Z., Perrie, W., Starr, M., Brickman, D. and Azetsu-Scott, K. 2020. Projections of future physical and biochemical conditions in the Gulf of St. Lawrence, on the Scotian Shelf and in the Gulf of Maine using a regional climate model. Can. Tech. Rep. Hydrogr. Ocean Sci. 334: xiii + 102 p.
Leung, C., Guscelli, E., Chabot, D., Bourret, A., Calosi, P. and Parent, G.J. 2023. The lack of genetic variation underlying thermal transcriptomic plasticity suggests limited adaptability of the Northern shrimp, Pandalus borealis. Front. Ecol. Evol. 11:1125134.
Mormede, S., Duplisea, D.E., Roux, M-J. and Bourdages, H. (in publication) Évaluation du potentiel de rétablissement des stocks de crevette du golfe du Saint-Laurent, Pandalus borealis, dans la zone critique. Secr. Can. Des avis sci. du MPO. Doc. de rech.
MSC. 2024. Acoura Marine Ltd. Trading as LRQA Gulf of St. Lawrence North Shrimp Trawl Fishery MSC Notice of Suspension. July 11,2024. Marine Stewardship Council. Online : https://fisheries.msc.org/en/fisheries/gulf-of-st-lawrence-northern-shrimp-trawl-fishery/@@assessments
Senay, C., Rousseau, S., Brûlé, C., Chavarria, C., Isabel, L., Parent, G.J., Chabot, D., and Duplisea, D. 2023. Unit 1 Redfish (Sebastes mentella and S. fasciatus) stock status in 2021. DFO Can. Sci. Advis. Sec. Res. Doc. 2023/036. xii + 130 p.
Tab 1: Composition of the working group on the rebuilding plan for northern shrimp in the Estuary and Gulf of St. Lawrence (2024-2025)
Representatives of Fisheries and Oceans Canada
- Ali Magassouba – Strategic Services, Quebec Region
- André Drapeau – Resource Management, Quebec Region
- Audrey Morency – Resource Management, Quebec Region
- Charles Brunelle – Strategic Services, Quebec Region
- Danielle Roy – Resource Management, Gulf Region
- Hugo Bourdages – Sciences, Quebec Region
- Magalie Hardy – Resource Management, Quebec Region
- Martin Henri – Resource Management, Newfoundland and Labrador Region
- Stéphanie Labbé-Giguère – Resource Management, Quebec Region
External representatives
- Ann-Julie Côté – ministère de l’Agriculture, des pêcheries et de l’Alimentation du Québec, Quebec
- Benoît St-Onge – Pêcheries UAPAN, Quebec
- Christina Burnsed – Gesgapegiag, Quebec
- Claude Pelletier – New-Brunswick Department of Agriculture, Aquaculture and Fisheries
- Claudio Bernatchez – Association des capitaines-propriétaires de la Gaspésie, Quebec
- Dennis Isaac – Listuguj, Quebec
- Eda Roussel – Association des crevettiers acadiens du golfe, New Brunswick
- Emmanuel Sandt-Duguay – Association de gestion halieutique autochtone Mi’gmaq et Wolastoqey, Quebec
- Eric Polichuck – Gesgapegiag, Quebec
- Evelyne Sigouin –Wolastoqiyik Wahsipekuk First Nation, Quebec
- Gaetan Finn – Association Coopérative des pêcheurs de l’Île, Quebec
- Guy-Pascal Weiner –Wolastoqiyik Wahsipekuk First Nation, Quebec
- Jan Peterson – Metapenagiag (Red Bank), New-Brunswick
- Jean Lanteigne – Fédération régionale acadienne des pêcheurs professionnels, New-Brunswick
- Jeff Griffin – Fish, Food & Allied Workers, Newfoundland and Labrador
- Jérôme Breton – Association des capitaines-propriétaires de la Gaspésie, Quebec
- Johanne Basque – Gespeg, Quebec
- Julie Monger – Association des pêcheurs de la Basse-Côte-Nord, Quebec
- Lewis Clancey – Department of Fisheries and Aquaculture, Nova Scotia
- Patrice Élément – Office des pêcheurs de crevette du Québec, Quebec
- Ralph Heighton – Department of Fisheries and Aquaculture, Nova Scotia
- Renae Butler – Association of Seafood Producers, Newfoundland and Labrador
- Rendell Genge – Fish, Food & Allied Workers, Newfoundland and Labrador
- Serge Fortin – Association Québécoise de l'Industrie de la pêche, Quebec
- Ronald Simonson – Eel River Bar, New-Brunswick
- Samantha Coombs – Department of Fisheries, Forestry and Agriculture, Newfoundland and Labrador
- Stéphane Thériault – Association des crevettiers acadiens du Golfe, New Brunswick
- Tony Miller – Eel River Bar, New-Brunswick
- Vincent Dupuis – Association des capitaines-propriétaires de la Gaspésie, Quebec
- William Ward – Metapenagiag (Red Bank), New Brunswick
- Yan Bourdages – Association des capitaines-propriétaires de la Gaspésie, Quebec
Page details
- Date modified: