
International trade
4.1 Exports
Canadian exports of commercial marine, freshwater and aquaculture products reached a total value of $4.45 billion in 2004, down almost $300 million (6%) from 2002. The notable decrease in farmed Atlantic salmon production and the depreciation of the US dollar vis-à-vis the Canadian dollar between 2002 and 2004 are factors that partially explain the overall decrease in the value of Canadian exports of fish and seafood products in 2004.
| Species | Value of exports ($m) | ||
|---|---|---|---|
| 2002 | 2003 | 2004 | |
| Groundfish | 527 | 513 | 481 |
| Cods, hakes, haddocks | 236 | 216 | 215 |
| Flounders, halibuts, soles | 146 | 155 | 126 |
| Other groundfish | 145 | 141 | 140 |
| Pelagics | 457 | 459 | 535 |
| Herring | 206 | 186 | 174 |
| Salmon (wild) | 169 | 168 | 196 |
| Tunas, swordfish | 29 | 35 | 49 |
| Other pelagics | 53 | 70 | 116 |
| Molluscs and crustaceans | 2,725 | 2,703 | 2,653 |
| Lobster | 1,045 | 1,030 | 952 |
| Snow crab | 678 | 680 | 659 |
| Crab, other | 175 | 182 | 226 |
| Shrimp | 469 | 472 | 438 |
| Scallop, clams | 230 | 204 | 198 |
| Other molluscs and crustaceans | 128 | 136 | 139 |
| Other marine species | 281 | 274 | 276 |
| Freshwater species | 161 | 139 | 132 |
| Farmed salmon | 595 | 444 | 378 |
| Total | 4,746 | 4,532 | 4,455 |
Source: Statistics Canada, International Trade Division.
4.1.1 Exports by species
Molluscs and crustaceans account for the largest share (60%) of the value of Canadian exports of fish and seafood products in 2004 followed by groundfish and pelagic fishes (23%). Farmed Atlantic salmon, freshwater fish and various other marine products made up the remaining 17%.
4.1.2 Major markets
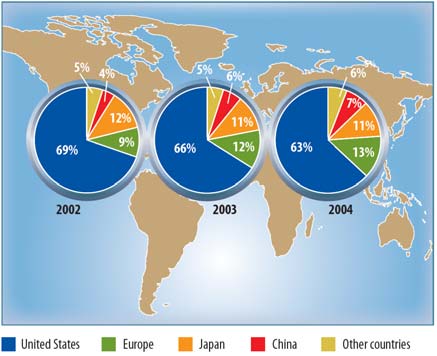
The United States (US) is undoubtedly the main market for Canadian fish and seafood products, particularly lobster, snow crab, groundfish and salmon. Between 2002 and 2004, the US market absorbed, on average, two-thirds of Canadian exports of marine products (based on value). However, some species such as shrimp are exported mainly to Europe and Asia.
Figure 4.1: Evolution of the value of Canadian exports, fish and seafood products, by major markets, 2002-2004

Source: Statistics Canada, International Trade Division.
Between 2002 and 2004, the share of total exports of fish and seafood products from Canada to the United States dipped from 69% to 63%. This is explained primarily by movements in the exchange rate (Figure 4.3), as the Canadian dollar has appreciated considerably versus its US counterpart since 2002. This was not favourable to Canadian exporters and thus, explains to a large degree the drop in the value of exports in 2004, despite the fact that the overall fishing season was good.
Figure 4.2: Share (%) of the value of Canadian exports, by major markets, 2002-2004
Source: Statistics Canada, International Trade Division.
Figure 4.3: Movement of exchange rates between the Canadian dollar and the US dollar, the euro and the japanese yen, 2001-2005

Source: Bank of Canada.
4.2 Imports
The total value of Canadian imports of fish and seafood products was $2.06 billion in 2004, down $124 million (-6%) from 2002. Imports of lobster and shrimp, each falling by $50 million between 2002 and 2004, contributed to this overall decrease.
| Species | Value of imports ($m) | ||
|---|---|---|---|
| 2002 | 2003 | 2004 | |
| Groundfish | 356 | 359 | 322 |
| Cods, hakes, haddocks | 154 | 164 | 140 |
| Halibuts, flounders, sole | 125 | 124 | 116 |
| Other groundfish | 77 | 71 | 66 |
| Pelagics | 334 | 341 | 368 |
| Herring | 16 | 14 | 14 |
| Salmon (wild) | 134 | 166 | 180 |
| Tunas, swordfish | 144 | 123 | 140 |
| Other pelagics | 40 | 38 | 35 |
| Molluscs and crustaceans | 974 | 871 | 887 |
| Lobster | 259 | 225 | 206 |
| Snow crab | 4 | 2 | 10 |
| Crab, other | 51 | 48 | 51 |
| Shrimp | 457 | 390 | 409 |
| callop, clams | 50 | 66 | 61 |
| Other molluscs and crustaceans | 153 | 140 | 150 |
| Other marine species | 433 | 372 | 370 |
| Freshwater species | 56 | 70 | 72 |
| Farmed salmon | 26 | 34 | 36 |
| Total | 2,179 | 2,047 | 2,055 |
Source: Statistics Canada, International Trade Division.
Most Canadian imports of fish and seafood products originate from the United States. Canada imported $876 million (43%) of fish and seafood from its neighbour south of the border in 2004. Nonetheless, this was close to $80 million lower (-8%) than 2002.
Figure 4.4: Evolution of the value of Canadian imports, fish and seafood products, by major markets, 2002-2004

Source: Statistics Canada, International Trade Division.
- Date modified: