
Center of Expertise in Marine Mammology: Scientific Research Report 2012-2014
Table of Contents
- Acknowledgements
- Message from the Director of CEMAM
- The 2013 High Arctic Cetacean Survey
- St. Lawrence Estuary Beluga
- Predator-borne Acoustic Transceivers and GPS Tracking Reveal Encounters with Acoustically Tagged Free-ranging Marine Fish
- Long-term Measures of Reproductive Performance Reveal Marked Variation in Fitness in Grey Seals
- Year-round Atlas of Shipping Noise: The PSSEL Model
- Climate Related Changes in the Quality and Availability of Land Fast Sea Ice Suitable for Breeding Ringed Seals Along the Coast of Labrador
- Belugas and Ringed Seals: Indicators of Ecosystem Change in the Beaufort Sea
- The Impact of Climate Change on Reproduction in an Ice-dependent Species, the Northwest Atlantic Harp Seal
- Publications 2012-2014
Year-round Atlas of Shipping Noise: The PSSEL Model
Yvan Simard, Nathalie Roy, Florian Aulanier, Cédric Gervaise
The main source of anthropogenic noise in ocean is shipping. World shipping has increased at a high rate in both size and number of ships since the 1960s. Because shipping noise is peaking at the low frequencies that propagate over large distances (> 100 km), low-frequency ocean noise is expected to have increased in the northern hemisphere shipping belt, in proportion to world shipping growth and economic activity. The potential adverse effects of increasing underwater noise on marine life and ecosystems have attracted the attention of the scientific community, regulators and the International Maritime Organization.
Numerical modeling and software tools have been proposed to assist in the estimation shipping noise threat for marine organisms, notably using shipping traffic distribution. For instance, accurate maps of shipping noise are needed for marine spatial planning in support of ocean activity regulation. This request may seem straightforward and simple but its proper response for sound management decisions represents a tremendous task (Figure 9). The quality of the response can be judged with: a) the capacity of the modeling to adequately replicate in situ measurements; b) the adequate spatial resolution of the whole modeling process to properly account for the high propagation loss close to the sources and small-scale environmental gradients (i.e. chosen mesh size of inputs and mapping grid); c) the temporal resolution, notably over the annual cycle for seasonally varying environments such as Canadian three-ocean waters; and d) the capacity of providing meaningful metrics for management decisions, such as the complete probability distribution of the values, their temporal breakdown for time budgets, and not only central statistics such as the mean value, which cannot provide the needed proportion of time that critical high levels are encountered.
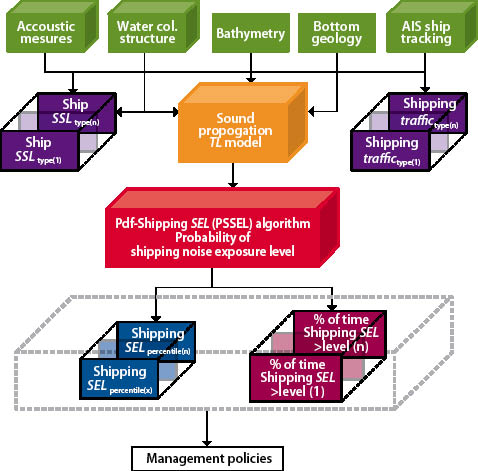
Figure 9. Flowchart of the several steps involved in generating accurate 2D or 3D maps of probability metrics of shipping noise exposure.
Green: raw inputs;
violet: processed input for ship spectral source levels (SSL) and maps of shipping traffic density per ship type;
orange: sound propagation loss model;
red: PSSEL model of probability of shipping noise exposure;
blue: family of maps of the shipping-SEL (SSEL) occurring over selected percentiles of time;
burgundy: family of maps the percentage of time selected SSELs are exceeded.
The ongoing probabilistic shipping sound exposure level (PSSEL) project was launched in 2012 to develop a new shipping noise modeling and mapping approach to provide adequate and efficient tools to respond to the above needs for assessing conditions presently prevailing in Canadian waters and expected in the near future with increasing shipping activities, notably along projected new routes in Canadian Arctic and Subarctic.
The St. Lawrence Seaway in the ~300-m deep Lower St. Lawrence Estuary (Figure 11), where several marine mammals are encountered year-round or seasonally, is taken as pilot region for developing the PSSEL model. An underwater acoustic observatory called AS4 (for Acoustic Surveillance of Seaway and Ship Signatures) was deployed along the in-going lane of the St. Lawrence Seaway rail (Figure 11) and operated for one year in 2012-2013 to measure ship spectral source levels (SSL) of the present merchant fleet, following ANSI protocol (Figure 9, left violet box). The shipping traffic was monitored from the Canadian Coast Guard networks of AIS (Automatic Identification System) antennae deployed in southern Canadian waters (Figure 11) for 12 months in 2013, which provided the ship characteristics and their locations with high resolutions in time and space (Figure 10). These AIS data were used to compute a year-round shipping traffic atlas per ship type, length and speed with a monthly scale (Figure 9, right violet box). Both shipping traffic density and SSL data bank are feeding the PSSEL modeling. The third and last input to the PSSEL model is the acoustic propagation loss from the sources (i.e. ships), which can come from the output of one of several simple or complex propagation models that are fed with the characteristics of the propagation medium, with its bathymetry and bottom geological structure (Fig. 9, orange box).
Preliminary results of the PSSEL model applied to the 2013 summer traffic in the Lower St. Lawrence Estuary illustrate the importance of taking into account the complete probability of the shipping sound exposure level (SSEL) to assess the shipping noise and its impact on marine life. As a corollary, it illustrates the low relevance of central metrics averaged over long periods and coarse grids for realising such a task. Maps of the percentage of time the SSEL exceeds given levels, which the PSSEL model algorithm is able to efficiently compute, appear very helpful to rapidly assess the hottest and coldest areas in marine spatial planning. The PSSEL model was used in forecasting mode to simulate a traffic increase with a realistic traffic composition for the pilot area. Such simulations are in the process of implementation for expected new routes in Canadian Arctic and Subarctic.
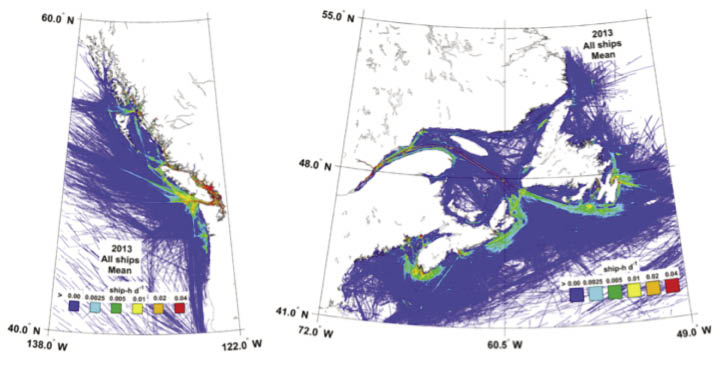
Figure 10. Examples of 1-km resolution AIS shipping traffic maps for 2013 on Western and Eastern Canadian waters (from Simard et al. 2014b, c).
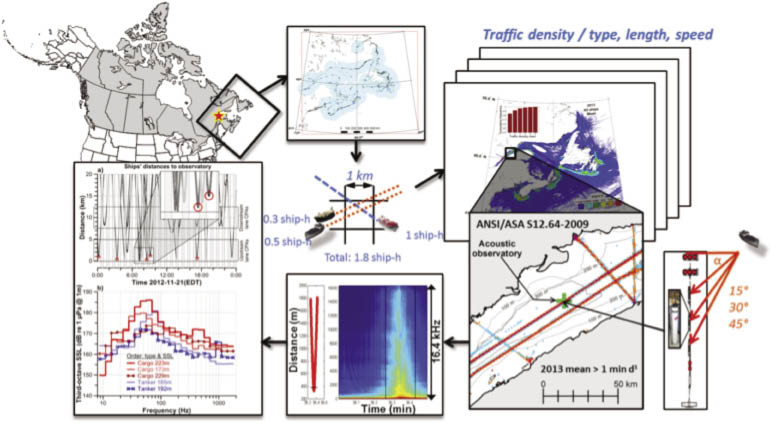
Figure 11. Example of the computation flowchart of the ANSI third-octave SSL for 5 isolated ships crossing the AS4 acoustic observatory in St. Lawrence Seaway off DFO-MLI on 21 November 2012 and respecting the imposed conditions.
- Date modified: