
Regulating and monitoring British Columbia’s marine finfish aquaculture facilities - 2019
Table of Contents
- Marine finfish aquaculture in British Columbia
- Reporting requirements
- Monitoring and audits
- Looking forward - 2019 and beyond
- Important web links
Marine finfish aquaculture in British Columbia
Locations of marine finfish aquaculture facilities
Marine finfish aquaculture facilities are mainly located around northern and western Vancouver Island. There are clusters of sites in several areas, such as Clayoquot Sound, the Port Hardy area, the Broughton Archipelago, and the Discovery Islands. All marine finfish aquaculture facilities with a valid licence as of December 31, 2019 are shown in the map on the following page.
Marine finfish species cultivated in BC
Most marine finfish aquaculture licences are issued for salmon, with Atlantic salmon (Salmo salar) and Chinook salmon (Oncorhynchus tshawytscha) being the most commonly farmed fish in BC. Some other species, such as sablefish (Anoplopoma fimbria), are also cultivated on a smaller scale. Atlantic salmon is the preferred species for cold water marine finfish cultivation around the world because these fish feed well on pellets, are efficient at converting food to body mass, grow quickly, and are well adapted to the confines of a net pen.
Share of production biomass by species
- Atlantic Salmon 96.7%
- Chinook Salmon 2.7%
- Sablefish 0.6%
How fish farming is regulated in Canada
Fish farming is jointly managed between federal, provincial and territorial governments. How it’s managed varies across provinces and territories.
Across Canada, fish farming is managed sustainably under the Fisheries Act. Federal partners work together to make sure fish are healthy and safe to eat.
| BC | PEI | Rest of Canada | |
|---|---|---|---|
| Site Approval | Shared | Shared | Provincial |
| Land Management | Provincial | Federal | Provincial |
| Day-to-day Operations and Oversight | Federal | Federal | Provincial |
| Introductions & Transfers | Shared | Shared | Shared |
| Drugs & Pesticide Approvals | Shared | Shared | Shared |
| Food Safety | Federal | Federal | Federal |
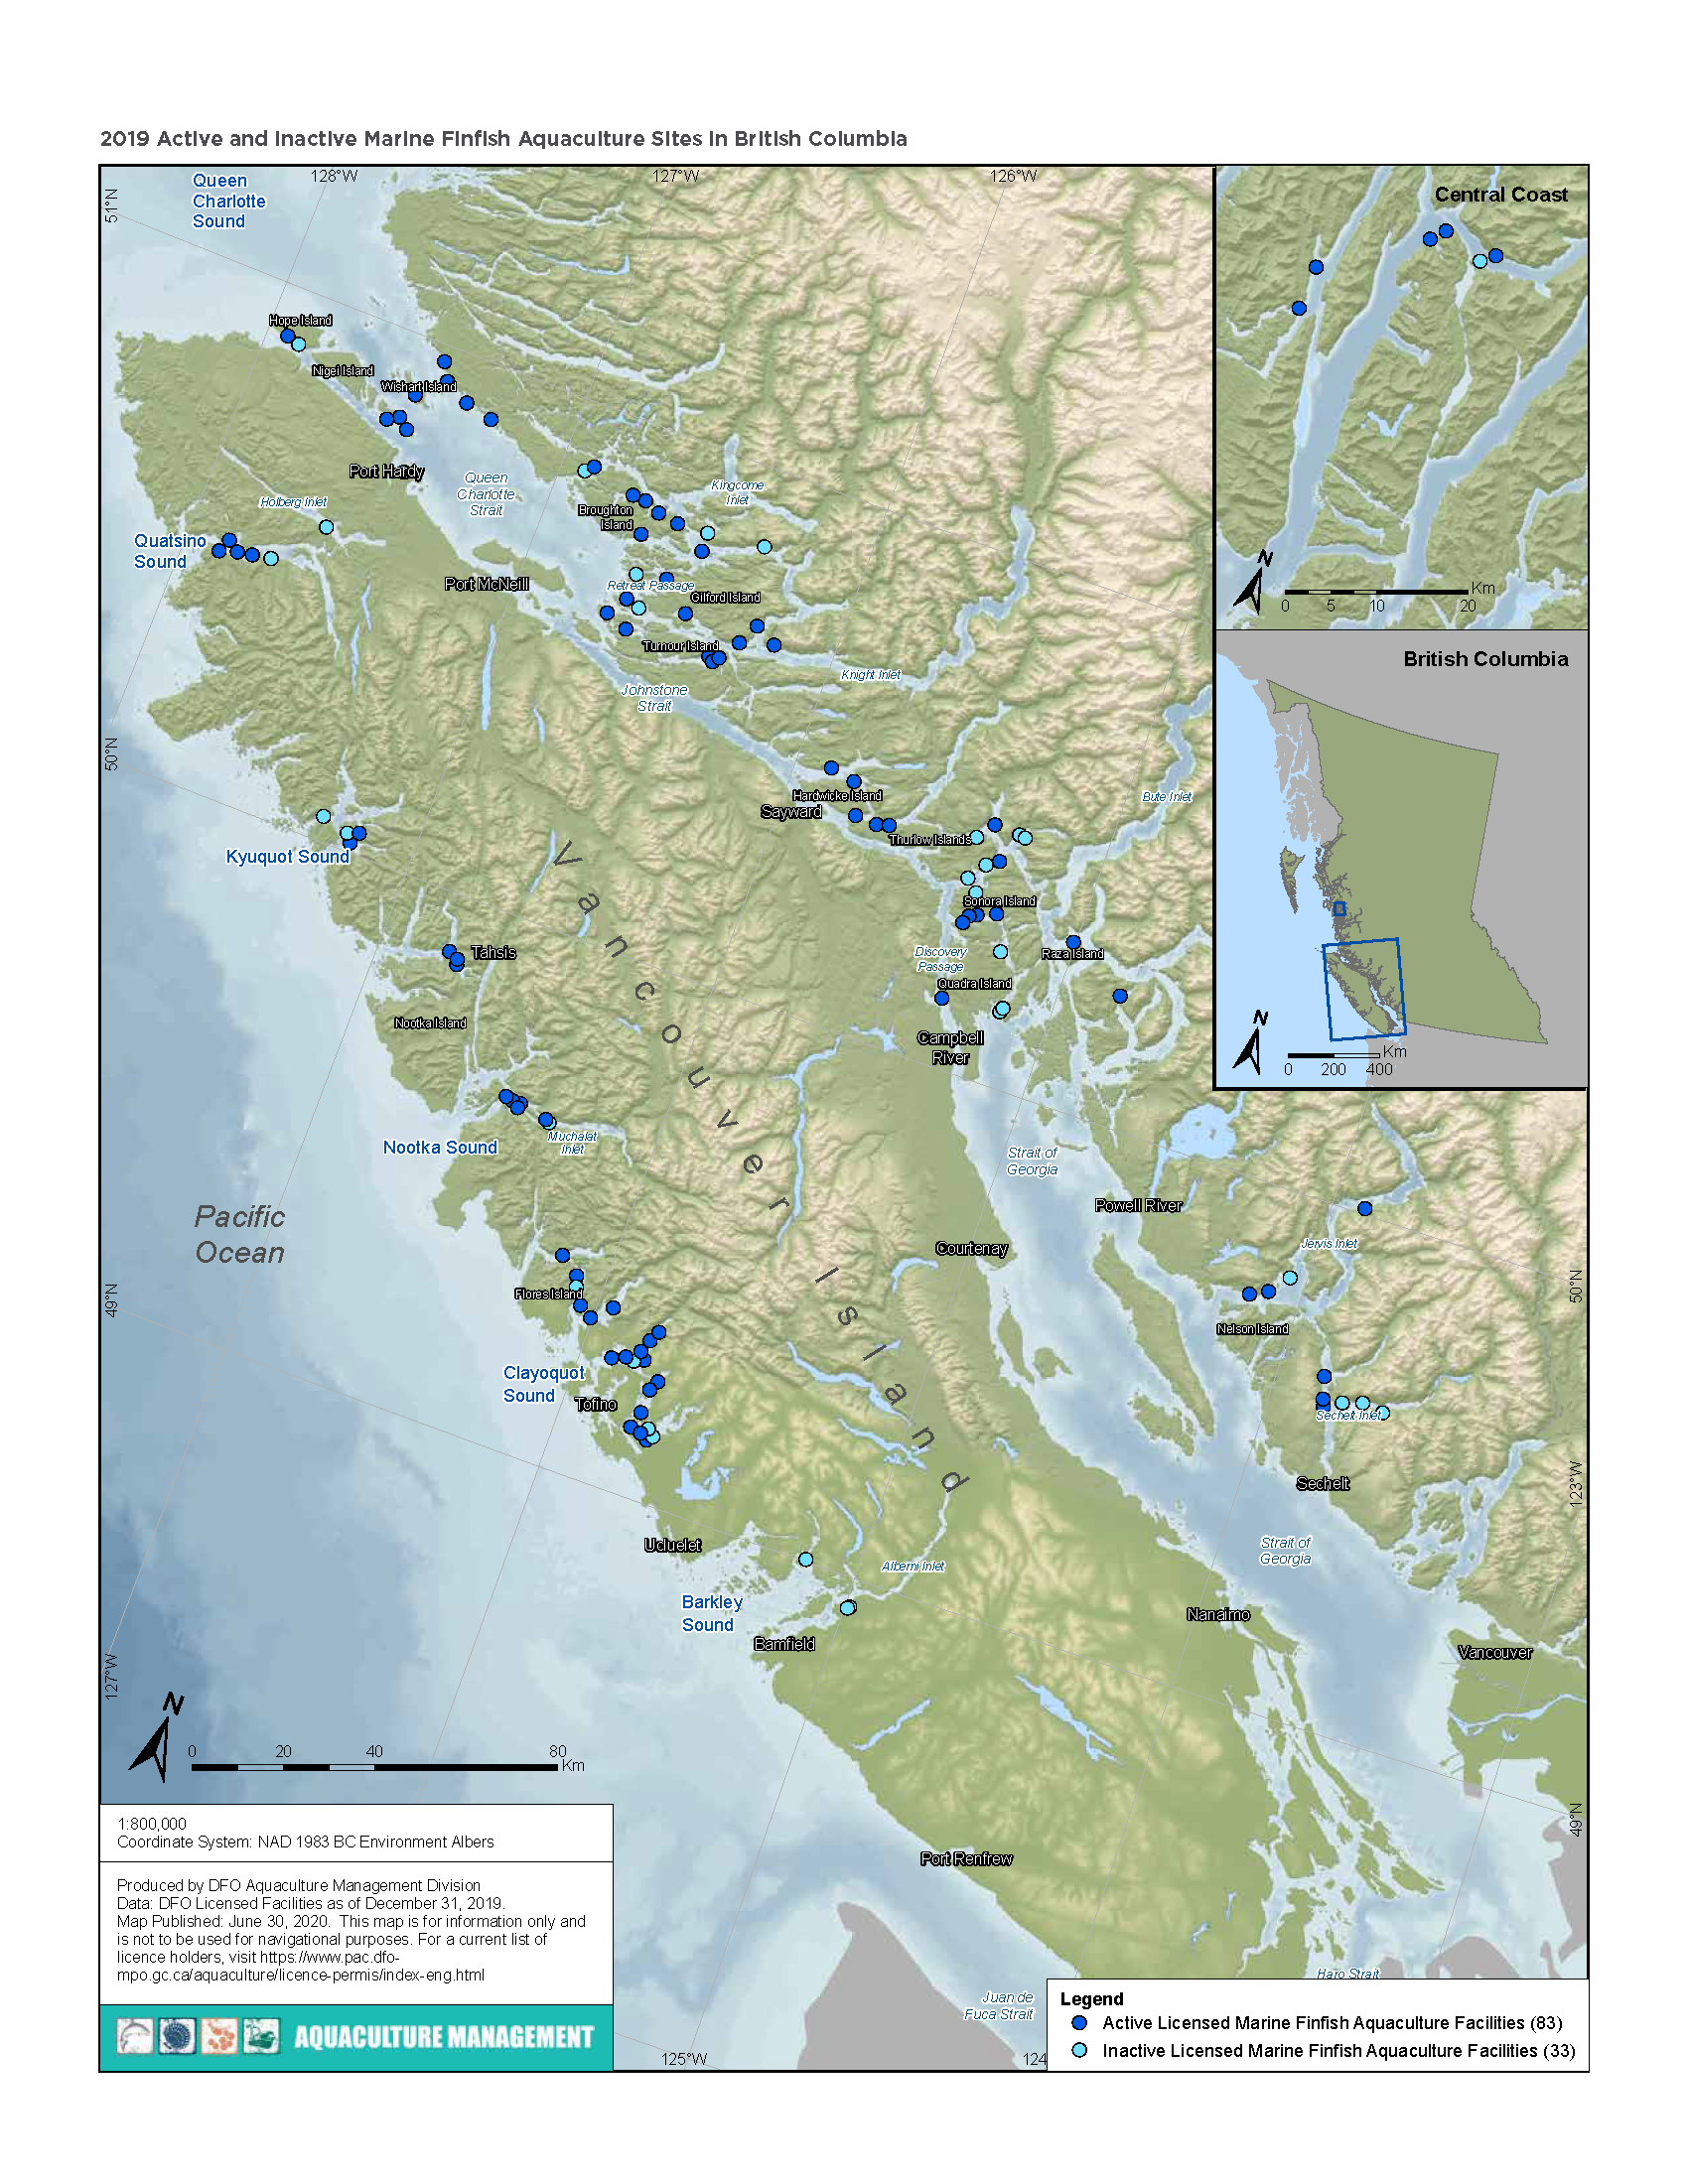
2019 active and inactive marine finfish aquaculture sites in British Columbia
Long text version of map
2019 marine finfish aquaculture facilities in British Columbia
1:800,000
Coordinate system: NAD 1983 BC Environment Albers.
Produced by DFO Aquaculture Management Division.
Data: DFO licensed facilities as of December 31, 2019.
Map published: June 30, 2020.
This map is for information only and is not to be used for navigational purposes.
For current list of licence holders, visit Aquaculture licensing in British Columbia.
Legend
83 active licensed marine finfish aquaculture facilities
33 inactive licensed marine finfish aquaculture facilities
| Facility reference number | Licence holder | Facility common name | Latitude | Longitude | Fish health zone | 2018 production status |
|---|---|---|---|---|---|---|
| 1698 | Grieg Seafood BC | Ahlstrom | 49.7793 | -124.15395 | 3.1 | Active |
| 7714 | MOWI Canada West | Alexander | 52.67648 | -128.57494 | 3.5 | Active |
| 1300 | MOWI Canada West | Althorpe | 50.47531 | -125.80975 | 3.2 | Active |
| 466 | MOWI Canada West | Arrow Pass | 50.70973 | -126.662 | 3.3 | Fallow |
| 1738 | Grieg Seafood BC | Atrevida | 49.65603 | -126.45404 | 2.4 | Active |
| 1537 | Cermaq Canada | Bare Bluff | 49.32702 | -125.79902 | 2.3 | Active |
| 169 | Cermaq Canada | Barkley | 48.9431 | -124.98704 | 2.3 | Fallow |
| 871 | Grieg Seafood BC | Barnes Bay | 50.32437 | -125.26039 | 3.2 | Active |
| 227 | Cermaq Canada | Bawden | 49.30798 | -126.00721 | 2.3 | Active |
| 776 | Creative Salmon Company | Baxter Islets | 49.13299 | -125.78289 | 2.3 | Active |
| 520 | Cermaq Canada | Bedwell | 49.26548 | -125.81247 | 2.3 | Active |
| 892 | MOWI Canada West | Bell Island | 50.83242 | -127.52057 | 3.4 | Active |
| 377 | MOWI Canada West | Bickley Bay | 50.45308 | -125.39642 | 3.2 | Fallow |
| 1148 | Cermaq Canada | Binns Island | 49.34182 | -125.95328 | 2.3 | Active |
| 1401 | Cermaq Canada | Brent Island | 50.28613 | -125.34917 | 3.2 | Active |
| 388 | MOWI Canada West | Brougham Point | 50.37192 | -125.3799 | 3.2 | Fallow |
| 1144 | Cermaq Canada | Burdwood | 50.7969 | -126.49581 | 3.3 | Active |
| 819 | Cermaq Canada | Cecil Island | 50.85123 | -126.71498 | 3.3 | Active |
| 112 | Golden Eagle Sable Fish | Centre Cove | 50.01736 | -127.19165 | 2.4 | Active |
| 790 | MOWI Canada West | Chancellor Channel | 50.41723 | -125.66284 | 3.2 | Active |
| 1554 | Golden Eagle Sable Fish | Charlie's Place | 50.04149 | -127.17617 | 2.4 | Active |
| 1376 | MOWI Canada West | Cleagh Creek | 50.48224 | -127.73243 | 2.4 | Fallow |
| 136 | Cermaq Canada | Cliff Bay | 50.83433 | -126.499 | 3.3 | Fallow |
| 1789 | Grieg Seafood BC | Concepcion | 49.65923 | -126.47587 | 2.4 | Active |
| 753 | Mainstream Canada | Cormorant | 49.25719 | -125.9244 | 2.3 | Fallow |
| 7713 | MOWI Canada West | Cougar | 52.71993 | -128.57432 | 3.5 | Active |
| 1697 | Grieg Seafood BC | Culloden | 49.79595 | -124.10162 | 3.1 | Active |
| 458 | Cermaq Canada | Cypress Harbour | 50.83772 | -126.66313 | 3.3 | Active |
| 733 | MOWI Canada West | Cyrus Rock | 50.25682 | -125.2103 | 3.2 | Fallow |
| 1596 | Creative Salmon Company | Dawley Pass | 49.16641 | -125.7686 | 2.3 | Active |
| 234 | Cermaq Canada | Dixon Bay | 49.40478 | -126.15072 | 2.3 | Active |
| 456 | Saltstream Engineering | Doctor Bay | 50.2521 | -124.81957 | 3.2 | Active |
| 1586 | MOWI Canada West | Doctor Islets | 50.65373 | -126.28925 | 3.3 | Active |
| 1288 | MOWI Canada West | Doyle Island | 50.81456 | -127.48698 | 3.4 | Active |
| 1293 | MOWI Canada West | Duncan Island | 50.8195 | -127.55568 | 3.4 | Active |
| 138 | MOWI Canada West | Dunsterville | 50.14512 | -125.15171 | 3.2 | Fallow |
| 244 | Creative Salmon Company | Eagle Bay | 49.12945 | -125.71093 | 2.3 | Fallow |
| 1167 | MOWI Canada West | Egerton Creek | 50.48351 | -125.25508 | 3.2 | Fallow |
| 1863 | Grieg Seafood BC | Esperanza | 49.87814 | -126.76145 | 2.4 | Active |
| 1164 | MOWI Canada West | Far Side | 50.48576 | -125.27429 | 3.2 | Fallow |
| 540 | Cermaq Canada | Fortune Channel | 49.23503 | -125.75174 | 2.3 | Active |
| 7053 | MOWI Canada West | Ghi ya | 50.90078 | -127.93638 | 3.4 | Active |
| 303 | MOWI Canada West | Glacial Creek | 50.01008 | -123.90241 | 3.1 | Active |
| 821 | MOWI Canada West | Glacier Falls | 50.84785 | -126.31921 | 3.3 | Fallow |
| 1702 | MOWI Canada West | Goat Cove | 52.78726 | -128.4199 | 3.5 | Active |
| 1762 | Grieg Seafood BC | Gore | 49.6466 | -126.43167 | 2.4 | Active |
| 1581 | MOWI Canada West | Hardwicke | 50.41339 | -125.76974 | 3.2 | Active |
| 706 | MOWI Canada West | Hardy Bay | 50.73446 | -127.44641 | 3.4 | Fallow |
| 7054 | MOWI Canada West | Heath Bay (Wanx talis) | 50.89322 | -127.896 | 3.4 | Fallow |
| 1862 | Grieg Seafood BC | Hecate | 49.86799 | -126.7573 | 2.4 | Active |
| 1158 | MOWI Canada West | Hohoae Island | 50.0335 | -127.21019 | 2.4 | Fallow |
| 1618 | MOWI Canada West | Humphrey Rock | 50.69682 | -126.25532 | 3.3 | Active |
| 233 | Creative Salmon Company | Indian Bay | 49.11916 | -125.72549 | 2.3 | Active |
| 270 | Omega Pacific | Jane Bay | 49.00306 | -125.15692 | 2.3 | Fallow |
| 1691 | MOWI Canada West | Kid Bay | 52.80048 | -128.40111 | 3.5 | Active |
| 144 | MOWI Canada West | Koskimo | 50.45861 | -127.88988 | 2.4 | Active |
| 408 | Grieg Seafood BC | Kunechin | 49.6339 | -123.78337 | 3.1 | Fallow |
| 143 | MOWI Canada West | Larsen Island | 50.60175 | -126.63284 | 3.3 | Active |
| 100 | MOWI Canada West | Lees Bay | 50.41063 | -125.70029 | 3.2 | Active |
| 1896 | MOWI Canada West | Lime Point | 52.78538 | -128.33133 | 3.5 | Fallow |
| 1338 | MOWI Canada West | Mahatta East | 50.4746 | -127.78758 | 2.4 | Active |
| 1238 | MOWI Canada West | Mahatta West | 50.469 | -127.83538 | 2.4 | Active |
| 1351 | MOWI Canada West | Marsh Bay | 50.90567 | -127.34239 | 3.4 | Active |
| 869 | Cermaq Canada | Maude Island | 50.85271 | -126.75743 | 3.3 | Active |
| 1419 | Creative Salmon Company | McCall Islets | 49.14146 | -125.73122 | 2.3 | Fallow |
| 1291 | Cermaq Canada | McIntyre Lake | 49.30557 | -125.81583 | 2.3 | Active |
| 467 | MOWI Canada West | Midsummer | 50.65784 | -126.66298 | 3.3 | Active |
| 1507 | Cermaq Canada | Millar Channel | 49.37622 | -126.09003 | 2.3 | Active |
| 1237 | MOWI Canada West | Monday Rocks | 50.48588 | -127.87584 | 2.4 | Active |
| 1849 | Grieg Seafood BC | Muchalat North | 49.64394 | -126.33953 | 2.4 | Active |
| 1700 | Grieg Seafood BC | Muchalat South | 49.64012 | -126.32735 | 2.4 | Fallow |
| 543 | Cermaq Canada | Mussel Rock | 49.25925 | -125.86762 | 2.3 | Active |
| 572 | Grieg Seafood BC | Newcomb | 49.64006 | -123.65836 | 3.1 | Fallow |
| 1825 | Grieg Seafood BC | Noo-la | 50.60799 | -126.36301 | 3.3 | Active |
| 211 | MOWI Canada West | Okisollo | 50.30946 | -125.31618 | 3.2 | Active |
| 78 | MOWI Canada West | Phillips Arm | 50.48825 | -125.35658 | 3.2 | Active |
| 6668 | Cermaq Canada | Plover Point | 49.21433 | -125.76693 | 2.3 | Active |
| 141 | MOWI Canada West | Port Elizabeth | 50.67099 | -126.47653 | 3.3 | Active |
| 1145 | MOWI Canada West | Potts Bay | 50.6492 | -126.6182 | 3.3 | Fallow |
| 526 | Cermaq Canada | Rant Point | 49.2567 | -125.84153 | 2.3 | Fallow |
| 1198 | MOWI Canada West | Raynor | 50.89253 | -127.25359 | 3.4 | Active |
| 304 | Cermaq Canada | Raza Island | 50.32159 | -125.00882 | 3.2 | Active |
| 547 | MOWI Canada West | Read Island | 50.15363 | -125.14656 | 3.2 | Fallow |
| 1382 | MOWI Canada West | Robertson | 50.93155 | -127.42258 | 3.4 | Active |
| 314 | Cermaq Canada | Ross Pass | 49.32437 | -126.04849 | 2.3 | Active |
| 332 | Grieg Seafood BC | Salten | 49.61535 | -123.83407 | 3.1 | Active |
| 224 | Cermaq Canada | San Mateo | 48.93938 | -124.99239 | 2.3 | Fallow |
| 527 | Cermaq Canada | Saranac Island | 49.24803 | -125.90671 | 2.3 | Active |
| 1059 | MOWI Canada West | Sargeaunt Pass | 50.67346 | -126.18595 | 3.3 | Active |
| 1136 | MOWI Canada West | Shaw Point | 50.48527 | -125.88981 | 3.2 | Active |
| 1895 | MOWI Canada West | Sheep Passage | 52.79609 | -128.31093 | 3.5 | Active |
| 1350 | MOWI Canada West | Shelter Bay | 50.96555 | -127.45345 | 3.4 | Active |
| 831 | MOWI Canada West | Shelter Pass | 50.88414 | -127.5004 | 3.4 | Active |
| 1336 | Cermaq Canada | Simmonds Point | 50.87791 | -126.90153 | 3.4 | Active |
| 728 | Cermaq Canada | Sir Edmund Bay | 50.83096 | -126.59684 | 3.3 | Active |
| 746 | Grieg Seafood BC | Site 13 | 49.6291 | -123.84265 | 3.1 | Active |
| 412 | Grieg Seafood BC | Site 9 | 49.64612 | -123.72455 | 3.1 | Fallow |
| 380 | MOWI Canada West | Sonora Point | 50.42362 | -125.30517 | 3.2 | Active |
| 247 | Totem Sea Farm Inc. | St. Vincent Bay | 49.83487 | -124.05292 | 3.1 | Fallow |
| 1079 | Grieg Seafood BC | Steamer | 49.8868 | -126.7911 | 2.4 | Active |
| 1872 | Kyuquot Seafoods | Surprise Island | 50.04707 | -127.29662 | 2.4 | Fallow |
| 465 | MOWI Canada West | Swanson | 50.61871 | -126.70473 | 3.3 | Active |
| 1299 | MOWI Canada West | Thorpe Point | 50.57888 | -127.6087 | 2.4 | Fallow |
| 378 | MOWI Canada West | Thurlow | 50.40808 | -125.34088 | 3.2 | Fallow |
| 7273 | Grieg Seafood BC | Tsa-ya | 50.61225 | -126.33212 | 3.3 | Active |
| 739 | MOWI Canada West | Upper Retreat | 50.72183 | -126.5681 | 3.3 | Active |
| 221 | Grieg Seafood BC | Vantage | 49.67226 | -123.86019 | 3.1 | Active |
| 306 | Cermaq Canada | Venture Point | 50.30241 | -125.33778 | 3.2 | Active |
| 1839 | Grieg Seafood BC | Wa-kwa | 50.60106 | -126.34741 | 3.3 | Active |
| 7054 | MOWI Canada West | Wanx talis | 50.89322 | -127.89568 | 3.4 | Active |
| 1899 | Creative Salmon Company | Warne Island | 49.12815 | -125.74923 | 2.3 | Active |
| 1335 | Cermaq Canada | Wehlis Bay | 50.8641 | -126.92374 | 3.4 | Fallow |
| 1472 | Cermaq Canada | West Side | 49.27928 | -125.83065 | 2.3 | Active |
| 820 | MOWI Canada West | Wicklow Point | 50.78659 | -126.69153 | 3.3 | Active |
| 1705 | Grieg Seafood BC | Williamson | 49.65623 | -126.42849 | 2.4 | Active |
| 7114 | Cermaq Canada | Yaakswiis | 49.35577 | -126.07951 | 2.3 | Fallow |
| 216 | Yellow Island Aquaculture | Yellow Island | 50.13274 | -125.33268 | 3.2 | Active |
| 769 | MOWI Canada West | Young Pass | 50.35014 | -125.34217 | 3.2 | Fallow |
Reporting requirements
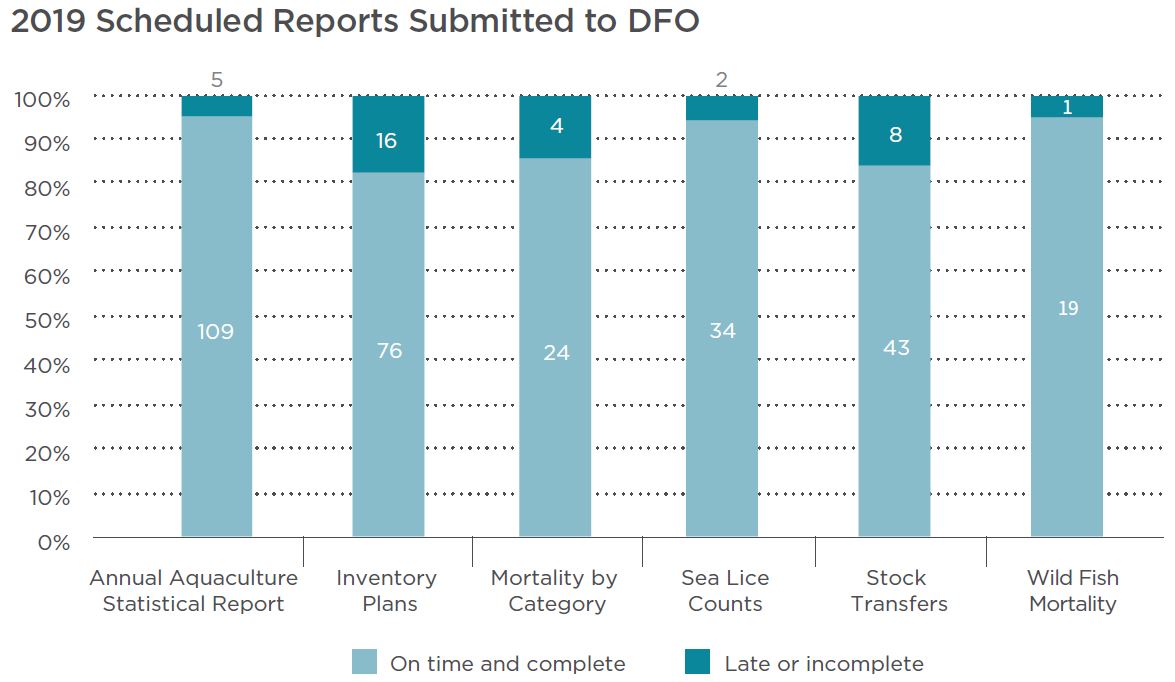
Under the Pacific Aquaculture Regulations and the Aquaculture Activities Regulations, licence holders are required to submit reports to Fisheries and Oceans Canada (DFO) that fall into two broad categories: scheduled reports and event-based reports. All reports are reviewed by DFO to validate content, to ensure that they contain all elements required by the licence conditions, and to determine if they were submitted on time. When a report contains only minor administrative omissions or errors and the licence holder corrects these in a timely manner, the reports may be considered complete and on time.
2019 Scheduled reports submitted to DFO
Long text version
| Report | On time and complete | Late or incomplete |
|---|---|---|
| Annual aquaculture statistical report | 109 | 5 |
| Inventory plans | 76 | 16 |
| Mortality by category | 24 | 4 |
| Sea lice counts | 34 | 2 |
| Stock transfers | 43 | 8 |
| Wild fish mortality | 19 | 1 |
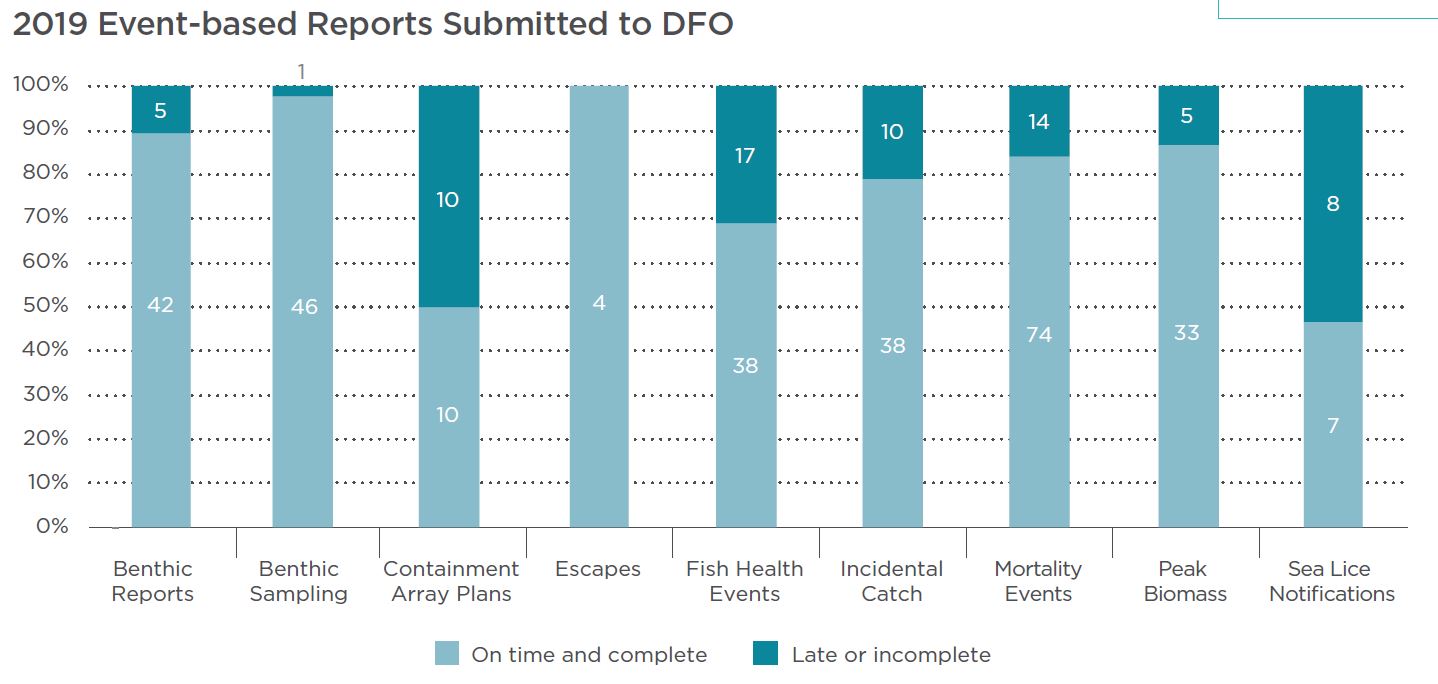
2019 Event-based reports submitted to DFO
Long text version
| Report | On time and complete | Late or incomplete |
|---|---|---|
| Benthic reports | 42 | 5 |
| Benthic sampling | 46 | 1 |
| Containment array plans | 10 | 10 |
| Escapes | 4 | 0 |
| Fish health events | 38 | 17 |
| Incidental catch | 38 | 10 |
| Mortality events | 74 | 14 |
| Peak biomass | 33 | 5 |
| Sea lice notifications | 7 | 8 |
Monitoring and audits
What happens during a fish health audit
DFO requires operators of marine salmon farms to follow strict measures to keep fish healthy and conducts routine, random site inspections to ensure compliance.
In BC, farm operators must follow a DFO-approved Health Management Plan (HMP). This plan outlines how the farm will manage biosecurity, water quality, medication treatment, and other measures to maximize fish health. Industry must monitor the health of their fish and report their findings to DFO.
- Sampling and observation: A team of 2 or 3 DFO biologists spend about 4 hours on each site. Auditors observe fish in each pen, noting any behaviour or signs that might indicate poor health, such as slow or abnormal swimming or visible abnormalities. They then select up to 10 recently deceased fish (called “silvers”) for sampling.
- Tissue collection: Tissue samples are taken on site and then sent to a laboratory accredited by the Standards Council of Canada and the American Association of Veterinary Laboratory Diagnosticians.
- Lab analysis: The lab analyzes samples for specific bacteria and viruses, and health conditions of concern, including infectious salmon anaemia virus (ISA), Infectious Hematopoietic Necrosis virus (IHNv), and heart and skeletal muscle inflammation (HSMI).
- Review and publish results: Results are reviewed by DFO veterinarians and reported on DFO’s website
Certain serious infectious diseases, such as ISA and IHNv, are listed under the Health of Animals Act. If found, they must be reported immediately to the Canadian Food Inspection Agency, which investigates and develops a plan to prevent the disease from spreading.
How DFO inspects fish health at BC aquaculture sites
Auditors use a checklist of 60 items to ensure a farm is operating as licensed and following its HMP. Any deficiencies are noted and reviewed with the farm operator so that improvements can be made. Non-compliance with the HMP may result in further investigation and possible charges.
- Fish behaviour and health are monitored
- Water quality is monitored routinely and can be addressed if needed
- Biosecurity protocols such as equipment disinfection, visitor restriction and the use of footbaths, are followed
- Collection and classification of deceased fish is frequent and acceptable
- Feed, nutrition and medication records are complete and up-to-date
Results are reviewed by DFO veterinarians and reported on DFO’s website
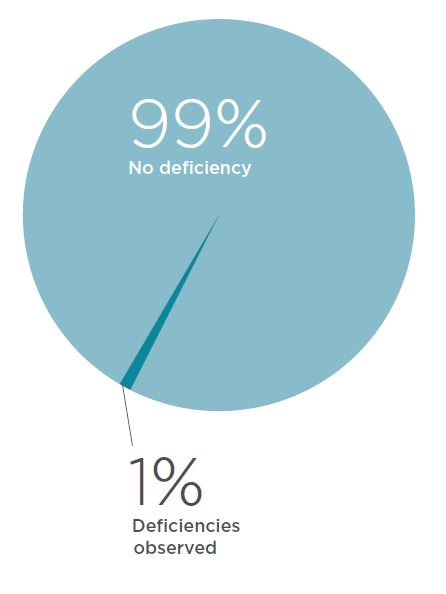
2019 DFO fish health management plan inspections
This figure summarizes the 33 deficiencies observed during Fish Health Management Plan inspections by DFO in 2019. A total of 119 Health Management Plan (HMP) inspections were completed. These deficiencies may not be determined to be “non-compliant”, they just need some corrective actions or improvement.
Long text version
| No deficiency | 99% |
|---|---|
| Deficiencies observed | 1% |
- Carcass retrieval protocol or record keeping needs improvement (12)
- Current licence was not posted at facility (2)
- Disease contingency or mass mortality information or records needs improvement (1)
- Fish handling, euthanasia protocol or records (1)
- Footbaths or sanitizers needs improvement (2)
- Husbandry or related record keeping needs improvement (2)
- Lice protocol or lice records needs improvement (9)
- Mooring signage needs improvement (2)
- Nutritional or medicated feed protocol concerns (1)
- Transfer records are not complete or up-to-date (1)
Industry reported events
Fish Health and Mortality Events are reported by industry when they occur, as well as any mitigation or treatment response. DFO reviews whether the conclusions are reasonable and assesses the response against the HMPs and Standard Operating Procedures for the farm site. If there are concerns with the report or event, DFO will attempt to resolve the issue by engaging with the industry veterinarians and, if necessary, will prioritize the facility for a targeted audit.
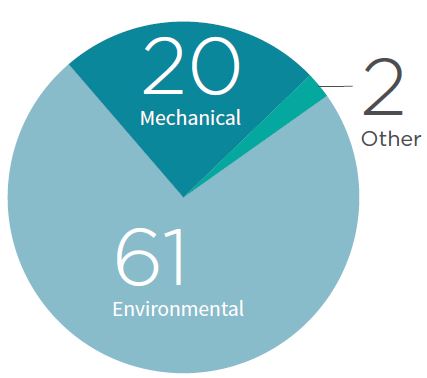
2019 Mortality events
This figure summarizes mortality events as reported by industry for active facilities in 2019.
A Mortality Event occurs if the amount of dead fish at a marine finfish aquaculture facility exceeds thresholds outlined in conditions of licence. Environmental events include mortalities caused by naturally occurring conditions such as such as harmful algae blooms or low oxygen. Mechanical events describe mortalities resulting from stressful procedures such as transport, harvest or treatments.
Long text version
| Environmental | 61 |
|---|---|
| Mechanical | 20 |
| Other | 2 |
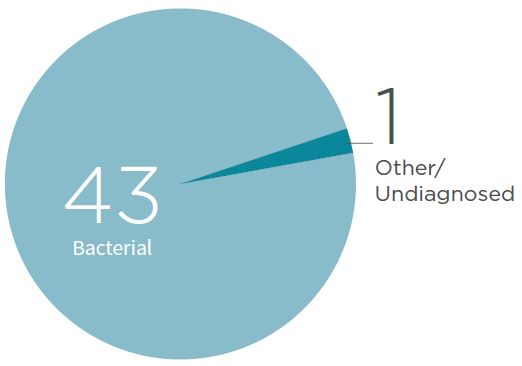
2019 Fish health events
This figure summarizes Fish Health Events as reported by industry for active facilities.
A Fish Health Event is any suspected or active disease that occurs within an aquaculture facility that requires the involvement of a veterinarian and warrants mitigation measures. Bacterial events are the result of easily treatable diseases caused by naturally occuring bacteria.
Long text version
| Bacterial | 43 |
|---|---|
| Other/undiagnosed | 1 |
Fish health
Sea lice
Minimizing sea lice levels on farms is a critical component of sustainable aquaculture management. DFO manages this through mandatory monitoring, mitigation, treatment and reporting, as well as audits/ inspections to ensure compliance. DFO assesses sea lice abundance on farmed salmon and verifies the accuracy of industry submitted data. This provides DFO with timely information regarding the operational performance and compliance of aquaculture facilities.
Licence holders must count sea lice at active Atlantic salmon facilities throughout the year. Counting sea lice occurs monthly from July to February, and every two weeks from March 1 to June 30 when wild salmon smolts out-migrate. The licence holder must report to DFO within seven days if the average number of motile Lepeophtheirus salmonis (a species of sea lice) exceeds three sea lice per fish during the wild salmon outmigration period.
Sea lice abundance exceedances over the threshold have been relatively infrequent since 2011. Recently, there have been some areas where sea lice threshold exceedances have become more common. In response to this, as part of an adaptive management approach, DFO is examining its current sea lice Conditions of Licence (COL) with a view to changing the conditions in 2020 prior to the wild salmon outmigration window. These proposed changes intend to create greater enforceability and clarity, and require additional monitoring and reporting throughout the year. A number of additional enhancements to COLs are being considered for 2022 to advance Area-based Aquaculture Management (ABAM) in consultation with First Nations, industry, and environmental non-governmental organizations.
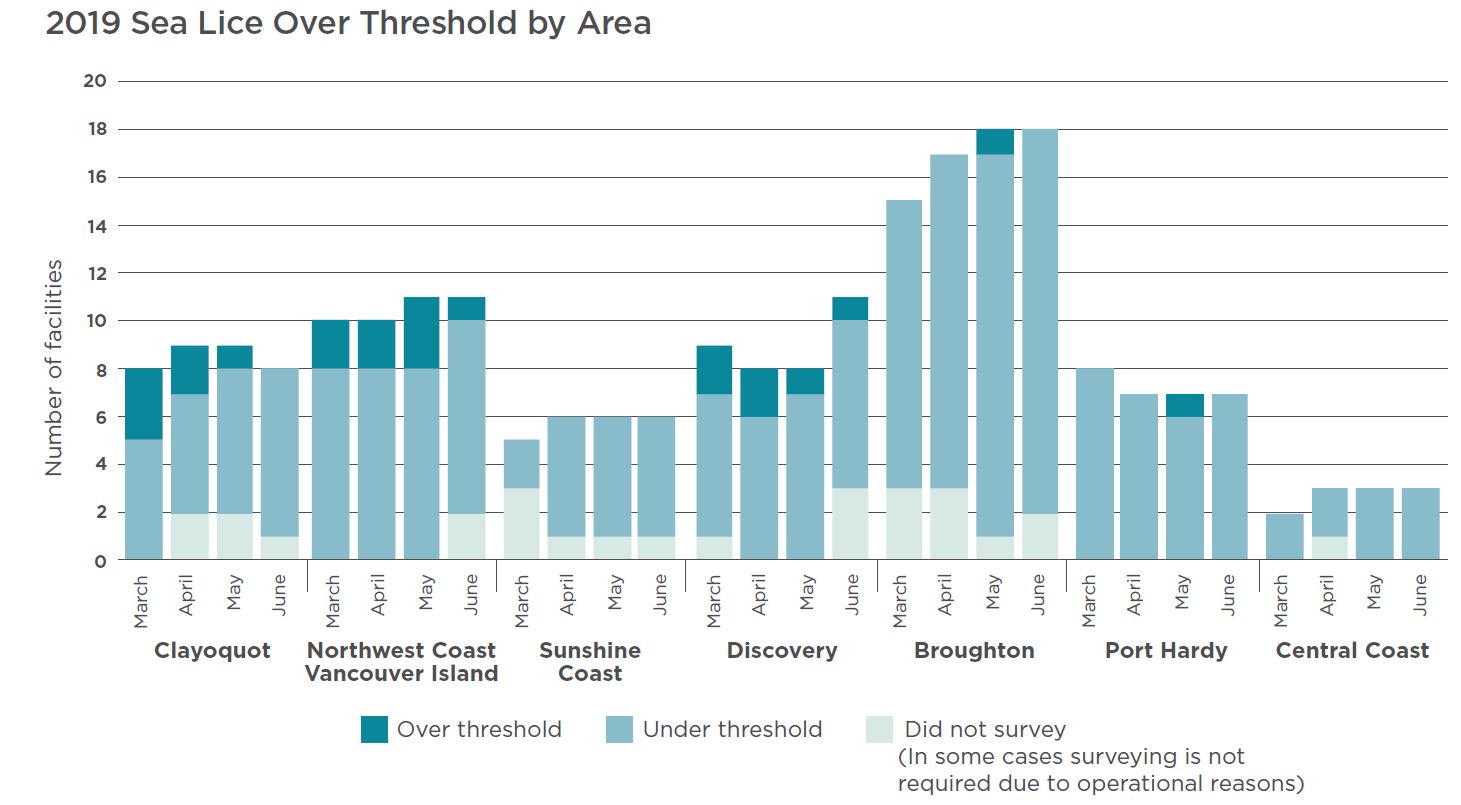
2019 Sea lice over threshold by area
Long text version
| Location | Month | Under threshold | Over threshold | Did not survey |
|---|---|---|---|---|
| Clayoquot | March | 5 | 3 | 0 |
| April | 5 | 2 | 2 | |
| May | 6 | 1 | 2 | |
| June | 7 | 0 | 1 | |
| Vancouver Island (Northwest Coast) | March | 8 | 2 | 0 |
| April | 8 | 2 | 0 | |
| May | 8 | 3 | 0 | |
| June | 8 | 1 | 2 | |
| Sunshine Coast | March | 2 | 0 | 3 |
| April | 5 | 0 | 1 | |
| May | 5 | 0 | 1 | |
| June | 5 | 0 | 1 | |
| Discovery | March | 6 | 2 | 1 |
| April | 6 | 2 | 0 | |
| May | 7 | 1 | 0 | |
| June | 7 | 1 | 3 | |
| Broughton | March | 12 | 0 | 3 |
| April | 14 | 0 | 3 | |
| May | 16 | 1 | 1 | |
| June | 16 | 0 | 2 | |
| Port Hardy | March | 8 | 0 | 0 |
| April | 7 | 0 | 0 | |
| May | 6 | 1 | 0 | |
| June | 7 | 0 | 0 | |
| Central Coast | March | 2 | 0 | 0 |
| April | 2 | 0 | 1 | |
| May | 3 | 0 | 0 | |
| June | 3 | 0 | 0 |
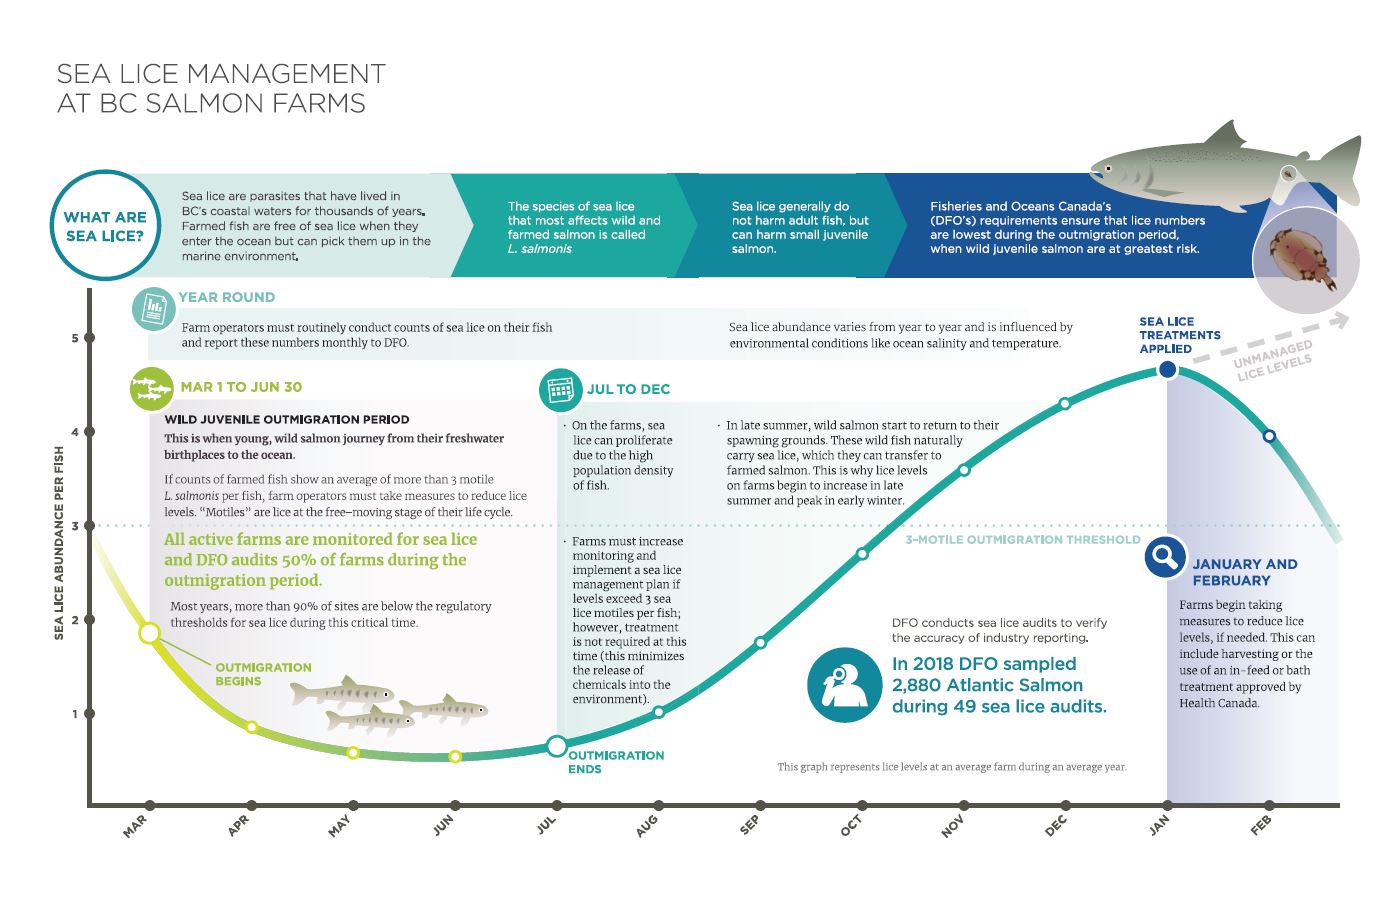
Sea lice management at BC salmon farms
Infographic: Sea lice management at BC salmon farms
Long text version
What are sea lice
Sea lice are parasites that have lived in BC’s coastal waters for thousands of years. Farmed fish are free of sea lice when they enter the ocean but can pick them up in the marine environment.
The species of sea lice that most affects wild and farmed salmon is called L. salmonis.
Sea lice generally do not harm adult fish, but can harm small juvenile salmon.
Fisheries and Oceans Canada’s (DFO’s) requirements ensure that lice numbers are lowest during the outmigration period, when wild juvenile salmon are at greatest risk.
Year round
Farm operators must routinely conduct counts of sea lice on their fish and report these numbers monthly to DFO.
Sea lice abundance varies from year to year and is influenced by environmental conditions like ocean salinity and temperature.
Mar 1 to Jun 30
Wild juvenile outmigration period
This is when young, wild salmon journey from their freshwater birthplaces to the ocean.
If counts of farmed fish show an average of more than 3 motile L. salmonis per fish, farm operators must take measures to reduce lice levels. “Motiles” are lice at the free-moving stage of their life cycle.
All active farms are monitored for sea lice and DFO audits 50% of farms during the outmigration period.
Most years, more than 90% of sites are below the regulatory thresholds for sea lice during this critical time.
Jul to Dec
DFO conducts sea lice audits to verify the accuracy of industry reporting.
In 2019 DFO sampled 3,040 Atlantic Salmon during 51 sea lice audits.
In late summer, wild salmon start to return to their spawning grounds. These wild fish naturally carry sea lice, which they can transfer to farmed salmon. This is why lice levels on farms begin to increase in late summer and peak in early winter.
On the farms, sea lice can proliferate due to the high population density of fish.
Farms must increase monitoring and implement a sea lice management plan if levels exceed 3 sea lice motiles per fish; however, treatment is not required at this time (this minimizes the release of chemicals into the environment).
January and February
Farms begin taking measures to reduce lice levels, if needed. This can include harvesting or the use of an in-feed or bath treatment approved by Health Canada.
Integrated pest management
SLICE® (emamectin benzoate) is a commonly used chemotherapeutant licensed for sea lice management in farmed salmon. In BC, SLICE® resistance has emerged in some farmed Atlantic salmon populations, necessitating the development of alternative treatments for lice management to prevent wide-spread resistance. Having multiple treatment options is a key feature of Integrated Pest Management and involves numerous methods of controlling sea lice in order to reduce reliance on chemotherapeutants, prevent the development of resistance, and to have different tools for different situations. Some other treatment examples include hydrogen peroxide or freshwater baths, mechanical sea lice removal (e.g., using a hydrolicer boat), or simply harvesting all the fish out of the water in a timely fashion.
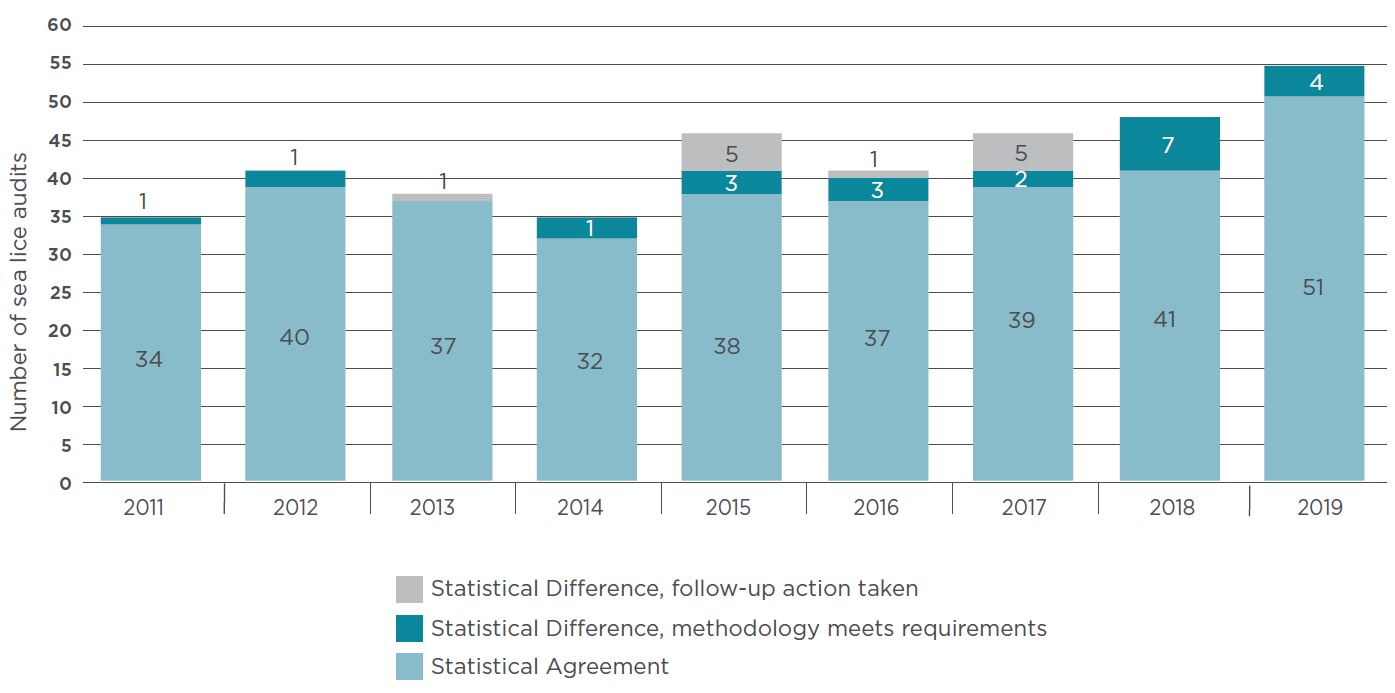
DFO Marine Finfish Aquaculture Sea Lice Audits in BC, 2011 to 2019
DFO audits aquaculture facilities to verify the accuracy of industry procedures and reporting. On the day of the sea lice audit, DFO and industry conduct sea lice counts on an equal number of fish. The results of DFO and industry counts are compared to determine statistical agreement. DFO also assesses industry’s counting procedures. In some cases where DFO and industry counts do not agree, the difference may be attributed to sample selection and not methodology. In these cases no follow up action is required. If methodology is incorrect, it is documented by DFO and the company is expected to provide training for their staff.
Long text version
| Year | Statistical agreement | Statistical difference, methodology meets requirements | Statistical difference, follow-up action taken |
|---|---|---|---|
| 2011 | 34 | 1 | 0 |
| 2012 | 40 | 1 | 0 |
| 2013 | 37 | 0 | 1 |
| 2014 | 32 | 1 | 0 |
| 2015 | 38 | 3 | 5 |
| 2016 | 37 | 3 | 1 |
| 2017 | 39 | 2 | 5 |
| 2018 | 41 | 7 | 0 |
| 2019 | 51 | 4 | 0 |
More about the monitoring and audit process
- DFO performs about 120 fish health audits each year
- On average, the industry compliance rate is 98%
- Every 3 months DFO randomly selects 30 active* salmon farms in BC for audit
*An active farm is one that has had at least three full pens of fish for at least 30 days of a calendar quarter
Learn more at www.pac.dfo-mpo.gc.ca/aquaculture/index-eng.html
Environmental
What is benthic (seabed) monitoring
Benthic means “of, or relating to, or occurring at the bottom of a body of water.” In BC, Fisheries and Oceans Canada’s (DFO’s) comprehensive benthic monitoring, auditing and regulation framework restricts the effects of fish farms on the surrounding environment.
Organic waste from fish farms, including feces and excess food, falls to the sea floor below and around aquaculture sites. In small amounts this provides food for species living below, but if too much accumulates, organisms can be smothered or the seabed altered. With time, the seabed will recover.
Infographic: How are farms monitored
Long text version
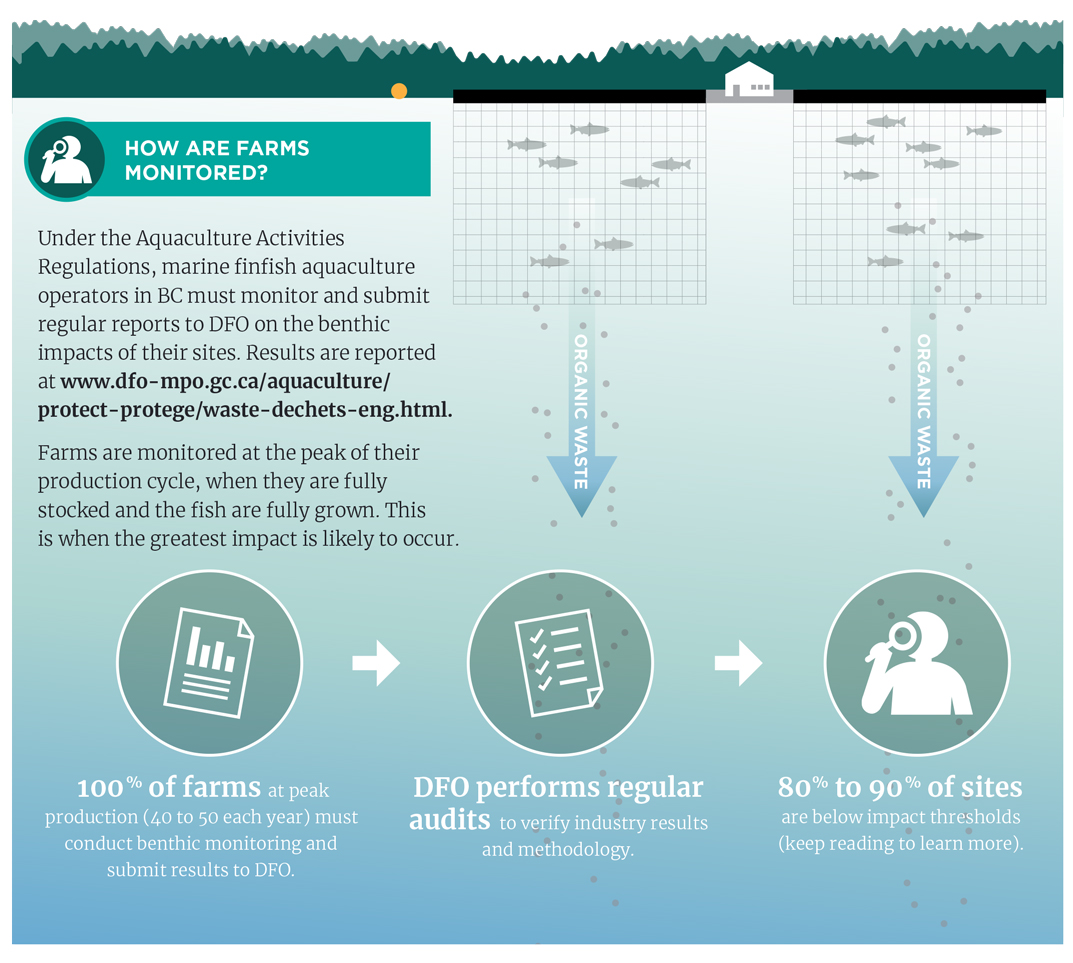
How are farms monitored
Under the Aquaculture Activities Regulations, marine finfish aquaculture operators in BC must monitor and submit regular reports to DFO on the benthic impacts of their sites. Results are reported at Managing organic wastes.
Farms are monitored at the peak of their production cycle, when they are fully stocked and the fish are fully grown. This is when the greatest impact is likely to occur.
- 100% of farms at peak production (40 to 50 each year) must conduct benthic monitoring and submit results to DFO
- DFO performs regular audits to verify industry results and methodology
- 80% to 90% of sites are below impact thresholds (keep reading to learn more)
Soft and hard bottom sites
Benthic monitoring activities depend on the sea floor beneath the farm. In BC, the sea floor is generally defined as soft bottom or hard bottom.
These are benthic monitoring procedures that the industry must follow. DFO biologists follow these same procedures during benthic audits:
Infographic: Soft and hard bottom sites
Long text version
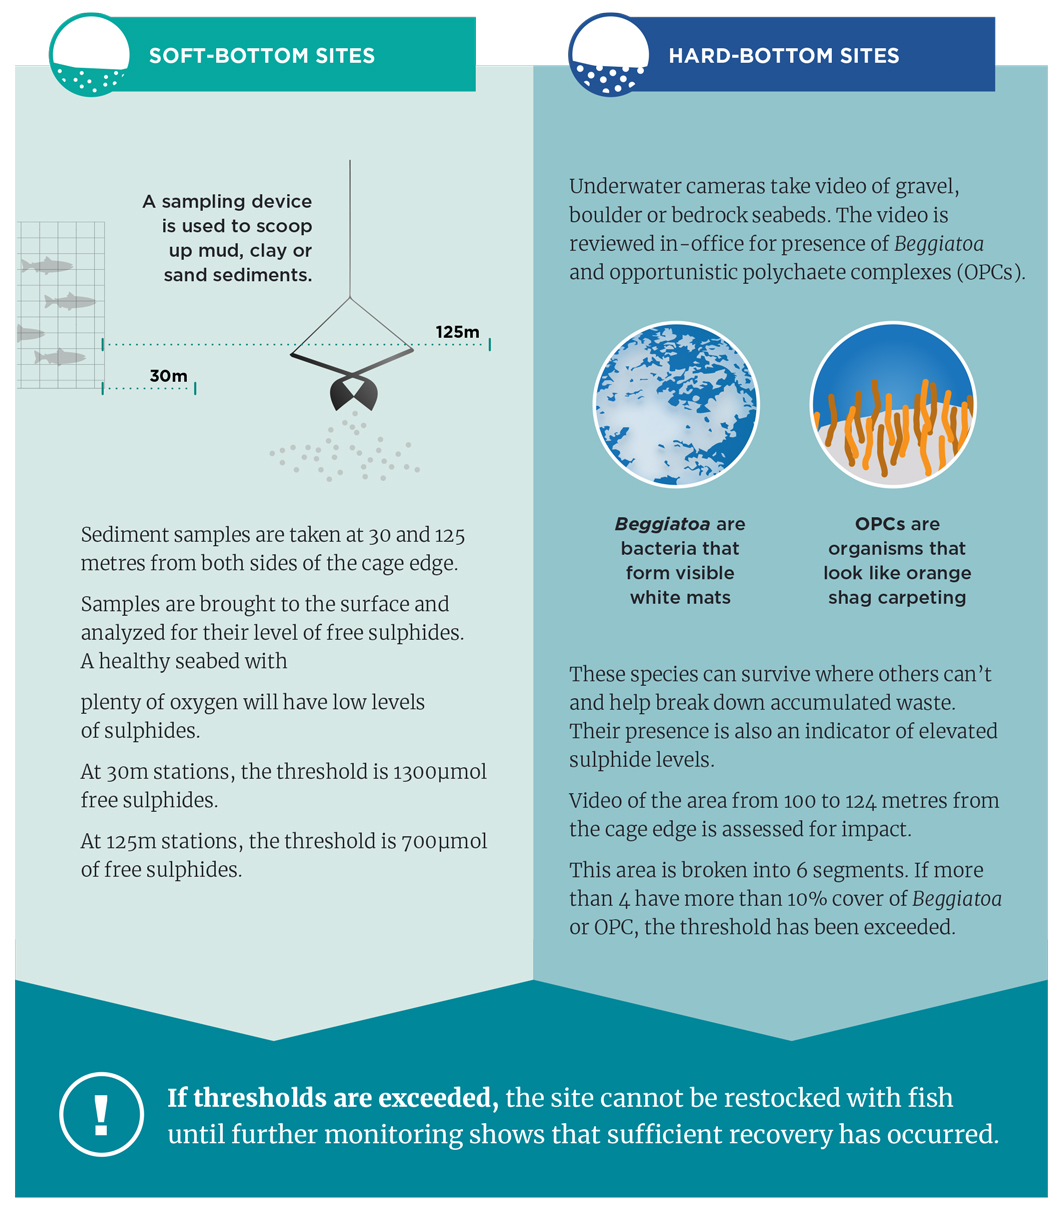
Soft-bottom sites
- A sampling device is used to scoop up mud, clay or sand sediments
- Sediment samples are taken at 30 and 125 metres from both sides of the cage edge
- Samples are brought to the surface and analyzed for their level of free sulphides. A healthy seabed with plenty of oxygen will have low levels of sulphides
- At 30m stations, the threshold is 1300µmol free sulphides
- At 125m stations, the threshold is 700µmol of free sulphides
Hard-bottom sites
- Underwater cameras take video of gravel, boulder or bedrock seabeds. The video is reviewed in-office for presence of Beggiatoa and opportunistic polychaete complexes (OPCs)
- Beggiatoa are bacteria that form visible white mats. OPCs are organisms that look like orange shag carpeting
- These species can survive where others can’t and help break down accumulated waste. Their presence is also an indicator of elevated sulphide levels
- Video of the area from 100 to 124 metres from the cage edge is assessed for impact
- This area is broken into 6 segments. If more than 4 have more than 10% cover of Beggiatoa or OPC, the threshold has been exceeded
If thresholds are exceeded, the site cannot be restocked with fish until further monitoring shows that sufficient recovery has occurred.
Industry-reported benthic monitoring events
Benthic monitoring data
This is a summary of the seabed sampling reports submitted in 2019. 13 site audits were conducted by DFO, and DFO’s audits indicated that 100% of results were consistent with industry-submitted reports.
| Industry - below threshold at all stations | Industry - exceeding threshold at one or more stations | |
|---|---|---|
| Hard | 7 | 2 |
| Mixed | 4 | 2 |
| Soft | 27 | 5 |
Environmental reports
Incidental catch
Incidental catch are wild fish that are caught or found dead within an aquaculture facility during harvest or transfer of farmed fish. Efforts must be made to release wild fish live and with the least harm. All incidental catch must be recorded and reported to DFO at the end of each production cycle. Complete data for 2019 will not be available until mid-2020 and will be included in the next annual report.
As compared to a percentage of Total Allowable Catch (TAC) in commercial fisheries, the amount of dead incidental catch related to aquaculture in BC is negligible. For example, the 2017 herring incidental catch represents the estimated equivalent less than 0.001% of the commercial TAC for the Strait of Georgia herring fishery.
Numbers refer to total individual fish caught
| 2011 | 2012 | 2013 | 2014 | 2015 | 2016 | 2017 | 2018 | |
|---|---|---|---|---|---|---|---|---|
| Herring | 7,833 | 11,264 | 23,374 | 26,128 | 29,075 | 45,023 | 75,240 | 15,760 |
| Cod species | 290 | 2,155 | 2,010 | 858 | 13,550 | 2,501 | 16,800 | 1,435 |
| Rockfish species | 1,753 | 38 | 2 | 46 | 30 | 1,468 | 10,250 | 3,370 |
| Perch species | 1,316 | 182 | 129 | 545 | 346 | 736 | 677 | 710 |
| Salmon species | 58 | 89 | 43 | 20 | 58 | 25 | 6 | 11 |
| Other | 195 | 351 | 266 | 26 | 150 | 3,430 | 5,898 | 2,356 |
| Total | 11,443 | 14,028 | 25,818 | 27,616 | 43,170 | 52,840 | 105,450 | 22,485 |
2019 escapes
All reasonable measures must be taken to prevent the escape of farmed fish. If an escape occurs, licence holders must take immediate action to stop further escapes, correct the issue, and report the event. DFO staff perform regular inspections to ensure compliance with Conditions of Licence.
In 2019, the number of escaped fish was higher than normal, mostly due to a single event caused by a fire at a farm site. DFO responded to the event by issuing the local First Nation a scientific licence to conduct a recapture fishery; however, attempts to harvest the escaped fish were unsuccessful. Subsequently, DFO engaged the farm operator and First Nations in the area to develop a coordinated plan to monitor for escapes.
- 4 escape events were recorded
- 21,031 fish escaped
2019 marine mammal interactions
All reasonable measures must be taken to prevent marine mammals from coming into conflict with facility infrastructure and farmed fish. Interactions that result in the death of pinnipeds (harbour seals or California sea lions) or any interactions with whales must be reported within 24 hours of discovery. DFO staff perform regular inspections to ensure compliance with licence conditions.
There were 0 marine mammal fatalities in 2019.
Looking forward - 2020 and beyond
Marine finfish aquaculture will continue to evolve in British Columbia as new science, tools, and social values emerge.
Sea lice conditions of licence
As part of an adaptive management approach, DFO will implement new sea lice Conditions of Licence (COL) in March 2020 to coincide with the wild salmon out-migration window. These are being developed in consultation with First Nations, industry, and environmental non-governmental organizations, and will include new, stricter monitoring and reporting requirements. The new licence conditions will be more precautionary and enforceable. DFO will conduct additional targeted audits to ensure compliance.
Area-based aquaculture management
DFO is moving towards an area-based approach for the management of aquaculture. The anticipated outcomes of this transition would include nation to nation collaboration, ecosystem-based planning and management, improved economic benefits for coastal and rural communities, shared accountability, and transparent decision making leading to increased social licence. One example of Area-based Aquaculture Management (ABAM) that was implemented in 2019 is managing the fish health performance of all the farms in an “area” collectively, rather than treating them individually.
Indigenous and multi-stakeholder advisory body and technical working group process
In 2019 DFO established an Indigenous and Multistakeholder Advisory Body (IMAB) comprised of representatives from the Province of British Columbia (BC), Indigenous communities, environmental organizations, the aquaculture industry, and other key stakeholders. Under the IMAB, three Technical Working Groups (TWGs) were asked to provide recommendations to the Department for the improvement of aquaculture management in B.C. in three main areas: areabased management, alternative production technologies, and fish health. By the summer of 2020, the recommendations to improve aquaculture management in BC developed through the IMAB and the TWGs will be put forward for consideration by the Minister.
Aquaculture act
DFO has begun development of a proposed national Aquaculture Act. Also proposed is the consolidation and amendment of all aquaculture-related regulatory provisions under the Fisheries Act, including those of the Pacific Aquaculture Regulations and Aquaculture Activities Regulations, into one set of regulations under the proposed act. During the development of the new aquaculture-specific legislation and regulations, the Department will seek to:
- foster national consistency, while respecting federal, provincial, and territorial jurisdiction;
- improve clarity and certainty for the industry;
- enhance environmental protection; and
- help sustainably grow the industry for the benefit of Indigenous and rural communities.
Transition plan for open net-pen mandate
In 2019, the Minister of Fisheries and Oceans was mandated by the Prime Minister to work with the Province of BC and Indigenous communities to create a responsible plan by 2025 to transition open net-pen aquaculture in BC. Over the next 5 years, the Department will advance this commitment, in partnership with the Province of BC and Indigenous groups, by using the best available science, evidence and input to develop a plan for the aquaculture industry in BC that supports the sustainable growth of the industry and also protects the environment.
Risk assessment in the Discovery Islands
In 2020, DFO will be completing risk assessments looking at the impacts of marine finfish farms in the Discovery Islands on the health of migrating Fraser river sockeye salmon in response to the 2012 Cohen Commission recommendations. DFO will be consulting with First Nations in the Discovery Islands to discuss the results of risk assessments and aquaculture licences in the area.
Finfish conditions of licence renewal
Through consultations and working groups created to seek recommendations from Indigenous People and various stakeholders, DFO has heard that Canadians would like to keep developing the ways that aquaculture can be managed in British Columbia. DFO will begin consulting on ways to improve the marine finfish aquaculture licence conditions in 2020, to be implemented when licences are renewed in 2022.
Important web links
- DFO aquaculture page (National)
- DFO aquaculture page (Pacific Region)
- Aquaculture public reporting (National)
- Aquaculture regulations and compliance (Pacific Region-annual compliance report, IGMF, IMAPs)
- Aquaculture licensing (info on user fees, CoLs, report on applications and decisions, siting guidelines)
- Aquaculture maps (facility locations, Fish Health zones, transfer zones)
- Canadian Food Inspection Agency (CFIA) reportable diseases
Marine finfish aquaculture public reporting in British Columbia
- Aquaculture Activities Regulations (AAR) drugs and pesticides
- Monthly mortality by category, by facility (open data)
- Quarterly average mortality by category, by zone (figure)
- Fish health monitoring activities, number of carcasses sampled
- Audit activities, fish health, sea lice, benthic (figures)
- Fish health events, by facility, 2016-ongoing (open data)
- Fish health events, annual (graph)
- Mortality events, by facility, 2011-ongoing (open data)
- Mortality events, annual (graph)
- Fish Health audits, by facility, 2011-ongoing (open data)
- Monthly sea lice abundance, by facility (open data)
- DFO sea lice audits, by facility (open data)
- Average sea lice abundance, by zone (graph)
- Use of Antibacterials (graph)
- Use of Anti-lice Therapeutants (graph)
- DFO benthic audits, by facility (open data)
- Industry benthic monitoring, by facility (open data)
- Benthic performance, annual (graph)
- Incidental catch, by facility (open data)
- Marine mammal fatalities, annual (graph)
- Marine mammal interactions, by facility (open data)
- Escapes, by facility, 2011-ongoing (open data)
- Escapes, annual (graph)
- Atlantic Salmon Watch Program (open data)
- Salmon transfers, 2015-ongoing (open data)
- Regulating and monitoring British Columbia’s marine finfish aquaculture facilities
- Date modified: