
Book 1, Tab A6 - Financial Outlook 2024-25
Context
- Present the financial overview, as a whole and by individual Vote, for the Department of Fisheries and Oceans.
- All funding levels presented for 2024-25 and beyond reflect approved reference levels, based on planned spending at the time of Main Estimates.
Total planned authorities
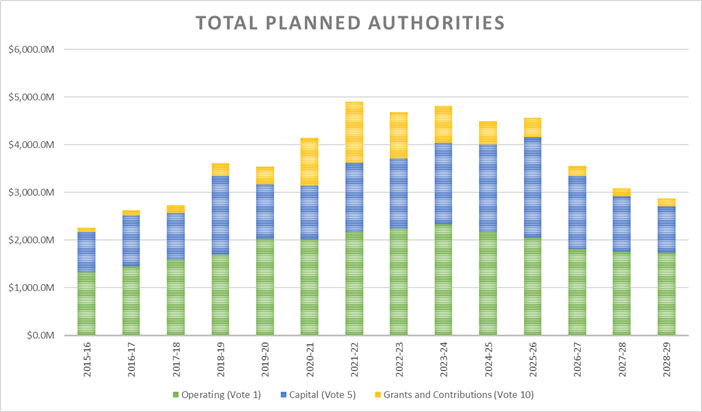
Text version: Total Planned Authorities and Resource Allocation
| Vote | 2015-16 | 2016-17 | 2017-18 | 2018-19 | 2019-20 | 2020-21 | 2021-22 | 2022-23 | 2023-24 | 2024-25 | 2025-26 | 2026-27 | 2027-28 | 2028-29 |
|---|---|---|---|---|---|---|---|---|---|---|---|---|---|---|
| Operating (Vote 1) | $1,324.6M | $1,457.9M | $1,596.3M | $1,700.9M | $2,028.1M | $2,014.5M | $2,165.8M | $2,248.1M | $2,433.3M | $2,175.8M | $2,058.1M | $1,816.4M | $1,762.1M | $1,734.6M |
| Capital (Vote 5) | $843.0M | $1,064.9M | $972.8M | $1,641.3M | $1,141.3M | $1,129.8M | $1,467.2M | $1,471.7M | $1,709.2M | $1,826.8M | $2,095.8M | $1,536.0M | $1,160.8M | $982.0M |
| Grants and Contributions (Vote 10) | $96.9M | $102.0M | $159.7M | $272.9M | $374.9M | $1,004.8M | $1,280.8M | $967.4M | $775.6M | $491.8M | $419.9M | $209.0M | $170.0M | $166.1M |
| Total | $2,264.5M | $2,624.8M | $2,728.8M | $3,615.1M | $3,544.3M | $4,149.1M | $4,913.7M | $4,687.2M | $4,918.1M | $4,494.4M | $4,573.8M | $3,561.4M | $3,092.9M | $2,882.7M |
2015-16 to 2023-24 authorities represent year-end authorities, as per Public Accounts
Does not reflect potential future renewal of sunsetters and Budget 2024 items
Resources – Aligning to results
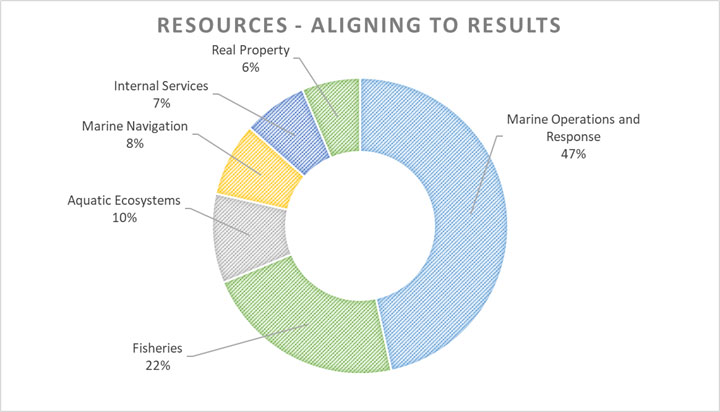
Text version: Resources – Aligning to results
| Result | Percentage |
|---|---|
| Marine Operations and Response | 47% |
| Fisheries | 22% |
| Aquatic Ecosystems | 10% |
| Marine Navigation | 8% |
| Internal Services | 7% |
| Real Property | 6% |
| Total | 100% |
- DFO is a highly decentralized department, managing a 2024-25 budget of ~$4.7 billion, including $190.8M in statutory authorities.
- The Department has recently received an injection of temporary funding to support the Canadian Coast Guard fleet. This includes funding for the Multi-Purpose Vessel project, Offshore Oceanographic Science Vessel and funding to progress the future fleet.
- Budget 2023 announced government spending reductions on travel and professional services, as well as a reduction of operating and transfer payment spending across all federal organizations to help achieve savings of $14.1 billion over five years. This results in an impact of $85.4 million in 2024-25, increasing to $135.4 million in 2026-27 and after. These amounts include both reductions to our existing funding as well as the refocusing of project funds that were to be sought at a later time.
- One time funding for initiatives such as temporary funding for the Small Craft Harbour Program and the Ghost Gear Fund for recovery and resilience efforts following Hurricane Fiona will see a planned decrease to their funding profiles as the program reaches completion.
- 2024-25 Supplementary Estimates (B) provided an additional influx in funding of $531.1 million, including $6.4 million in statutory authorities. This increased the 2024-25 total authorities to ~$5.4 billion.
Vote 1 – Planned operating
Planned operating authorities
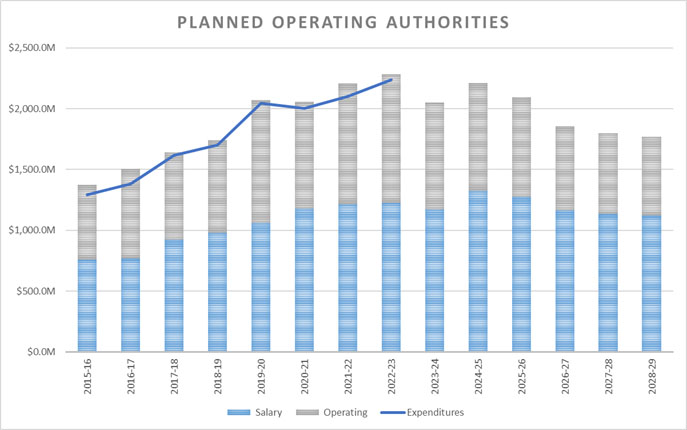
Text version: Planned operating authorities
| Vote 1 | 2015-16 | 2016-17 | 2017-18 | 2018-19 | 2019-20 | 2020-21 | 2021-22 | 2022-23 | 2023-24 | 2024-25 | 2025-26 | 2026-27 | 2027-28 | 2028-29 |
|---|---|---|---|---|---|---|---|---|---|---|---|---|---|---|
| Salary | $757.3M | $770.4M | $923.2M | $982.0M | $1,060.5M | $1,176.7M | $1,214.6M | $1,254.7M | $1,459.3M | $1,325.0M | $1,278.5M | $1,164.8M | $1,134.8M | $1,122.5M |
| Operating | $617.2M | $737.1M | $721.0M | $760.1M | $1,012.3M | $878.7M | $992.1M | $1,040.4M | $1,014.0M | $890.9M | $819.6M | $691.6M | $667.3M | $652.1M |
| Total Authorities | $1,374.5M | $1,507.6M | $1,644.2M | $1,742.1M | $2,072.8M | $2,055.4M | $2,206.7M | $2,295.2M | $2,473.3M | $2,215.9M | $2,098.1M | $1,856.4M | $1,802.1M | $1,774.6M |
| Expenditures | $1,253.9M | $1,342.3M | $1,575.2M | $1,663.0M | $1,999.3M | $1,961.0M | $2,059.8M | $2,191.7M | - | - | - | - | - | - |
Does not reflect potential future renewal of sunsetters and Budget 2024 items
Non-salary resources – by standard object
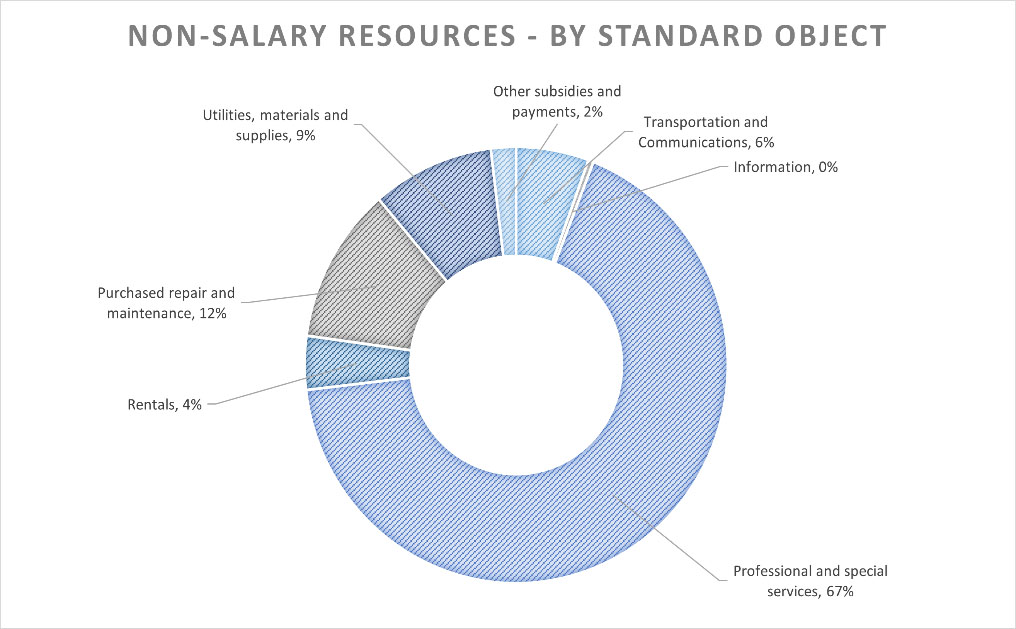
Text version: Non-salary resources – by standard object
| Standard Object | Percentage |
|---|---|
| Transportation and Communications | 6% |
| Information | 0% |
| Professional and special services | 67% |
| Rentals | 4% |
| Purchased repair and maintenance | 12% |
| Utilities, materials and supplies | 9% |
| Other subsidies and payments | 2% |
- Salary makes up approximately 49 per cent of operating spending – approximately 14,200 FTEs were planned for 2024-25, across Canada.
- In 2024-25, close to 67 per cent of non-salary spending will be on professional and special services. The Refocusing Government Spending exercise identified discretionary program and consultation/contractual spending that can be eliminated or reduced. Professional and special services are primarily related to Engineering and Architectural Services, which are used to support investments in Fleet Renewal and Infrastructure investments. These are mostly non-discretionary and are required to deliver assets that meet mandated policy objectives.
Vote 5 – Planned capital
Planned capital authorities
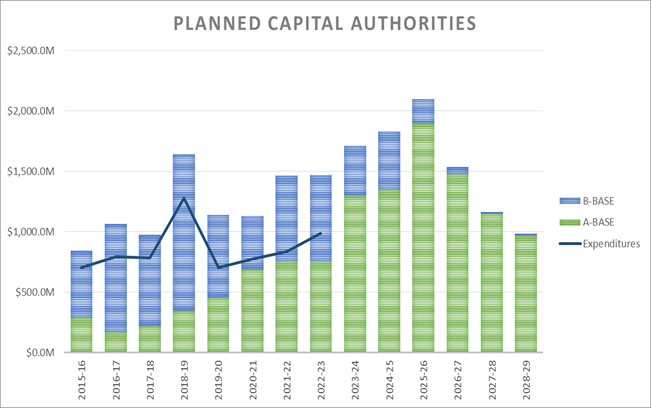
Text version: Planned capital authorities
| Vote 5 Funding Type | 2015-16 | 2016-17 | 2017-18 | 2018-19 | 2019-20 | 2020-21 | 2021-22 | 2022-23 | 2023-24 | 2024-25 | 2025-26 | 2026-27 | 2027-28 | 2028-29 |
|---|---|---|---|---|---|---|---|---|---|---|---|---|---|---|
| A-Base | $284.6M | $168.7M | $218.6M | $347.4M | $457.0M | $685.4M | $756.8M | $758.1M | $1,305.1M | $1,347.7M | $1,897.2M | $1,474.0M | $1,148.8M | $968.6M |
| B-Base | $558.4M | $896.2M | $754.1M | $1,293.9M | $684.3M | $444.4M | $710.4M | $713.5M | $404.2M | $479.1M | $198.6M | $62.0M | $12.1M | $13.4M |
| Total | $843.0M | $1,064.9M | $972.8M | $1,641.3M | $1,141.3M | $1,129.8M | $1,467.2M | $1,471.7M | $1,709.2M | $1,826.8M | $2,095.8M | $1,536.0M | $1,160.8M | $982.0M |
| Expenditures | $705.3M | $792.9M | $783.9M | $1,280.7M | $701.6M | $773.4M | $835.2M | $986.1M | - | - | - | - | - | - |
A-Base authorities refer to programs with permanent/ongoing funding, while B-Base authorities reflect temporary funding sources.
Does not reflect potential future renewal of sunsetters and Budget 2024 items.
Resources – Capital by asset type
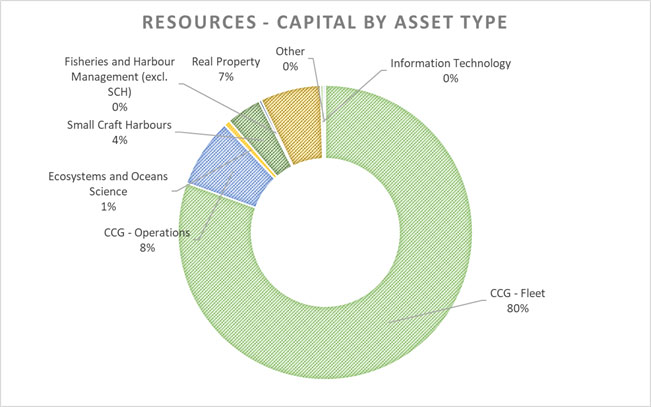
Text version: Resources – Capital by asset type
| Asset Type | Percentage |
|---|---|
| CCG - Fleet | 80% |
| CCG - Operations | 8% |
| Ecosystems and Oceans Science | 1% |
| Small Craft Harbours | 4% |
| Fisheries and Harbour Management (excluding SCH) | 0% |
| Real Property | 7% |
| Information Technology | 0% |
| Other | 0% |
- Total capital authorities of $1,826.8 million as voted through the Main Estimates for 2024-25.
- Over 98 per cent of DFO’s capital budget is for investments in the Coast Guard, small craft harbours and real property portfolio.
- DFO has recently received an influx in funding to invest in the Coast Guard fleet renewal, including Polar Icebreaker, Multi-Purpose Vessels, Arctic Offshore Patrol Vessels and Offshore Oceanographic Science Vessel. Fleet renewal has been at the forefront of our priorities since 2005 and ensures the continued support to Canadian marine safety, accessibility and security.
Vote 10 – Planned grants and contributions
Grant and contribution authorities
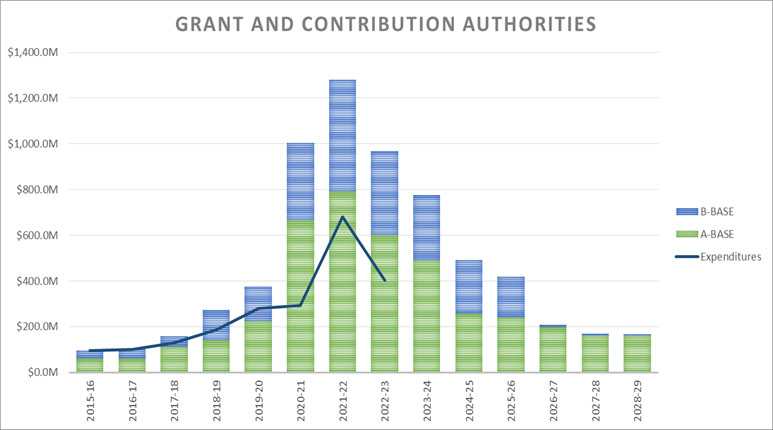
Text version: Grant and Contribution Authorities
| Vote 10 Funding Type | 2016-17 | 2017-18 | 2018-19 | 2019-20 | 2020-21 | 2021-22 | 2022-23 | 2023-24 | 2024-25 | 2025-26 | 2026-27 | 2027-28 | 2028-29 |
|---|---|---|---|---|---|---|---|---|---|---|---|---|---|
| A-Base | $59.1M | $58.9M | $111.3M | $140.7M | $223.7M | $667.7M | $790.4M | $600.2M | $489.5M | $257.4M | $239.2M | $198.0M | $161.3M |
| B-Base | $37.8M | $43.1M | $48.4M | $132.2M | $151.1M | $337.1M | $490.4M | $367.2M | $286.1M | $234.4M | $180.7M | $11.0M | $8.8M |
| Total | $96.9M | $102.0M | $159.7M | $272.9M | $374.9M | $1,004.8M | $1,280.8M | $967.4M | $775.6M | $491.8M | $419.9M | $209.0M | $170.0M |
| Expenditures | $94.3M | $99.6M | $128.9M | $185.4M | $279.1M | $291.9M | $681.3M | - | - | - | - | - | - |
A-Base authorities refer to programs with permanent/ongoing funding, while B-Base authorities reflect temporary funding sources.
Does not reflect potential future renewal of sunsetters and Budget 2024 items.
- Total Grants and Contributions authorities for 2024-25 are $491.8 million as voted through the Main Estimates.
- Authorities increased significantly from 2019-20 to 2021-22, largely due to funding for Reconciliation Agreements. This funding starts returning to a steadier state as larger planned payments related to access, vessels and gear will be made within the scope of the initiative.
- Temporary funding sources (B-base) include programs such as the Nature Legacy, Marine Conservation Targets, Pacific Salmon Strategy Initiative, Fish Funds and recovery from hurricane Fiona.
- Based on our 2024-25 Main Estimates, the Department has 18 Transfer Payment Programs – with the largest recipients consisting of aquatic species and aquatic habitat, Indigenous organizations and fish funds.
- Date modified: