
Book 1, Tab A4 - Financial Outlook
On this page
Overview
DFO is a highly decentralized department composed of approximately 15,700 employees across the country, including 13,800 full time equivalents.
- Workforce: Of the approximate 13,800 FTEs employed (including close to 6,000 in Coast Guard), over 80 per cent of employees are located outside of the National Capital Region.
- Asset Base: Capital intensive department comprised of approximately 36,000 assets. It is in the top five of the largest capital asset bases for all federal departments.
- Coast Guard: Special Operating Agency with a fleet of 117 vessels, 1000 small crafts and 22 helicopters.
- Regional Presence: DFO/CCG has over 350 work locations and one of the largest federal government property portfolios.
Key initiatives for 2022-23
DFO is focused on growing Canada’s ocean economy, sustaining and rebuilding the fisheries and ensuring the advancement of reconciliation and conservation objectives, while providing important economic opportunities to Canadians and coastal communities.
Pacific Salmon Strategy Initiative: Funding aims to provide a long-term strategy to stem declining trends in the Pacific salmon stocks and make the commercial Pacific salmon harvesting sector in Pacific Region more adaptive and resilient ($732M over five years starting in 2021-22, including $177M in 2022-23).
Small Craft Harbours Program Integrity: Funding supplements the Small Craft Harbour Program to accelerate repair and maintenance work at core Small Craft Harbours across Canada, to divest non-core harbours through transfers and to close inactive non-core harbours that are unsafe ($300M over two years starting in 2021-22, including $150M in 2022-23).
Marine Conservation Targets: Funding supports meeting the Government of Canada’s marine conservation target to protect 25 per cent of marine areas by 2025 through the establishment of new marine protected areas and other effective area-based conservation measures ($660M over 5 years starting in 2021-22, including $126M in 2022-23).
Annexes
Total Planned Authorities
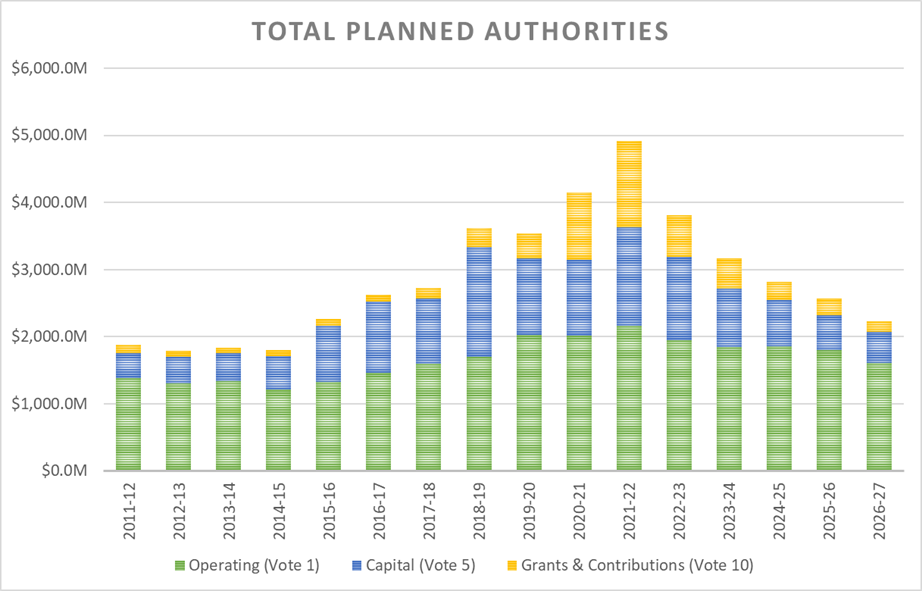
- 2012-13 to 2020-21 authorities represent year-end authorities, as per Public Accounts
- Does not reflect potential future renewal of sunsetters
Text version: Total Planned Authorities
| Year | Operating (Vote 1) | Capital (Vote 5) | Grants & Contributions (Vote 10) | Total |
|---|---|---|---|---|
| 2011-12 | 1,385.8 | 366.8 | 129.5 | 1,882.1 |
| 2012-13 | 1,308.2 | 396.4 | 88.9 | 1,793.5 |
| 2013-14 | 1,342.8 | 409.2 | 88.2 | 1,840.3 |
| 2014-15 | 1,218.7 | 486.4 | 91.5 | 1,796.6 |
| 2015-16 | 1,324.6 | 843.0 | 96.9 | 2,264.5 |
| 2016-17 | 1,457.9 | 1,064.9 | 102.0 | 2,624.8 |
| 2017-18 | 1,596.3 | 972.8 | 159.7 | 2,728.8 |
| 2018-19 | 1,700.9 | 1,641.3 | 272.9 | 3,615.1 |
| 2019-20 | 2,028.1 | 1,141.3 | 374.9 | 3,544.3 |
| 2020-21 | 2,014.5 | 1,129.8 | 1,004.8 | 4,149.1 |
| 2021-22 | 2,164.4 | 1,467.2 | 1,280.8 | 4,912.4 |
| 2022-23 | 1,945.6 | 1,241.3 | 620.1 | 3,807.0 |
| 2023-24 | 1,846.0 | 867.7 | 456.0 | 3,169.7 |
| 2024-25 | 1,856.1 | 690.3 | 272.3 | 2,818.7 |
| 2025-26 | 1,803.1 | 515.4 | 254.3 | 2,572.8 |
| 2026-27 | 1,604.5 | 469.2 | 154.1 | 2,227.7 |
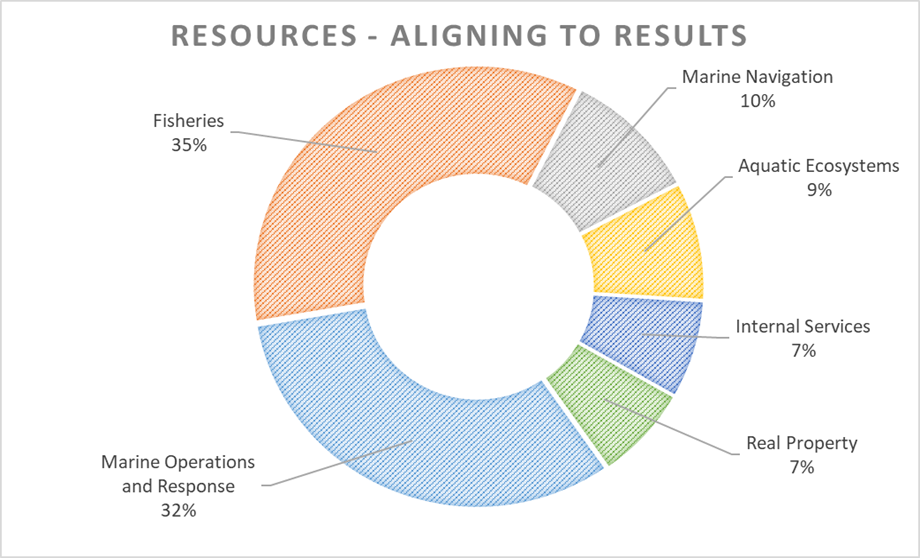
Text version: Resources – Aligning to results
Resources – Aligning to results
- Fisheries 35%
- Marine Operations and Response 32%
- Marine Navigation 10%
- Aquatic Ecosystems 9%
- Internal Services 7%
- Real Property 7%
- DFO is a highly decentralized department, managing a 2022-23 budget of ~$4.0 billion.
- The Department has recently received an injection of funding to implement key initiatives, notably:
- $732 million from 2021-22 to 2025-26 for the Pacific Salmon Strategy Initiative in order to improve salmon conservation through effective stewardship and integrated ecosystem planning.
- $660 million from 2021-22 to 2025-26 for marine conservation targets in order to establish new marine protected areas (MPAs) and other effective area-based conservation measures (OECMs), negotiate Impact and Benefit Agreements with Inuit organizations, and initiate a marine spatial planning process in the Western Arctic
- In addition to its steady on-going funding, Small Craft Harbours received $300 million in temporary funding through Budget 2021 to repair, renew, and replace small craft harbours across the country.
- Some funding initiatives such as Indigenous programs are progressing and moving from peak funding to steadier states. Some examples include: advancing reconciliation on Indigenous rights issues; and implementation of BC agreements.
- One time funding for initiatives such as the Fish Harvesters Benefit Program and other time-limited programs will see a decrease to their funding profiles in the upcoming years, resulting in a return to more normal authority levels.
Vote 1 – Planned Operating
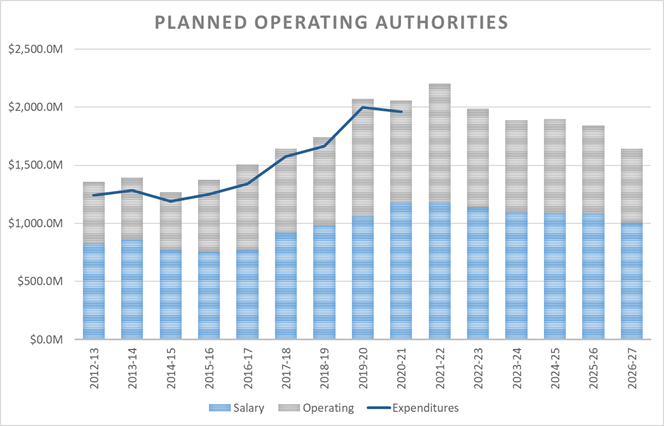
- Does not reflect potential future renewal of sunsetters
Text version: Planned Operating Authorities
| Year | Salary | Operating | Total | Expenditures |
|---|---|---|---|---|
| 2012-13 | 829.3 | 529.4 | 1,358.7 | 1,241.0 |
| 2013-14 | 858.3 | 535.2 | 1,393.5 | 1,283.4 |
| 2014-15 | 768.9 | 500.4 | 1,269.4 | 1,192.5 |
| 2015-16 | 757.3 | 617.2 | 1,374.5 | 1,253.9 |
| 2016-17 | 770.4 | 737.1 | 1,507.6 | 1,342.3 |
| 2017-18 | 923.2 | 721.0 | 1,644.2 | 1,575.2 |
| 2018-19 | 982.0 | 760.1 | 1,742.1 | 1,663.0 |
| 2019-20 | 1,060.5 | 1,012.3 | 2,072.8 | 1,999.3 |
| 2020-21 | 1,176.7 | 878.7 | 2,055.4 | 1,961.0 |
| 2021-22 | 1,177.5 | 1,026.9 | 2,204.4 | - |
| 2022-23 | 1,141.5 | 844.1 | 1,985.6 | - |
| 2023-24 | 1,096.4 | 789.6 | 1,886.0 | - |
| 2024-25 | 1,088.0 | 808.0 | 1,896.1 | - |
| 2025-26 | 1,086.4 | 756.7 | 1,843.1 | - |
| 2026-27 | 1,003.2 | 641.3 | 1,644.5 | - |
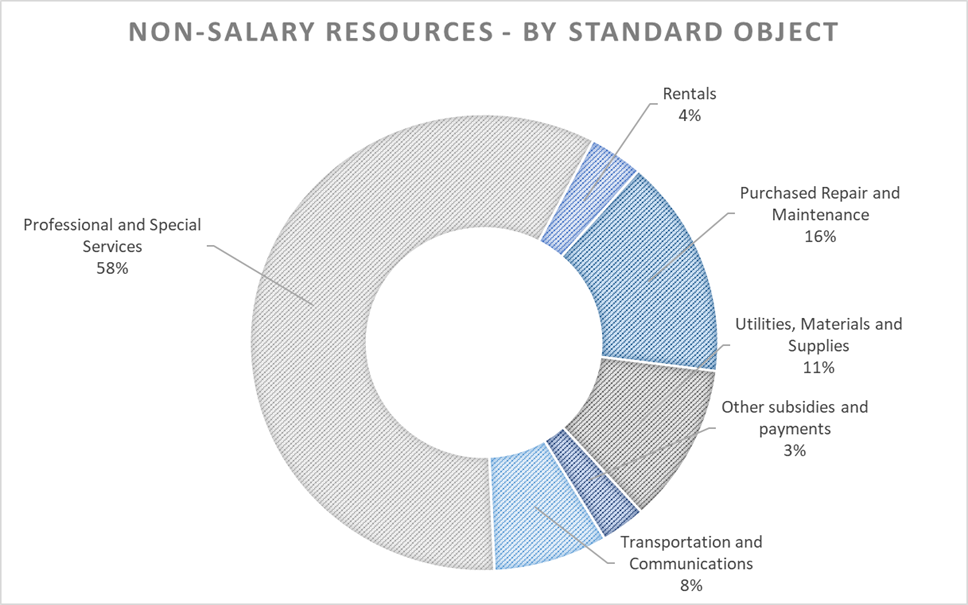
Text version: Non-salary resources – by standard object
Non-salary resources – by standard object
- Professional and special services 58%
- Purchased repair and maintenance 16%
- Utilities, materials and supplies 11%
- Transportation and communications 8%
- Rentals 4%
- Other subsidies and payments 3%
- Total operating authorities of $1,945.6 million as voted through the Main Estimates for 2022-23.
- Salary makes up approximately 59 per cent of operating spending – approximately 13,800 FTEs are planned for 2022-23, across Canada.
- With shifting funding profiles, sunsetting programs and fluctuations to the department’s overall complement of FTEs over the next few years, HR planning is critical to ensure there is no impact on the Department’s ability to deliver.
- DFO has one of the largest asset base in the Government. In 2022-23, close to 58 per cent of non-salary spending will be on professional or special services and about 16 per cent on repairs and maintenance primarily to support the asset base.
Vote 5 – Planned Capital
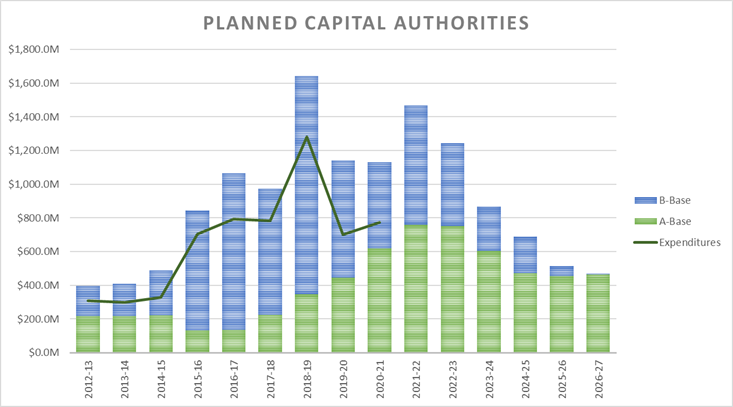
Text version: Planned Capital Authorities
| Year | A-Base | B-Base | Total | Expenditures |
|---|---|---|---|---|
| 2012-13 | 218.7 | 177.7 | 396.4 | 307.9 |
| 2013-14 | 218.5 | 190.8 | 409.2 | 299.4 |
| 2014-15 | 222.2 | 264.2 | 486.4 | 328.9 |
| 2015-16 | 132.6 | 710.4 | 843.0 | 705.3 |
| 2016-17 | 136.4 | 928.5 | 1,064.9 | 792.9 |
| 2017-18 | 225.4 | 747.4 | 972.8 | 783.9 |
| 2018-19 | 347.4 | 1,293.9 | 1,641.3 | 1,280.7 |
| 2019-20 | 444.4 | 696.9 | 1,141.3 | 701.6 |
| 2020-21 | 621.1 | 508.7 | 1,129.8 | 773.4 |
| 2021-22 | 756.8 | 710.4 | 1,467.2 | - |
| 2022-23 | 752.4 | 488.9 | 1,241.3 | - |
| 2023-24 | 604.0 | 263.8 | 867.7 | - |
| 2024-25 | 471.2 | 219.1 | 690.3 | - |
| 2025-26 | 455.9 | 59.5 | 515.4 | - |
| 2026-27 | 466.4 | 2.8 | 469.2 | - |
- A-Base authorities refer to the department’s permanent/ongoing funding, while B-Base authorities reflect temporary funding sources.
- Does not reflect potential future renewal of sunsetters
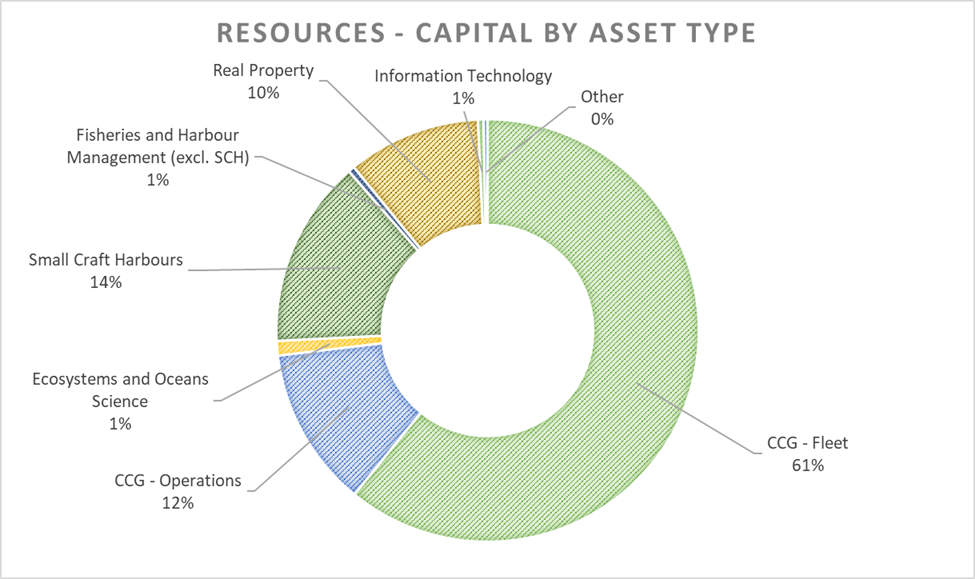
Text version: Resources – Capital by asset type
Resources – Capital by asset type
- CCG – Fleet 61%
- Small craft harbours 14%
- CCG – Operations 12%
- Real property 10%
- Ecosystems and oceans science 1%
- Fisheries and harbours management (excl. SMH) 1%
- Information technology 1%
- Other 0%
- Total capital authorities of $1,241.3 million as voted through the Main Estimates for 2022-23.
- Over 98 per cent of DFO’s capital budget is for investments in the Coast Guard, small craft harbours and real property portfolio.
- DFO received a significant influx in funding to invest in key assets over the last three years (e.g., Coast Guard fleet renewal, small craft harbours, Oceans Protection Plan).
- Coast Guard fleet renewal remains at the forefront of our priorities. Since 2005, approximately $50.0B in fleet investments have been committed in the fiscal framework.
- DFO is working towards adopting accrual budgeting, based on an asset lifecycle replacement methodology. This will provide predictable capital funding and ensure the proper support of the significant portfolio of asset.
Vote 10 – Planned Grants and Contributions
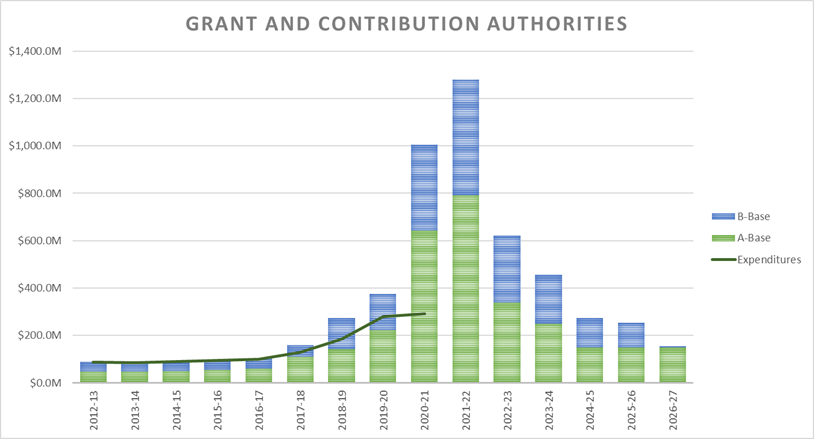
- A-Base authorities refer to the department’s permanent/ongoing funding, while B-Base authorities reflect temporary funding sources.
- Does not reflect potential future renewal of sunsetters
Text version: Grant and Contribution Authorities
| Year | A-Base | B-Base | Total | Expenditures |
|---|---|---|---|---|
| 2012-13 | 48.1 | 40.8 | 88.9 | 88.2 |
| 2013-14 | 48.1 | 40.1 | 88.2 | 85.3 |
| 2014-15 | 48.5 | 43.0 | 91.5 | 89.7 |
| 2015-16 | 54.7 | 42.2 | 96.9 | 94.3 |
| 2016-17 | 58.7 | 43.3 | 102.0 | 99.6 |
| 2017-18 | 111.3 | 48.4 | 159.7 | 128.9 |
| 2018-19 | 140.7 | 132.2 | 272.9 | 185.4 |
| 2019-20 | 222.5 | 152.3 | 374.9 | 279.1 |
| 2020-21 | 643.6 | 361.2 | 1,004.8 | 291.9 |
| 2021-22 | 790.4 | 490.4 | 1,280.8 | - |
| 2022-23 | 340.0 | 280.2 | 620.1 | - |
| 2023-24 | 248.5 | 207.5 | 456.0 | - |
| 2024-25 | 149.7 | 122.6 | 272.3 | - |
| 2025-26 | 149.0 | 105.3 | 254.3 | - |
| 2026-27 | 149.0 | 5.1 | 154.1 | - |
- Total Grants and Contributions authorities for 2022-23 are $620.1 million as voted through the Main Estimates.
- Authorities increased significantly from 2019-20 to 2021-22, largely due to funding for Reconciliation Agreements. This funding levels off in 2022-23 as larger planned payments related to access, vessels and gear will be made within the scope of the initiative.
- Temporary funding sources make up a large portion of the overall authorities. Notable programs funded in this way include the Nature Legacy, Pacific Salmon Strategy Initiative, and Marine Conservation Targets.
- Based on our 2022-23 Main Estimates, the Department has 19 Transfer Payment Programs – with the largest recipients consisting of Indigenous organizations, associations focused on conservation and research organizations.
- Date modified: