
International trade
4.1 Exports
Canadian exports of marine, freshwater and aquaculture fish products have reached a total value of $4.31 billion in 2005, which is $143m less than in 2004. This is mainly attributable to decreases in the price of snow crab, scallop and Pacific Dungeness crab. The most important Canadian exports in 2005 were lobster, snow crab, shrimp and farmed salmon, which combined represented more than half of the total value of Canadian seafood exports during the year.
| Species | Export Value ($m) | |||
|---|---|---|---|---|
| 2003 | 2004 | 2005 | % change
2004-2005 |
|
| Groundfish | 513 | 481 | 476 | -1% |
| Cod, Haddock | 190 | 154 | 126 | -18% |
| Halibut | 115 | 95 | 62 | -35% |
| Hake | 25 | 59 | 69 | 17% |
| Greenland Turbot | 4 | 39 | 61 | 56% |
| Other | 138 | 134 | 158 | 18% |
| Pelagic fish | 904 | 912 | 1,014 | 11% |
| Herring, Mackerel | 234 | 241 | 280 | 16% |
| Salmon, Farmed | 487 | 421 | 485 | 15% |
| Salmon, Pacific (wild) | 125 | 151 | 157 | 4% |
| Tuna | 23 | 39 | 31 | -21% |
| Other | 33 | 59 | 62 | 5% |
| Shellfish | 2,703 | 2,653 | 2,423 | -9% |
| Lobster | 1,030 | 952 | 992 | 4% |
| Crab, snow | 680 | 659 | 488 | -26% |
| Crab, other | 182 | 266 | 159 | -40% |
| Shrimp | 472 | 438 | 478 | 9% |
| Scallop | 133 | 131 | 108 | -18% |
| Clams | 109 | 109 | 99 | -9% |
| Other | 96 | 97 | 99 | 2% |
| Other marine species | 243 | 276 | 274 | -1% |
| Freshwater fish | 139 | 132 | 124 | -6% |
| Perch | 24 | 26 | 25 | -4% |
| Pickerel | 37 | 37 | 37 | 0% |
| Other | 78 | 68 | 62 | -9% |
| Total | 4,532 | 4,455 | 4,312 | -3% |
Source: Statistics Canada, International Trade Division.
In 2005, some species have witnessed a good year in terms of export values. Among these, mackerel exports have increased by $35m (+81%) since 2004, due to a higher price in 2005. Greenland turbot, aquaculture salmon and lobster exports have increased by $22m (+55%), $65m (+15 %) and $40m (+4%), respectively.
On the other hand, snow crab exports decreased by $171m (-26%), due to a market price that dropped to an average of $9.08/kg in 2005 after having exceeded $12/kg Footnote 1 in 2003-2004. Rock crab and Pacific Dungeness crab have followed a similar trend with a $104m (-40%) decrease compared to 2004. Finally, Pacific halibut and scallop also had a poor year in 2005, with exports decreasing by $40m (-40%) and $23m (-18%), respectively.
The provinces of Nova Scotia, British Columbia, Newfoundland and Labrador and New Brunswick were the main exporters of seafood in Canada in 2005. Each of those provinces' seafood exports value exceeded $800m, and together, they amounted to 87 % of the total value of Canadian seafood exports in 2005.
Figure 4.1: Total value of Canadian seafood exports by province, 2003-2005
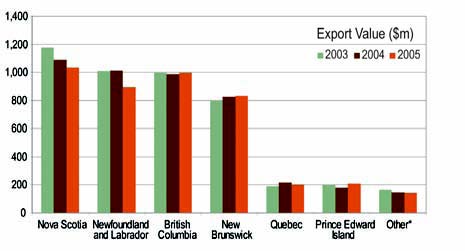
*Ontario, Manitoba, Saskatchewan, Alberta, Northwest Territories, Yukon, Nunavut. Source: Statistics Canada, International Trade Division.
The main markets for Canadian fish and seafood are the United States, Japan and European countries. The United States remains the largest among these markets. Between 2003 and 2005, the US market has absorbed on average two thirds of Canadian sea product exports (in terms of value). The European market (mainly the United Kingdom and Denmark) came second with 14% of the export value, followed by Japan with 11%. Finally, 9% of Canadian exports of fish and seafood went to China in 2005.
Figure 4.2: Total value of Canadian seafood exports by major markets, 2003-2005
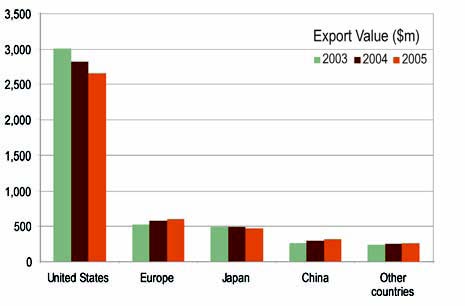
Source: Statistics Canada, International Trade Division.
Sockeye, Pink and Chum salmon exports from British Columbia and northern shrimp, spiny dogfish and mackerel exports from the Atlantic provinces mainly went to the European market in 2005. As for the US market, it absorbed most Canadian exports of lobster, farmed salmon, Chinook and Coho salmon, scallop, snow crab, redfish and most groundfish, except for hake. Finally, Japan was the main destination for herring, sea urchin, albacore tuna, Pacific Dungeness crab and sablefish.
Figure 4.3: Share (%) of the value of Canadian exports by major markets, 2003-2005.
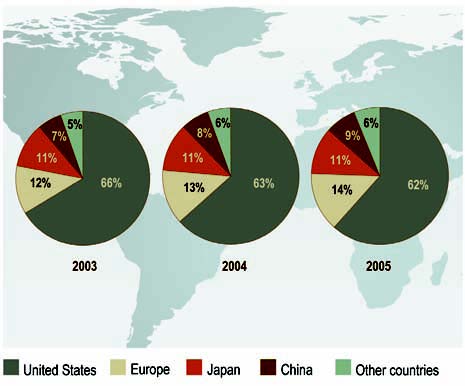
Source: Statistics Canada, International Trade Division.
Between 2003 and 2005, the share of the total export value of Canadian fish and seafood destined for the United States decreased from 66% to 62%, while that of Canadian exports to Europe has risen from 12% in 2003 to 14% in 2005.
One of the more probable causes of this decrease of Canadian seafood exports to the United States is the exchange rate, since over the past three years; the US dollar has greatly depreciated as compared to the Canadian dollar. In January 2003, Canadian exporters netted 1.54 Canadian dollars per U.S. dollar; while in December 2005, they received only 1.16 Canadian dollars, which represents a 25% loss. By way of comparison, the value of the Euro has remained more stable as compared to the Canadian dollar. This development made the European market more attractive to Canadian exporters, and partly explains the increase in exports to this market between 2003 and 2005.
Figure 4.4: Movement of exchange rates between the Canadian dollar and the US dollar, the Euro and the Japanese Yen, 2002/01-2006/01
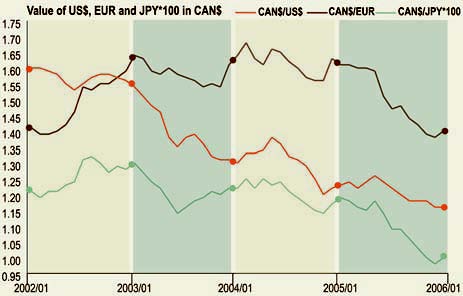
Source: Bank of Canada.
4.2 Imports
Canadian imports of marine, freshwater and aquaculture products have reached a total value of $2.07 bn in 2005, which represents a slight increase of $17m (+1%) compared to 2004. The main imported species were shrimp, lobster, tuna, salmon, cod and haddock. Together, these species represented more than half the total value of Canadian fish imports in 2005.
| Species | Import Value ($m) | |||
|---|---|---|---|---|
| 2003 | 2004 | 2005 | % change
2004-2005 |
|
| Groundfish | 359 | 322 | 284 | -12% |
| Cod, Haddock | 163 | 139 | 109 | -22% |
| Halibut | 93 | 83 | 84 | 1% |
| Other | 103 | 100 | 92 | -8% |
| Pelagic fish | 375 | 404 | 386 | -4% |
| Herring, Mackerel | 34 | 32 | 31 | -3% |
| Salmon, Farmed | 34 | 36 | 28 | -21% |
| Salmon, Pacific | 166 | 180 | 171 | -5% |
| Tuna | 123 | 140 | 138 | -1% |
| Other | 18 | 16 | 18 | 10% |
| Shellfish | 871 | 887 | 907 | 2% |
| Lobster | 225 | 206 | 215 | 4% |
| Crab, snow | 2 | 10 | 2 | -82% |
| Crab, other | 48 | 51 | 72 | 40% |
| Shrimp | 390 | 409 | 391 | -4% |
| Scallop | 50 | 42 | 60 | 45% |
| Clams | 35 | 44 | 38 | -12% |
| Other | 120 | 125 | 128 | 3% |
| Other marine species | 372 | 370 | 409 | 11% |
| Freshwater fish | 70 | 72 | 85 | 17% |
| Total | 2,047 | 2,055 | 2,071 | 1% |
Source: Statistics Canada, International Trade Division.
The import value of scallop, lobster and king crab has increased by $51m in 2005, while that of farmed salmon, cod and shrimp has decreased by $66m.
The provinces of Ontario, British Columbia, New Brunswick and Quebec were the main importers of seafood in Canada in 2005. Together, they accounted for 88 % of the total value of Canadian seafood imports in 2005.
Figure 4.5: Total value of Canadian seafood imports by province, 2003-2005
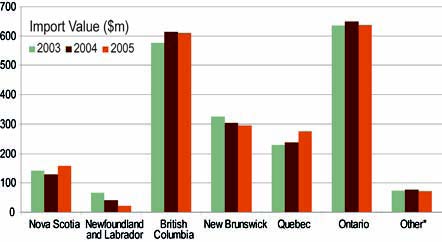
*Prince Edward Island, Manitoba, Saskatchewan, Alberta, Yukon. Source: Statistics Canada, International Trade Division.
Slightly more than 40% of the total value of Canadian imports of fish and seafood came from the United States in 2005, for a total of $862m. China came second with 16% of the total import value, followed by Thailand with 12%, and then Vietnam and Chile with 4% each.
Figure 4.6: Total value of Canadian seafood imports by major markets, 2003-2005
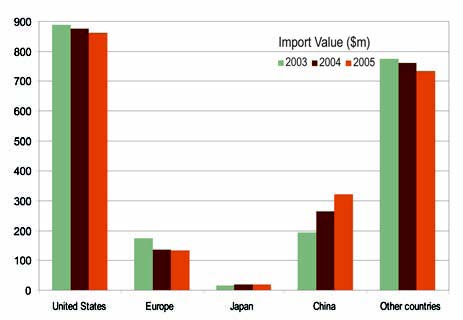
Source: Statistics Canada, International Trade Division.
- Date modified: