
Fisheries and Oceans Canada - Quarterly financial report for the quarter ended December 31, 2022
Table of contents
- Introduction
- Highlights of fiscal quarter and the fiscal year-to-date (YTD) results
- Risks and uncertainties
- Significant changes in relation to operations, personnel and programs
- Approval by senior officials
- Appendix
1. Introduction
This quarterly financial report has been prepared as required by section 65.1 of the Financial Administration Act. The quarterly report should be read in conjunction with the current year’s Main Estimates, Supplementary Estimates (A), and Supplementary Estimates (B).
This quarterly report has not been subject to an external audit or review.
Further details on Fisheries and Oceans Canada’s authority, mandate and programs may be found in the Departmental Plan.
1.1 Basis of presentation
This quarterly report has been prepared using an expenditure basis of accounting. The accompanying Statement of Authorities includes Fisheries and Oceans Canada’s spending authorities granted by Parliament and those used by the Department consistent with the 2022-23 Main Estimates, Supplementary Estimates (A), Supplementary Estimates (B), and the Operating and Capital Budget Carry Forwards.
The authority of Parliament is required before money can be spent by the Government. Approval is given in the form of annually approved limits through appropriation acts or through legislation in the form of statutory spending authority for specific purposes.
The Department uses the full accrual method of accounting to prepare and present its annual departmental financial statements that are part of the departmental results reporting process. However, the spending authorities voted by Parliament remain on an expenditure basis.
2. Highlights of the fiscal quarter and the fiscal year-to-date (YTD) results
The following section highlights the financial results and provides explanations as at December 31, 2022, compared to the same period last year.
| 2021-22 Authorities as at December 31, 2021 | 2022-23 Authorities as at December 31, 2022 | Variance in Authorities | Expenditures during the quarter ended December 31, 2021 |
Expenditures during the quarter ended December 31, 2022 |
Variance in Expenditures | |
|---|---|---|---|---|---|---|
| Vote 1 – Net Operating expenditures | 2,069,553 | 2,141,265 | 71,712 | 491,301 | 556,005 | 64,704 |
| Vote 5 – Capital expenditures | 1,342,281 | 1,471,504 | 129,223 | 210,777 | 264,375 | 53,598 |
| Vote 10 – Grants and Contributions | 1,261,757 | 964,910 | (296,847) | 341,501 | 69,935 | (271,566) |
| Statutory Authorities | 178,136 | 189,724 | 11,588 | 42,088 | 45,092 | 3,004 |
| Total | 4,851,727 | 4,767,403 | (84,324) | 1,085,667 | 935,407 | (150,260) |
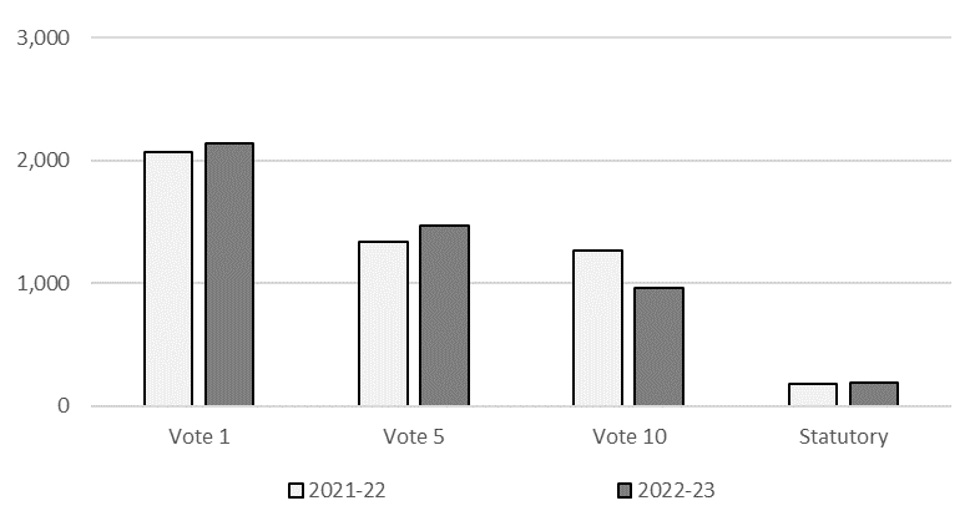
2.1 Significant changes in authorities
The total budgetary authorities available for use decreased by $84.3 million (1.7%) from the previous fiscal year:
- Vote 1 authorities increased by $71.7 million
- Vote 5 authorities increased by $129.2 million
- Vote 10 authorities decreased by $296.8 million
- Statutory authorities increased $11.6 million
Comparison of net budgetary authorities by vote as at December 31 of fiscal years 2021-22 and 2022-23 (in millions of dollars)
The following table provides a detailed explanation of these changes.
| Explanation of Changes (2022-23 compared to 2021-22) |
Change (thousands of dollars) |
|---|---|
| Vote 1 – Net Operating | |
| Funding for the Pacific Salmon Strategy Initiative | 49,850 |
| Funding to extend the lease of the emergency towing vessels on the West Coast and to complete the National Strategy on Emergency Towing | 26,693 |
| Funding for the Small Craft Harbours Program | 26,384 |
| Planned funding profile change for the Oceans Protection Plan | 16,493 |
| Funding for signed collective agreements and the reimbursement of paylist expenditures | 14,629 |
| Funding to implement Canada's new marine conservation targets | 12,923 |
| Funding for Federal Contaminated Sites | 6,992 |
| Incremental change in the Operating Budget Carry Forward | 6,327 |
| Sunsetting funding to support self-employed fish harvesters in Canada affected by COVID-19 | (9,511) |
| Planned funding profile change for the Trans Mountain Expansion Project | (11,218) |
| Planned funding profile change for Canadian Coast Guard's fleet recapitalization projects | (26,708) |
| Planned funding profile change for the Big Bar landslide | (35,618) |
| Other Departmental Adjustments | (5,524) |
| Sub-total Net Operating | 71,712 |
| Vote 5 – Capital | |
| Funding for the Small Craft Harbours Program | 120,446 |
| Incremental change in the Capital Budget Carry Forward | 42,964 |
| Funding for the Pacific Salmon Strategy Initiative | 42,156 |
| Planned funding profile change for the Trans Mountain Expansion Project | 15,120 |
| Planned funding profile change for the Oceans Protection Plan | (15,310) |
| Planned funding profile change for the Big Bar landslide | (37,900) |
| Planned funding profile change for Canadian Coast Guard's fleet recapitalization projects | (43,068) |
| Other Departmental Adjustments | 4,815 |
| Sub-total Capital | 129,223 |
| Vote 10 – Grants and Contributions | |
| Funding for the Pacific Salmon Strategy Initiative | 76,098 |
| Funding to implement Canada's new marine conservation targets | 14,193 |
| Funding for the Nature Legacy Initiative | 4,384 |
| Planned funding profile change for the Oceans Protection Plan | (7,111) |
| Sunsetting funding to support self-employed fish harvesters in Canada affected by COVID-19 | (121,300) |
| Planned funding profile change for Indigenous programs | (264,384) |
| Other Departmental Adjustments | 1,273 |
| Sub-total Grants and Contributions | (296,847) |
| Statutory | |
| Sub-total Statutory | 11,588 |
| Total Authorities | (84,324) |
2.2 Significant changes in expenditures
In the third quarter of 2022-23, total budgetary expenditures have decreased by $150.3 million (13.8%) compared to the same period in the previous year:
- Vote 1 expenditures increased by $64.7 million
- Vote 5 expenditures increased by $53.6 million
- Vote 10 expenditures decreased by $271.6 million
- Statutory payments increased by $3.0 million
Comparison of authorities used by vote during the third quarter of fiscal years 2021-22 and 2022-23 (in millions of dollars)
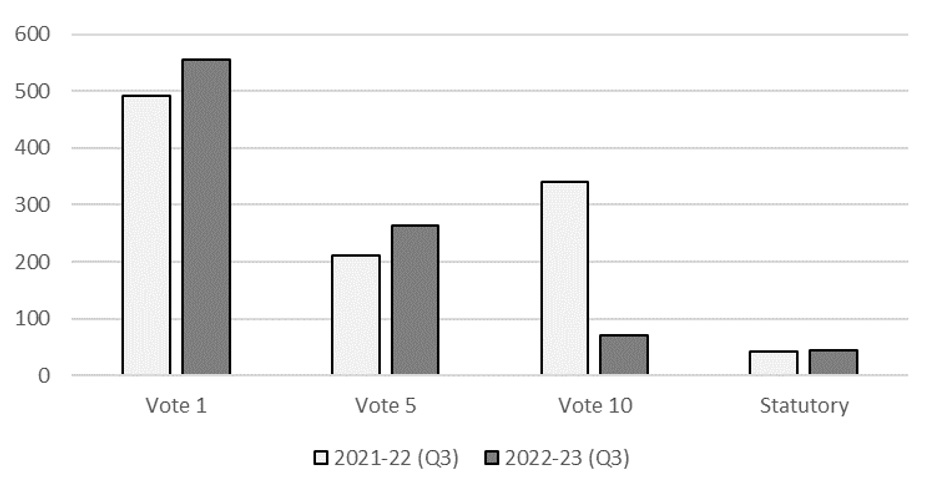
In the third quarter of 2022-23, total budgetary expenditures amounted to $935.4 million compared to $1,085.7 million reported in the same quarter of 2021-22, which represents an decrease of $150.3 million or 13.8%.
- Vote 1 - Net Operating expenditures (increase of $64.7 million or 13.2%)
This is primarily due to an increase in personnel expenditures, corrections to revenues, increased travel costs due to reduced COVID-19 restrictions as well as timing differences in the reallocation of financial transactions between departments.
- Vote 5 - Capital expenditures (increase of $53.6 million or 25.4%)
This is primarily due to an increase in costs related to the implementation of various Budget 2021 Small Craft Harbours projects as well as construction engineering consulting costs for vessel life extension and the Polar Icebreaker projects.
- Vote 10 - Grants and Contributions (decrease of $271.6 million or 79.5%)
This decrease is primarily due to the payment of a large contribution agreement during the last year’s third quarter, which is related to advancing reconciliation on Indigenous rights and fisheries issues.
The net increase by standard object is mainly attributed to:
- Personnel (increase of $20.4 million)
This increase is in line with additional funding provided to the Department which has increased its complement of employees to deliver on the implementation of new programs.
- Transportation and Communications (increase of $10.1 million)
This variance is mainly explained by increased travel costs due to reduced COVID-19 restrictions.
- Professional and Special Services (increase of $34.2 million)
This is primarily due to costs related to remediation of contaminated sites, real estate services for real property projects, helicopter maintenance and consulting costs for vessel life extension and the Polar Icebreaker project. This is partially offset by a reduction of on-site work associated with the Big Bar landslide project as the scope of project is under review.
- Repair and Maintenance (decrease of $17.5 million)
This variance is primarily due to dry docking and refit work related to CCG Vessels as well as Medium Icebreakers Refurbishment projects completed last year.
- Acquisition of Land, Buildings and Works (increase of $30.6 million)
This variance is mainly attributed to the implementation of various Budget 2021 Small Craft Harbours projects which were approved late last year.
- Acquisition of Machinery and Equipment (increase of $9.9 million)
This increase is primarily attributed to retrofit costs for the helicopter program as well as CCG environmental response equipment.
- Transfer Payments (decrease of $271.1 million)
This decrease is primarily due to the payment of a large contribution agreement during last year’s third quarter, which is related to advancing reconciliation on Indigenous rights and fisheries issues.
- Other Subsidies and Payments (increase of $73.3 million)
This increase is primarily due to a timing difference in the processing of financial transactions between departments
- Sales of Goods and Services (increase of $46.4 million)
This increase is primarily attributable to corrections to revenues in our financial system from previous quarters
3. Risks and uncertainties
Fisheries and Oceans Canada operates in a dynamic environment that is affected by a number of factors, including: increased northern development; expansion of navigable waters; climate change; demographics; technological advances; changing maritime safety and security demands; and global geopolitical and economic conditions. The Department continues to assess how it conducts its business, provides services and delivers its programs to meet client and stakeholders needs. The Department maintains a Departmental Risk Profile which assesses corporate strategic risks, which if not addressed, could impair DFO-CCG’s ability to deliver on its mandate and achieve results under the Department’s core responsibilities. Additional information regarding the Department’s key risk areas is presented in the 2022-23 Departmental Plan.
Certain risks would have financial impacts should they materialize such as affecting the timing of transfer payments which lies outside the control of the Department and could require funds to be shifted to future years to meet program requirements. To minimize these impacts, the Department continuously monitors its program funding and expenditures throughout the year.
4. Significant changes in relation to operations, personnel and programs
The following changes in personnel were made since the last published quarterly report:
- The appointment of Richard Goodyear as Assistant Deputy Minister and Chief Financial Officer, Chief Financial Officer Sector, as of October 12, 2022.
- The appointment of Annette Gibbons as Deputy Minister of Fisheries and Oceans Canada, as of October 31, 2022.
- The appointment of Kevin Brosseau as Associate Deputy Minister of Fisheries and Oceans Canada, as of November 14, 2022.
5. Approval by senior officials
Approved by:
Original signed by
_________________________
Annette Gibbons,
Deputy Minister
Ottawa, Canada
Original signed by
_________________________
Richard Goodyear,
Chief Financial Officer
Ottawa, Canada
6. Appendix
Table 1: Statement of authorities (unaudited)
(in thousands of dollars)
| Fiscal year 2021-22 | Fiscal year 2022-23 | |||||
|---|---|---|---|---|---|---|
| Total available for use for the year ending March 31, 2022* | Year to date used at quarter-end | Used during the quarter ended December 31, 2021 | Total available for use for the year ending March 31, 2023* | Year to date used at quarter-end | Used during the quarter ended December 31, 2022 | |
| Vote 1 – Net Operating expenditures | 2,069,553 | 1,354,849 | 491,301 | 2,141,265 | 1,468,177 | 556,005 |
| Vote 5 – Capital expenditures | 1,342,281 | 429,018 | 210,777 | 1,471,504 | 579,970 | 264,375 |
| Vote 10 – Grants and Contributions | 1,261,757 | 469,016 | 341,501 | 964,910 | 159,115 | 69,935 |
| Statutory Authorities | ||||||
| Statutory - Contributions to employee benefit plans | 178,045 | 126,218 | 42,073 | 189,631 | 134,847 | 44,949 |
| Statutory - Minister of Fisheries and Oceans – Salary and motor car allowance | 91 | 58 | 15 | 93 | 69 | 23 |
| Statutory - Spending of proceeds from the disposal of surplus Crown assets | 0 | 0 | 0 | 0 | 115 | 76 |
| Statutory – Refunds of amounts credited to revenues in previous years | 0 | 0 | 0 | 0 | 47 | 44 |
| Statutory - Payments to support Canada's fish harvesters pursuant to the Public Health Events of National Concern Payments Act | 0 | 0 | 0 | 0 | 0 | 0 |
| Statutory - Payments to the Canadian Seafood Stabilization Fund pursuant to the Public Health Events of National Concern Payments Act | 0 | 0 | 0 | 0 | 0 | 0 |
| Total Statutory Authorities | 178,136 | 126,276 | 42,088 | 189,724 | 135,078 | 45,092 |
| Total Authorities | 4,851,727 | 2,379,159 | 1,085,667 | 4,767,403 | 2,342,340 | 935,407 |
* Includes only Authorities available for use and granted by Parliament at quarter-end.
Table 2: Departmental budgetary expenditures by standard object (unaudited)
(in thousands of dollars)
| Fiscal year 2021-22 | Fiscal year 2022-23 | |||||
|---|---|---|---|---|---|---|
| Planned expenditures for the year ending March 31, 2022* | Year to date used at quarter-end | Expended during the quarter ended December 31, 2021 | Planned expenditures for the year ending March 31, 2023* | Year to date used at quarter-end | Expended during the quarter ended December 31, 2022 | |
| Expenditures: | ||||||
| Personnel | 1,401,929 | 1,041,484 | 355,759 | 1,478,708 | 1,089,993 | 376,113 |
| Transportation and communications | 107,913 | 39,060 | 17,954 | 106,230 | 69,975 | 28,060 |
| Information | 4,213 | 2,614 | 1,213 | 4,320 | 4,458 | 2,443 |
| Professional and special services | 733,312 | 399,933 | 189,858 | 785,086 | 480,871 | 224,041 |
| Rentals | 40,455 | 30,594 | 14,795 | 50,187 | 44,695 | 17,769 |
| Repair and maintenance | 217,386 | 173,972 | 92,635 | 208,732 | 186,601 | 75,160 |
| Utilities, materials and supplies | 145,102 | 71,455 | 38,393 | 151,682 | 111,034 | 40,404 |
| Acquisition of land, buildings and works | 412,232 | 35,350 | 21,377 | 373,025 | 100,845 | 51,986 |
| Acquisition of machinery and equipment | 528,390 | 86,151 | 34,771 | 642,774 | 92,885 | 44,622 |
| Transfer payments | 1,261,757 | 416,988 | 339,473 | 964,910 | 157,602 | 68,421 |
| Other subsidies and payments | 39,049 | 110,509 | (41,990) | 41,760 | 30,272 | 31,328 |
| Public Debt Charges | 0 | 0 | 0 | 0 | 0 | 0 |
| Total gross budgetary expenditures | 4,891,738 | 2,408,110 | 1,064,238 | 4,807,414 | 2,369,231 | 960,347 |
| Less Revenues netted against expenditures: | ||||||
| Sales of goods and services | 40,011 | 28,951 | (21,429) | 40,011 | 26,891 | 24,940 |
| Total Revenues netted against expenditures | 40,011 | 28,951 | (21,429) | 40,011 | 26,891 | 24,940 |
| Total net budgetary expenditures | 4,851,727 | 2,379,159 | 1,085,667 | 4,767,403 | 2,342,340 | 935,407 |
* Includes only Authorities available for use and granted by Parliament at quarter-end.
- Date modified: