
A3 - DFO Financial Outlook
Context
- Present the financial overview, as a whole and by individual Vote, for the Fisheries and Oceans Canada.
- All funding levels presented for 2026-27 and beyond reflect anticipated reference levels, based on planned spending requested at the time of Main Estimates.
Total Planned Authorities
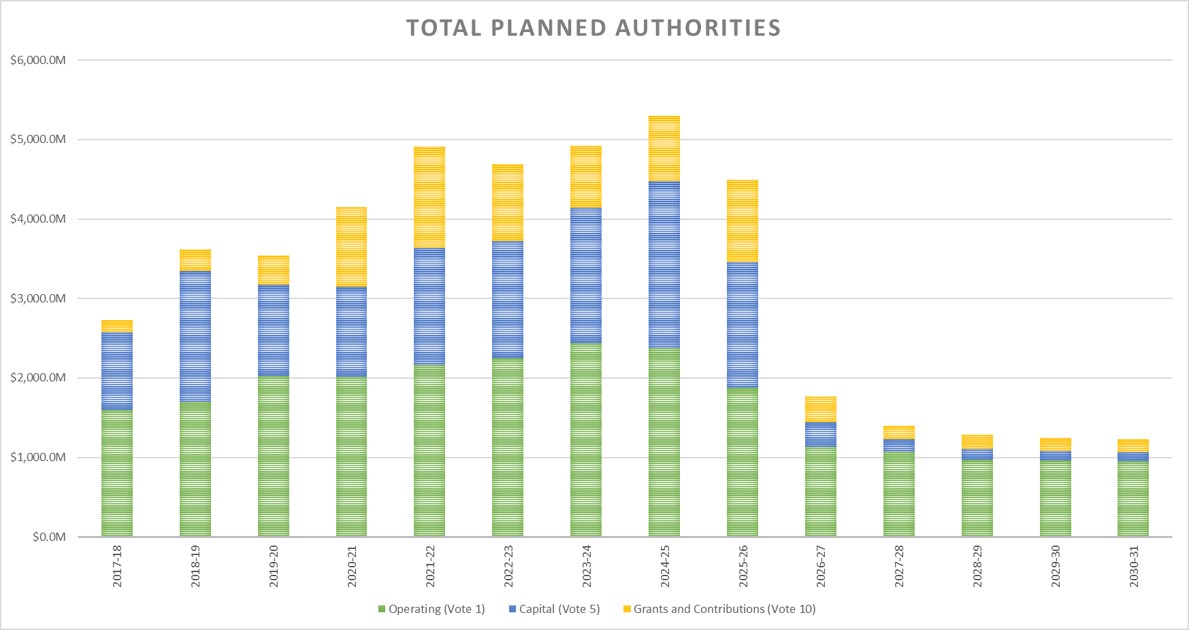
Figure 1: Total Planned Authorities (in millions of dollars) - Text version
| Vote | 2017-18 | 2018-19 | 2019-20 | 2020-21 | 2021-22 | 2022-23 | 2023-24 | 2024-25 | 2025-26 | 2026-27 | 2027-28 | 2028-29 | 2029-30 | 2030-31 |
|---|---|---|---|---|---|---|---|---|---|---|---|---|---|---|
| Operating (Vote 1) | $1,596.3M | $1,700.9M | $2,028.1M | $2,014.5M | $2,165.8M | $2,248.1M | $2,433.3M | $2,375.6M | $1,882.0M | $1,129.6M | $1,070.8M | $968.0M | $961.2M | $949.1M |
| Capital (Vote 5) | $972.8M | $1,641.3M | $1,141.3M | $1,129.8M | $1,467.2M | $1,471.7M | $1,709.2M | $2,099.0M | $1,570.6M | $312.7M | $152.7M | $136.1M | $116.4M | $111.8M |
| Grants and Contributions (Vote 10) | $159.7M | $272.9M | $374.9M | $1,004.8M | $1,280.8M | $967.4M | $775.6M | $820.6M | $1,044.2M | $328.5M | $178.9M | $183.5M | $169.9M | $164.9M |
| Total | $2,728.8M | $3,615.1M | $3,544.3M | $4,149.1M | $4,913.7M | $4,687.2M | $4,918.1M | $5,295.2M | $4,496.8M | $1,770.7M | $1,402.4M | $1,287.6M | $1,247.5M | $1,225.9M |
Note:
- 2017-18 to 2024-25 authorities represent year-end authorities, as per Public Accounts
- Does not reflect potential future renewal of sunsetters
- Excludes statutory authorities
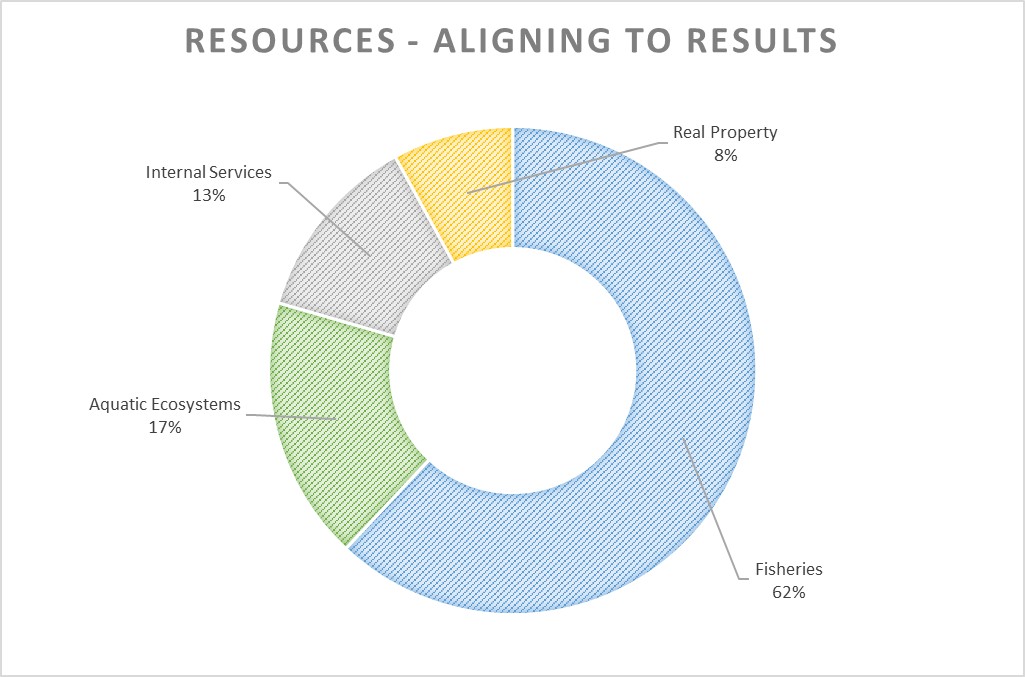
Figure 2: Resources – Aligning to Results - Text version
| Result | Percentage |
|---|---|
| Fisheries | 62% |
| Aquatic Ecosystems | 17% |
| Internal Services | 13% |
| Real Property | 8% |
| Total | 100% |
- Fisheries and Oceans Canada (DFO) is a highly decentralized department, managing a planned 2026-27 budget of ~$1.8 billion, excluding $115.0 million in statutory authorities.
- As the Department awaits funding decisions related to Budget 2025, reference levels, in the interim, will benefit from new permanent funding to support economic growth through effective implementation of the Fisheries Act.
- Funding levels in 2026-27 and beyond reflect the transition of the Canadian Coast Guard to the Department of National Defence.
- To meet Comprehensive Expenditure Review targets, DFO conducted a comprehensive and evidence-based review of all programing areas and regions. The Department has ensured that spending is sustainable and directed to programs and activities that are cost-effective, complementary to other government programming, and aligned with the Government’s core mandate and priorities
Vote 1 – Planned Operating
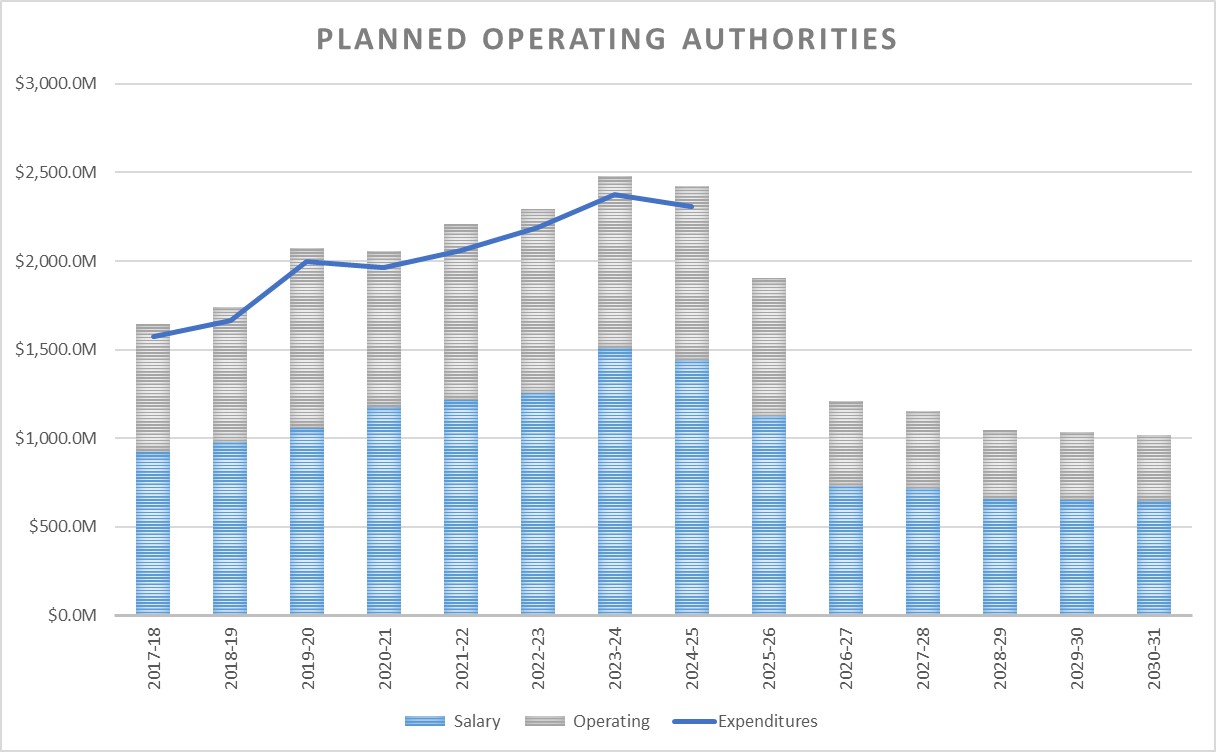
Figure 1: Planned Operating Authorities (in millions of dollars) - Text version
| Vote 1 | 2017-18 | 2018-19 | 2019-20 | 2020-21 | 2021-22 | 2022-23 | 2023-24 | 2024-25 | 2025-26 | 2026-27 | 2027-28 | 2028-29 | 2029-30 | 2030-31 |
|---|---|---|---|---|---|---|---|---|---|---|---|---|---|---|
| Salary | $923.2M | $982.0M | $1,060.5M | $1,176.7M | $1,214.6M | $1,254.7M | $1,512.0M | $1,441.1M | $1,126.2M | $690.0M | $674.1M | $619.8M | $615.7M | $614.4M |
| Operating | $721.0M | $760.1M | $1,012.3M | $878.7M | $992.1M | $1,040.4M | $967.6M | $981.1M | $776.7M | $439.6M | $396.7M | $348.2M | $345.5M | $334.7M |
| Total Authorities | $1,644.2M | $1,742.1M | $2,072.8M | $2,055.4M | $2,206.7M | $2,295.2M | $2,479.6M | $2,422.2M | $1,903.0M | $1,129.6M | $1,070.8M | $968.0M | $961.2M | $949.1M |
| Expenditures | $1,575.2M | $1,663.0M | $1,999.3M | $1,961.0M | $2,059.8M | $2,191.7M | $2,373.4M | $2,305.9M | - | - | - | - | - | - |
Note
- Does not reflect potential future renewal of sunsetters
- Excludes statutory authorities
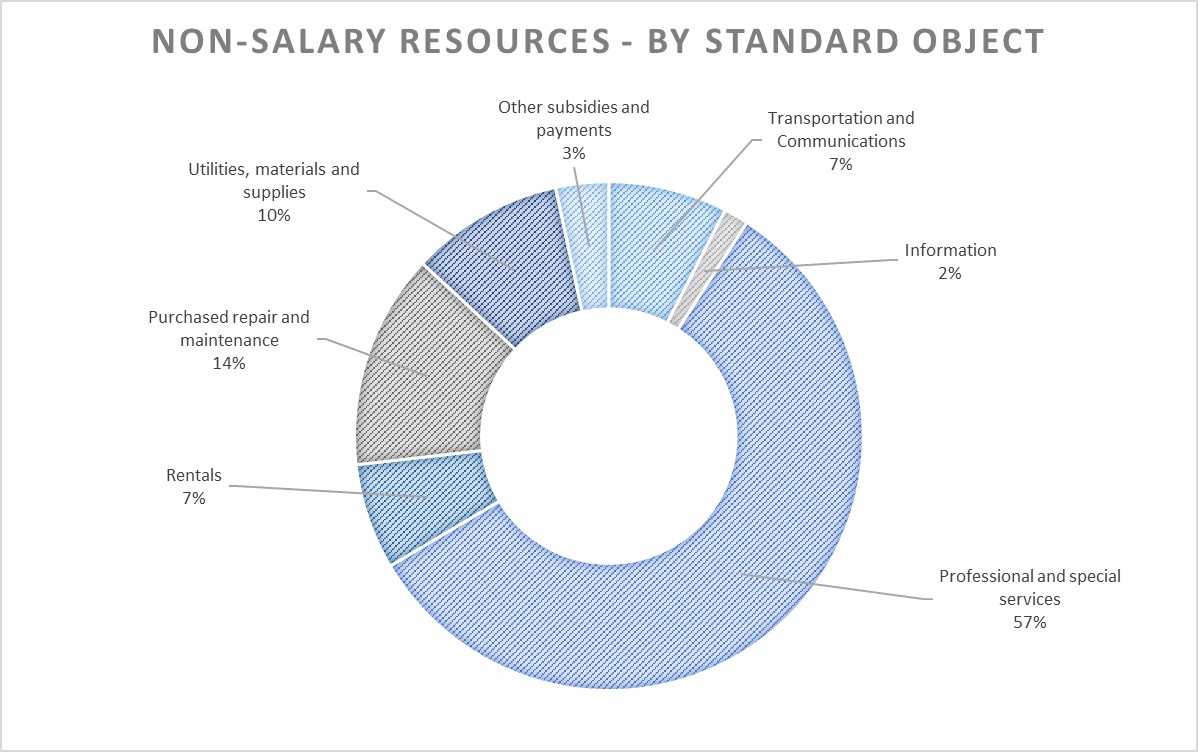
Figure 2: Non-Salary Resources – By Standard Object - Text version
| Standard Object | Percentage |
|---|---|
| Transportation and Communications | 7% |
| Information | 2% |
| Professional and special services | 57% |
| Rentals | 7% |
| Purchased repair and maintenance | 14% |
| Utilities, materials and supplies | 10% |
| Other subsidies and payments | 3% |
- Total anticipated operating authorities for 2026-27 are $1,129.6 million, as requested through the Main Estimates for 2026-27.
- Salary makes up approximately 40 per cent of operating spending with approximately 6,890 FTEs planned for 2026-27, across Canada.
- In 2026-27, close to 57 per cent of non-salary spending will be on professional and special services to support scientific research and engineering and architectural requirements.
- The Department also benefits from new funding for previously signed collective agreements and Indigenous programs.
Vote 5 – Planned Capital
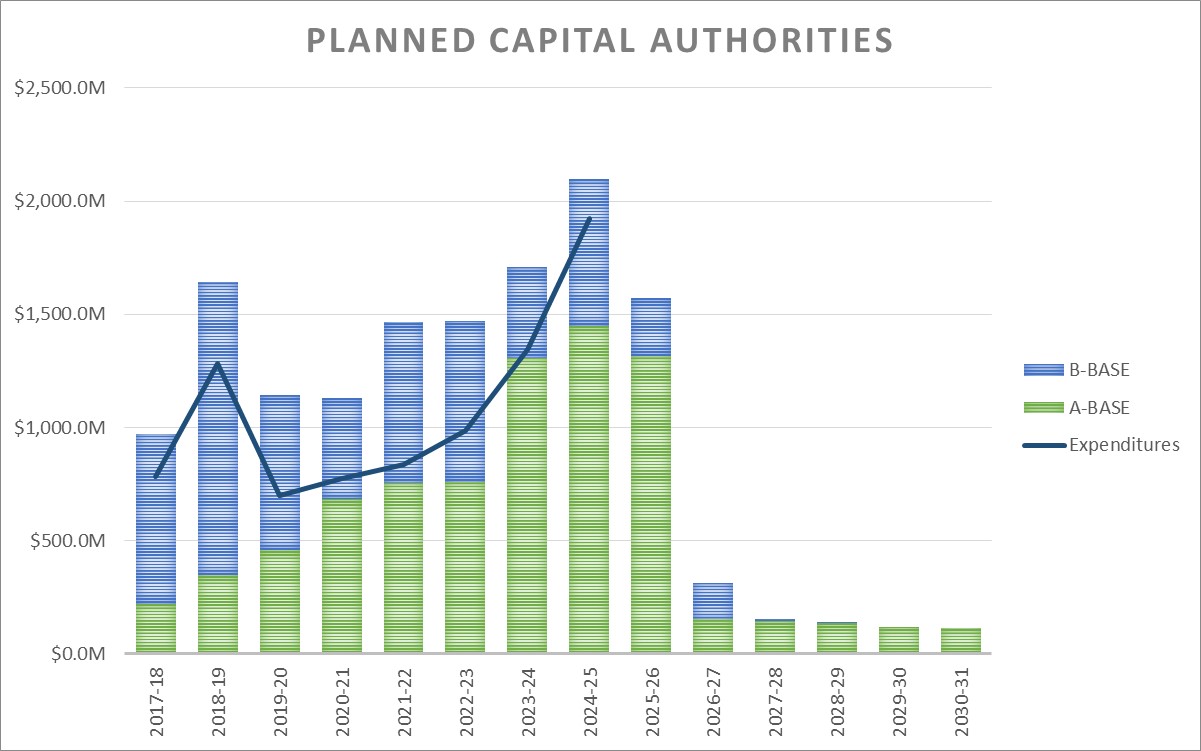
Figure 1: Planned Capital Authorities (in millions of dollars) - Text version
| Vote 5 Funding Type | 2017-18 | 2018-19 | 2019-20 | 2020-21 | 2021-22 | 2022-23 | 2023-24 | 2024-25 | 2025-26 | 2026-27 | 2027-28 | 2028-29 | 2029-30 | 2030-31 |
|---|---|---|---|---|---|---|---|---|---|---|---|---|---|---|
| A-Base | $218.6M | $347.4M | $457.0M | $685.4M | $756.8M | $758.1M | $1,305.1M | $1,447.7M | $1,315.3M | $152.2M | $145.2M | $135.4M | $116.4M | $111.8M |
| B-Base | $754.1M | $1,293.9M | $684.3M | $444.4M | $710.4M | $713.5M | $404.2M | $651.3M | $255.3M | $160.4M | $7.5M | $0.7M | $0.0M | $0.0M |
| Total | $972.8M | $1,641.3M | $1,141.3M | $1,129.8M | $1,467.2M | $1,471.7M | $1,709.2M | $2,099.0M | $1,570.6M | $312.7M | $152.7M | $136.1M | $116.4M | $111.8M |
| Expenditures | $783.9M | $1,280.7M | $701.6M | $773.4M | $835.2M | $986.1M | $1,344.5M | $1,923.1M | - | - | - | - | - | - |
Note
- A-Base authorities refer to programs with permanent/ongoing funding, while B-Base authorities reflect temporary funding sources.
- Does not reflect potential future renewal of sunsetters
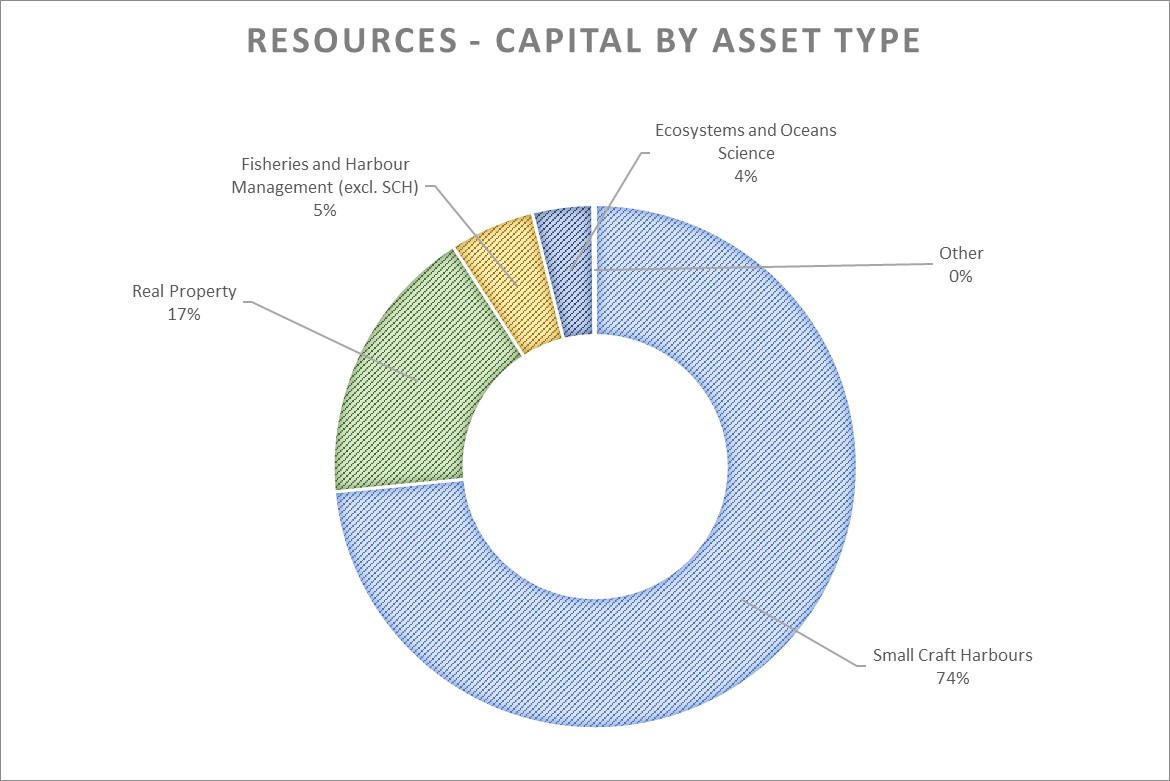
Figure 2: Resources – Capital by Asset Type - Text version
| Asset Type | Percentage |
|---|---|
| Ecosystems and Oceans Science | 4% |
| Small Craft Harbours | 74% |
| Fisheries and Harbour Management (excluding SCH) | 5% |
| Real Property | 17% |
| Other | 0% |
- Total anticipated capital authorities for 2026-27 are $312.7 million, as requested through the Main Estimates for 2026-27.
- Over 90 per cent of capital budget is for investments in the small craft harbours and real property portfolios.
- There is a significant decrease in capital authorities in 2026-2027. This reflects the transition of the Canadian Coast Guard to the Department of National Defence.
- Small craft harbour initiatives announced through Budget 2024 and the 2024 Fall Economic Statement continue to progress. These temporary funding sources are respectively designed to repair and maintain small craft harbours, including those damaged by Hurricane Fiona, through upfront investments in climate resilient infrastructure and the construction of harbours in Arctic Bay.
Planned Grants and Contributions
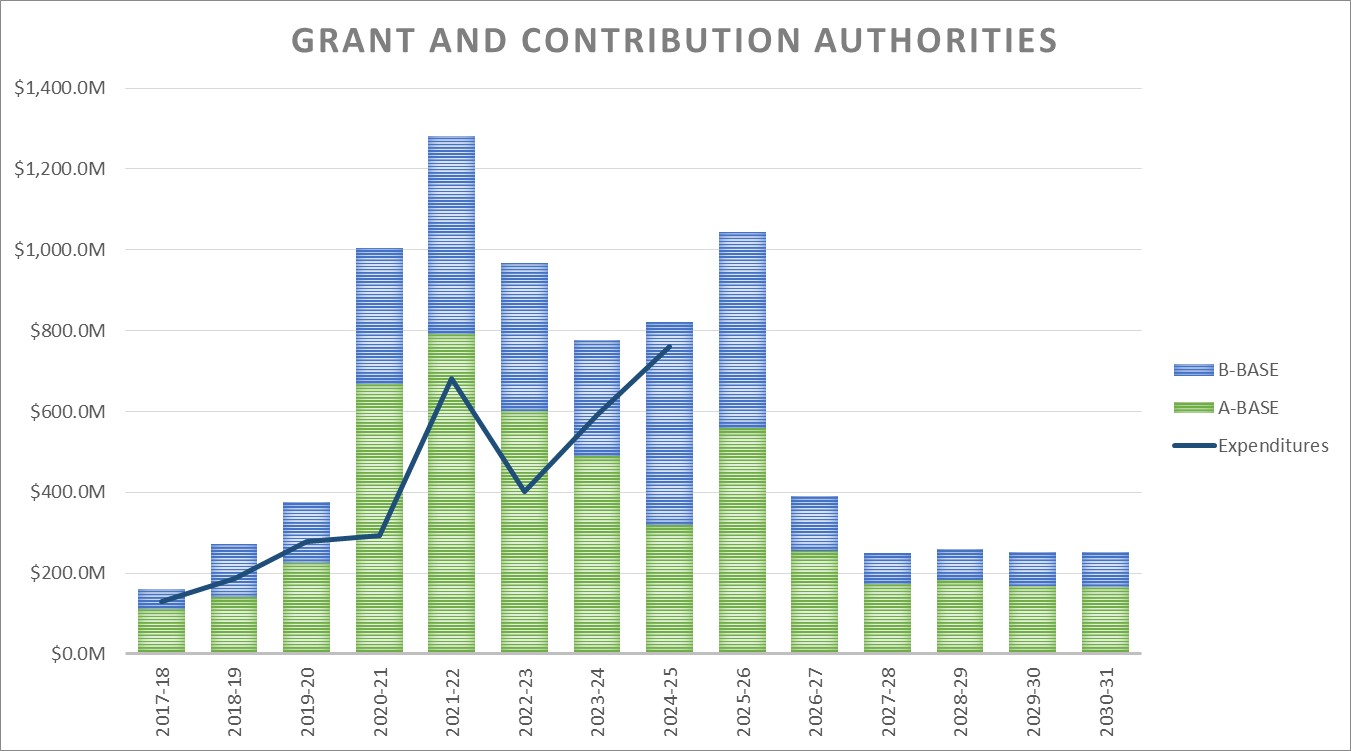
Figure 1: Grant and Contribution Authorities (in millions of dollars) - Text version
| Vote 10 Funding Type | 2017-18 | 2018-19 | 2019-20 | 2020-21 | 2021-22 | 2022-23 | 2023-24 | 2024-25 | 2025-26 | 2026-27 | 2027-28 | 2028-29 | 2029-30 | 2030-31 |
|---|---|---|---|---|---|---|---|---|---|---|---|---|---|---|
| A-Base | $111.3M | $140.7M | $223.7M | $667.7M | $790.4M | $600.2M | $489.5M | $319.4M | $559.9M | $240.2M | $158.3M | $168.5M | $155.0M | $151.5M |
| B-Base | $48.4M | $132.2M | $151.1M | $337.1M | $490.4M | $367.2M | $286.1M | $501.2M | $484.3M | $88.3M | $20.6M | $14.9M | $14.9M | $13.3M |
| Total | $159.7M | $272.9M | $374.9M | $1,004.8M | $1,280.8M | $967.4M | $775.6M | $820.6M | $1,044.2M | $328.5M | $178.9M | $183.5M | $169.9M | $164.9M |
| Expenditures | $128.9M | $185.4M | $279.1M | $291.9M | $681.3M | $402.1M | $591.5M | $761.1M | - | - | - | - | - | - |
Note
- A-Base authorities refer to programs with permanent/ongoing funding, while B-Base authorities reflect temporary funding sources.
- Does not reflect potential future renewal of sunsetters
- Total anticipated authorities for 2026-27 are $328.5 million, as requested through the Main Estimates for 2026-27.
- Authorities increased significantly from 2019-20 to 2021-22, largely due to funding dedicated to Reconciliation Agreements. This funding starts returning to a steadier state as agreements are signed, and larger planned payments are made within the scope of the Indigenous programs
- Funding continues to support reconciliation and Indigenous-led conservation initiatives and right to fish in a pursuit of a moderate livelihood
- Based on our 2026-27 Main Estimates, the Department has 15 Transfer Payment Programs – with Indigenous recipients representing the largest share of planned spending, particularly for initiatives related to aquatic species, aquatic habitats and ecosystems, and oceans science.
Page details
- Date modified: