
Frequently asked questions
On this page:
- State of the Pacific Ocean
- Learn more about Atlantic ecosystems
State of the Pacific Ocean
Recent Findings on What’s Happening in Canada’s Pacific Coastal Waters
Answer:
Fisheries and Oceans Canada is responsible for the management and protection of marine resources along Canada’s West Coast. Since 1999, scientists in the Department’s Pacific region have held an annual State of the Pacific Ocean meeting to present the results of monitoring for the most recent year in the context of previous observations and expected future conditions. These findings are compiled in an annual technical report. The following Q & A highlights some key findings from the 2016 State of the Pacific Ocean meeting, along with related context, presented in five themes:
- What is Happening in the Strait of Georgia?
- The Warmest Year, the Blob, La Niña, and a Series of Unusual Events
- Herring: Little Fish with a Big Food Web Impact
- Iconic Pacific Salmon
- The State of Marine Mammals on Canada’s West Coast
The scientific technical report is also available online at this link: The State of the Physical, Biological and Selected Fishery Resources of Pacific Canadian Marine Ecosystems in 2016, Peter C. Chandler, Stephanie A. King and Jennifer Boldt (Editors).
What is Happening in the Strait of Georgia?
What is the spring bloom in the Strait of Georgia and why is it important?
Answer:
Each spring, phytoplankton in the surface waters of the Strait of Georgia undergo rapid growth, called a bloom, fuelled by nutrients that have accumulated over the winter and increased daylight as the days get longer. These microscopic plants form the foundation of the marine food web, providing food for zooplankton, which are prey for other marine life including salmon smolts and other young or small fish, seabirds, and some marine mammals including Humpback Whales. The region’s entire food web is influenced by the timing and intensity of the plankton bloom, which can also be used as an indicator of salmon survival as the juveniles migrate through the Strait to the ocean. Scientists monitor the changes in the types of phytoplankton and track the amount of phytoplankton biomass (the amount of a particular organism in a given habitat) to assess the health of ecosystems.
How do scientists determine the timing and intensity of the spring phytoplankton bloom?
Answer:
Measuring the rapid increase of phytoplankton in the water with the spring phytoplankton bloom is how scientists track the arrival of the “biological spring” that starts the seasonal round of feeding for living things in the Strait. One of the methods scientists use to assess the timing and intensity of blooms is directly measuring the chlorophyll levels, a green pigment found in most plants including phytoplankton. Chlorophyll absorbs high-energy sunlight and emits a lower energy visible light, called fluorescence. This makes it possible to monitor the spring bloom another way, using flourometers, instruments that measure fluorescence, and relating it to the chlorophyll concentrations in the water.
The spring bloom is a significant indicator of how capable Strait of Georgia waters will be of enabling fish stocks and other species to survive, thrive and increase, in other words, the bloom impacts species “productivity” – the rate of production of new biomass in a given species population. Fisheries and Oceans Canada monitors the bloom in several ways due to its role in productivity. Instruments aboard ferries that travel across the Strait eight times a day measure the fluorescence of the surface water along their route. On cloudless days, satellite images reveal green regions that represent chlorophyll fluorescence. In the central strait, a mooring buoy fitted with a fluorometer records fluorescence every 30 minutes. Scientists extract and analyze chlorophyll from water samples gathered in April during the department’s annual Strait of Georgia water properties survey. Numerical (computer) models have also been developed to simulate the ocean dynamics that trigger the spring bloom. Running the model in a predictive mode enables scientists to forecast when the spring bloom is likely to occur.
When does the spring bloom usually occur in the Strait of Georgia?
Answer:
The spring bloom in the Strait of Georgia generally occurs in mid- to late March, though the timing varies slightly in different areas of the Strait. For example, it typically occurs earlier in the southern region, and later in the northern region. Fisheries and Oceans Canada’s 2016 report on the State of the Pacific Ocean details these differences in time and location.
In 2016, the fluorometers aboard the ferries found the spring phytoplankton bloom started on March 17–18. The peak biomass occurred on March 21, although the size of the bloom was low compared to the previous 13 years of ferry-based measurements. By comparison, the spring bloom was relatively late in 2014 (April 2), while warm calm conditions led to an exceptionally early bloom in 2015 (March 11). Based on 49 years of model simulations, the long-term average timing of the spring bloom in the Strait is March 21.
How does the acidification of water in the Strait of Georgia vary during the year?
Answer:
Each year, about one third of the carbon dioxide (CO2) released by human activities into the atmosphere dissolves in ocean surface waters causing changes to its chemistry. Those changes include reduced pHFootnote 1, commonly referred to as “ocean acidification”—though the term is not entirely accurate since the oceans are actually becoming less alkaline.
Ocean acidification hampers the ability of some marine organisms to form shells and skeletons of calcium carbonate (CaCO3). Since 2014, the Hakai Institute has been using instruments to monitor these conditions in the northern Strait of Georgia. The findings reveal there is seasonal variability with more acidic conditions during the stormy winter periods (around 7.8 pH). In summer, a combination of calmer conditions and higher phytoplankton growth results in lower levels of ocean acidification (pH around 8.2). There are also isolated spikes in acidity during the summer when pH levels can drop to less than 7.7 for several days at a time. These events are associated with strong winds from the northwest and reveal a new variability in the ocean acidification of this region.
Why is the Fraser River so important to the ecology of the Salish Sea?
Answer:
The Strait of Georgia is very deep, reaching more than 400 metres in places. Fresh water flowing out of the Fraser River forms a plume on the surface, over the heavier salt water. The river discharge peaks in mid-July when the snowmelt from the mountains eventually reaches the ocean. However, an early and rapid snowmelt in 2016 exposed marine life in the surface waters to conditions that were fresher than normal in the spring, and saltier than normal in the summer. Fortunately, there was enough rain by fall to create near-normal conditions for the salmon returning to spawn in the Fraser River. The Fraser River also influences the chemistry of the Salish SeaFootnote 2 by introducing sediment, which contributes to high productivity during the spring phytoplankton bloom.
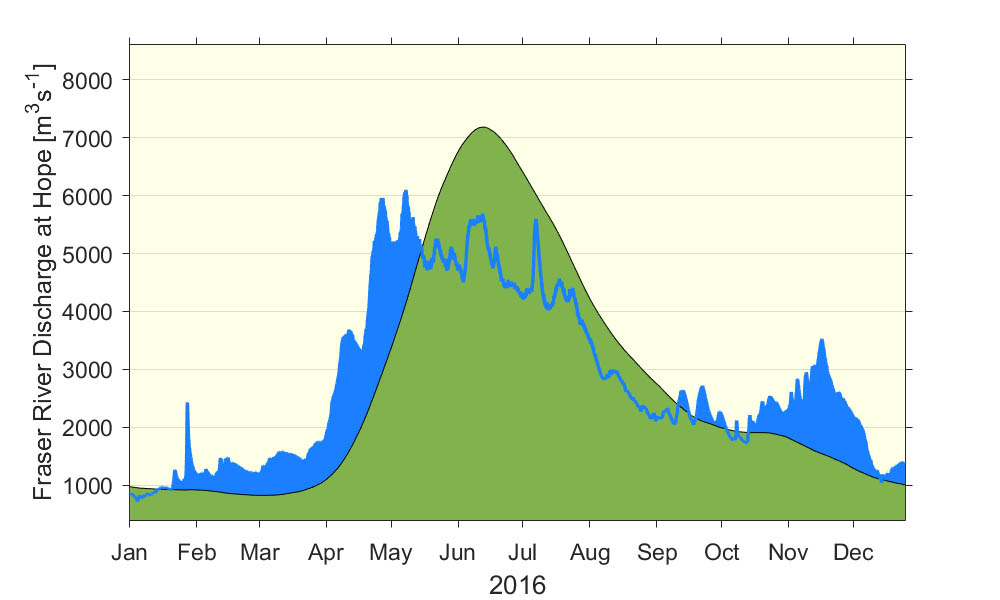
Fraser River discharge at Hope B.C.; 2016 (blue), 104 year average (green). Data source: The Water Survey of Canada. A line graph illustrates the fluctuations in Fraser River discharge in 2016 compared to a 104 year average. The vertical axis at left shows numbers from 0 to 8000 with text that reads “Fraser River Discharge at Hope (m3s-1)”. The horizontal axis shows the 12 months a year with text that reads “2016”. A black line filled with green colour in a bell shape represents the 104 year average discharge. The line increases up to over 7000 m3s-1 in June and July, with levels much lower in the winter, spring and fall months. A blue line filled with the same colour represents the average discharge in 2016. The line increases up to 6000 m3s-1 in the spring and early summer, June and July, with levels much lower in the winter, spring and fall months except for a small increase in November.
What caused surface water in the Strait of Georgia to turn turquoise in the summer of 2016?
Answer:
For a week in August 2016, the surface waters in the southern half of the Strait of Georgia turned a bright turquoise due to a large bloom of coccolithophores, a harmless type of phytoplankton. The shells of these floating plants are made of milky white calcium carbonate, which gave the water its bright colour. Coccolithophore blooms are not uncommon off the west coast of Vancouver, though they rarely occur in the Strait of Georgia. The 2016 bloom could have been triggered by organisms carried to the region by ocean currents. This event is even more unusual since the Strait has relatively low pH waters that are not favourable for this type of phytoplankton.
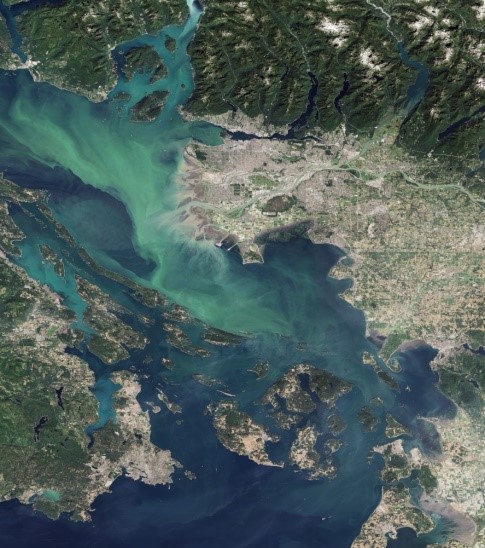
A satellite photo of the south tip of Vancouver Island and Vancouver in British Columba showing the Strait of Georgia. The ocean water is a dark blue colour but a coccolithophore bloom shows as bright teal swirls off the coast of Vancouver and in Howe Sound. The image of the coccolithophore bloom in the Strait of Georgia was captured by the Operational Land Imager on the Landsat 8 satellite on August 19, 2016.
The Warmest Year, the Blob, La Niña, and a Series of Unusual Events
What was the “Blob” in the northeast Pacific Ocean?
Answer:
From 2013 to 2015, a large expanse of unusually warm water in the northeast Pacific Ocean became one of the hottest oceanographic phenomena in recent history and made headlines around the world. In late 2013, satellite data of sea surface temperature revealed the development of an exceptionally warm mass of water, nicknamed the “Blob,” which gradually expanded and persisted for nearly two years. Surface and subsurface temperatures in the “Blob” were well “above normal” (3–4℃ above normal in places) —with normal defined as the 30-year average from 1981 to 2010.
This event, which some are calling a “marine heatwave,” started to cool following a series of cold winter storms across the Gulf of Alaska that began in November 2015. By the end of 2015, sea surface temperatures in the region had cooled to about 1℃ above normal, though relatively warm temperatures persisted at depths of 100 to 200 metres.
Scientists have attributed the development of this out-of-the-ordinary warm water mass to changes in wind and weather patterns over the northeast Pacific beginning in late 2013. Unusually high sea level pressure in the region reduced winds, led to fewer and weaker storms, and decreased waves and wind-driven currents. Those conditions combined to reduce the typical amount of ocean mixing and cooling in the region, enabling the abnormally warm water mass to develop.
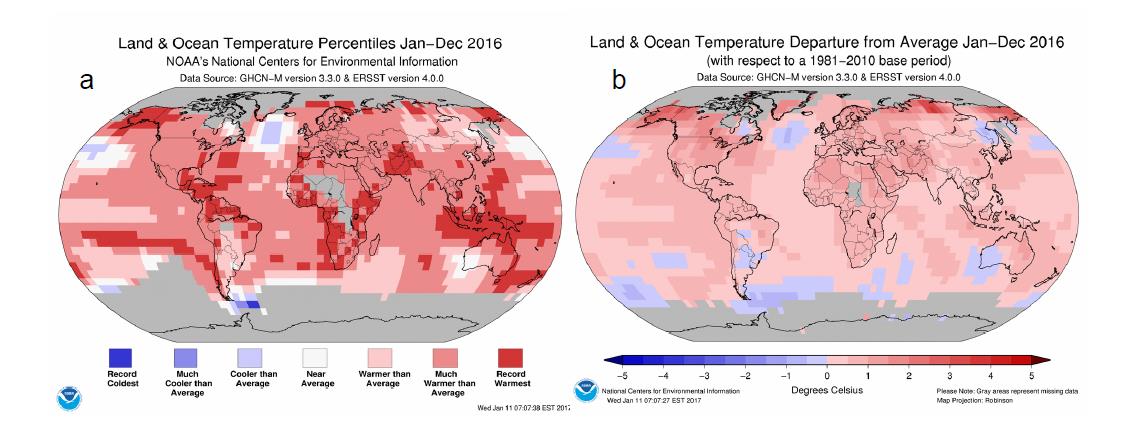
Two illustrated maps of the earth are shown side by side. The globe at left has text above it which reads a) Land and Ocean Temperature Percentiles Jan-Dec 2016. NOAA’s National Centers for Environmental Information. Data Source CHON-M. A legend sits below the globe showing 7 boxes from blue to white to red indicating cold to warm temperatures. Globe a) shows red, light red, pink, white and blue pixelated boxes across various continents. Red pixels sit over Alaska, the Caribbean, the south Pacific ocean, most of Africa, the middle east, and parts of Asia and Australasia. The Arctic and Antarctic are shaded grey.
The globe at right has text above it which reads Land and Ocean Temperature Departure from Average Jan-Dec 2016 (with respect to a 1981-2010 base period). Data Source CHON-M. A legend sits below the globe showing a vertical line with shaded boxes from blue to red indicating cold to warm temperatures from -5 to 5. Text below the vertical coloured line reads “Degrees Celcius”. Globe b) shows red, light red, pink, white and blue shaded areas across various continents. A small amount of red areas are shown near Alaska, and Russia with light red and pink colours shading most of the glove. Blue areas are scattered across the globe. The Arctic and Antarctic are shaded grey.
Panel a: Colours indicate percentiles, with “much warmer/cooler than average” indicating the top and bottom 10%. Source: National Climatic Data Centre/National Oceanographic and Atmospheric Administration, USA. Panel b: Colour bar shows the magnitude of the temperature anomaly scale, with warm colours for relatively warm regions and cool colours for relatively cool regions. Source: National Climatic Data Center of the National Oceanographic and Atmospheric Administration, USA. Both panels: Grey areas represent missing data.
How did the “Blob” affect ecosystems, and was it responsible for the observed algae blooms?
Answer:
The abnormally warm ocean conditions in the northeast Pacific coincided with unusual weather patterns in Canada and elsewhere, and affected regional and local ecosystems in a variety of ways. The timing of the “Blob” also coincided with reports of unusual events in the coastal water of British Columbia, including:
- Goo and changes at the base of the food web: large amounts of gelatinous plankton were observed washing along beaches on the west coast of Vancouver Island. In addition, changes in the size and composition of phytoplankton communities were observed along Line P during the “Blob” years, likely in response to the increase in temperature and changes in nutrient availability. The composition of the offshore phytoplankton community returned to a more normal distribution in 2016.
- Turquoise water and coccolithophorid blooms: A large bloom of coccolithophorids (single-cell phytoplankton or alga) occurred in June along the continental shelf break off Vancouver Island, turning the water a bright turquoise colour. Another bloom occurred in the southern Strait of Georgia and nearby inlets in August. Coccolithophore blooms are not harmful, but may point to ongoing changes in water properties. The reasons for these unexpected events are still under investigation.
- Less nutrition due to shifts in the composition of the zooplankton community: The zooplankton community higher up the food web had fewer subarctic and boreal copepods that are fattier and more energy-rich, and more southern copepods that are less nutritious. This change in species composition, which persisted into 2016, is consistent with warmer ocean temperatures. As ocean conditions continue to cool, it is expected there will be a greater abundance of the fat-rich northern species that are more favourable for fish growth.
- Changes to species ranges: In addition to shifts in phytoplankton and zooplankton species, there was a northward extension in the range of fish species and other marine life more commonly found farther south. For example:
- The number of Humpback Whales sighted in B.C. waters continued to increase.
- Large abundances of juvenile rockfish were observed along the west coast of Vancouver Island.
- High abundances of Northern Anchovy were reported in the Strait of Georgia throughout 2016, and there was a large die-off in the central Strait in January 2017.
- Sightings of unusual shark species were reported, including the first recorded sighting of a Pacific Angel Shark in British Columbia waters. In addition, a Basking Shark was spotted in May 2016 during a Fisheries and Oceans science survey; the Pacific population of Basking Sharks is listed as Endangered.
- Isolated die-offs of sea cucumbers and sea urchins.
Will there be more “Blobs” in the future?
Answer:
An anomaly is a peculiar occurrence that differs in some way from a normal or predictable state. As scientists continue to explore the factors that contributed to this unusual event, it is clear that the “Blob” was one of the largest anomalies in sea surface temperature in Northeast Pacific on historical record. No one knows for sure whether more events like the “Blob” will occur in the future, though some scientists say it is likely.
These exceptionally unusual conditions set in motion a chain of ecosystem events that are likely to cause ongoing impacts on the marine food web and individual species, some of which are yet to be determined. Much remains to be understood about the mechanism that contributed to this anomaly, and whether—or when—it might happen again.
Herring: Little Fish with a Big Food Web Impact
Why are Pacific Herring so important?
Answer:
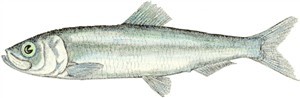
Scientific illustration of a small grey fish with painted scales in white, blue and black as well as a light green eye. Adult Pacific herring are normally about 15-25 cm in length.
A small, silvery fish with a deeply forked tail, Pacific Herring have long played an important role in the ecology, culture and economy of Canada’s Pacific Coast. These slender fish are a cornerstone of the marine food web, providing an important link between the zooplankton they prey on and the wide range of predators that consume them including some Pacific Salmon and other larger fish, seabirds, seals, sea lions, Humpback Whales, and some land mammals such as bears.
The proportion of a predator’s diet that herring comprises varies, from up to 88 percent for Lingcod, 40 percent for Pacific Cod and Pacific Halibut, and 35 percent to 45 percent for pinnipeds (e.g. seals, sea lions, and other fin-footed mammals). Depending on how specialized a predator’s diet is, and its ability to switch to alternate prey, the abundance and condition of herring may affect the growth and abundance of their predators.
Herring support commercial fisheries in some areas of B.C. and have sustained coastal First Nations communities for thousands of years. Changes in herring abundance may affect their availability to commercial fisheries as well as the survival of Coho and Chinook salmon, other fish species, marine mammals, and seabirds. Biomass is the amount of living matter (or a particular organism) in a given habitat. Spawning Stock Biomass is the total weight of all sexually mature fish in the stock. The Department’s fisheries management personnel rely on forecasts of herring biomass — combined with decision tables, performance metrics, harvest rates and other science advice —to set total allowable catches.
How well are Pacific Herring doing in British Columbia waters?
Answer:
The number of new young Pacific Herring entering the population each year is referred to by scientists as the ‘annual recruitment abundance’, and a lot of factors in B.C. waters cause this abundance of new herring to vary considerably from year to year. The variability is largely due to mortality during their first months of life, which can vary by location. In British Columbia, herring are managed as five major and two minor stocks. The five major stocks are Strait of Georgia; west coast of Vancouver Island; Prince Rupert District; Haida Gwaii; and the Central Coast — and the two minor stock areas are called Haida Gwai Area 2W and Area 27.
Important indicators of stock status include herring biomass, recruitment abundance, and the average weight of individual fish in each age class of a particular stock (termed “weight-at-age”). Where the herring are spawning in B.C. waters is also a factor in their success. In 2016, computer modelling was used to estimate, in part, the spawning biomass of herring and the abundance of herring less than two years old. Juvenile herring were also surveyed as part of the Strait’s nearshore ecosystem survey, a long-term monitoring program supported in part by the Pacific Salmon Foundation.
Findings of this research include:
- The spawning biomass of herring in 2016 was near historic high levels in the Strait of Georgia, which is open to herring fishing. Although the abundance of juvenile herring was low in 2016, observations indicate they were in good condition.
- Herring biomass levels varied in other regions along the British Columbia coast, with three major stocks (Haida Gwai, Central Coast, and West of Vancouver Island) experiencing prolonged periods of low biomass despite the absence of fishing.
- The estimates of the average herring biomass for Prince Rupert District, where herring fishing is also open, remained stable from 2014 to 2016.
- There have been recent increases or levelling off in weight-at-age for all stocks, following a declining trend in weight-at-age for all five major herring stocks from about 1980 to 2010.
- An index of the relative biomass of herring born within the past year (such newborns are referred to as “age-0 recruits”) in the Strait of Georgia may be a leading indicator of the number of recruits forecast to join the population 2.5 years later and, therefore, the amount of prey available for Chinook and Coho salmon and other predators in the Strait. The index was lower and stable during 2013–2016, compared to peaks within the time series.
- The condition of newborn herring increased after 1997; they were heavier for a given length in 2016 than herring of the same length prior to 2007.
What factors affect the abundance and health of the Pacific Herring stocks?
Answer:
Factors that can potentially affect the abundance or condition of herring include:
- Food quality and availability: changes in the availability and quality of the zooplankton that herring prey on—primarily krill and tiny crustaceans known as copepods. For example, the timing of the spring phytoplankton bloom and subsequent zooplankton production in the Strait of Georgia is linked to the survival of herring larvae and the composition of the zooplankton community in Rivers Inlet, a nearby fjord. In particular, evidence indicates that the match or mismatch in timing between when herring are present and when their prey is available plays an important role in determining the abundance of newborn herring in the fall. In 2016, the spring bloom occurred at its typical time near the end of March.
- Ocean conditions: changes in ocean conditions such as temperature or currents could affect the amount and type, and therefore quality, of available prey. Herring recruitment and survival have been linked to water temperatures and bottom-up control of marine production.
- Predator presence: the abundance of predators such as juvenile Coho and Chinook salmon, and Humpback Whales. For example, the increasing numbers and year-round presence of Humpback Whales is expected to impact their prey species, including Pacific Herring.
- Competition: the abundance of other marine life competing for food including juvenile Sockeye, Pink and Chum salmon.
Keep up-to-date on Pacific herring online.
Iconic Pacific Salmon
Why are Pacific Salmon so important to Canada’s West Coast?
Answer:
In British Columbia and the Yukon, the iconic Pacific Salmon supports commercial, recreational and Aboriginal fisheries, creating jobs, generating income, and providing a valuable source of protein. Salmon are also integral to the cultural identity, way of life, and spirituality of coastal First Nations peoples. Indigenous communities on the West Coast have co-evolved with salmon, and have a long history of fishing particular runs of salmon at certain times of the year that dates back thousands of years. According to a 2016 Fisheries and Oceans Canada report, the landed value of wild salmon in B.C. during the previous decade ranged from a high of $75.1 million in 2010 to a low of almost $23.3 million in 2008.
At the ecosystem level, Pacific Salmon play an important role as both predators and prey for a wide range of species from seals, sharks, and freshwater fish to birds and land animals such as bears and wolves. Salmon are also a valuable link between the ocean and in-land rivers, streams, and lakes by transferring nutrients to fresh water when they return to their natal areas to spawn and die. This process provides nutrients for the next generation of salmon and other freshwater organisms, as well as the surrounding terrestrial ecosystem and wildlife community.
Are there different types of Pacific Salmon, and what makes them different?
Answer:
Five species of sea-run salmon in British Columbia and the Yukon are collectively referred to as Pacific Salmon — Sockeye, Pink, Chum, Chinook and Coho. The term for these species that live part of their lives in freshwater and salt water is ‘anadromous’. The young salmon born in freshwater rivers migrate to the ocean to mature and return to their birth rivers as adults to spawn once and die. A sixth species, Steelhead, is similar to other Pacific Salmon, except they can be repeat spawners.
Different species of Pacific Salmon and different stocks of the same species have unique biological characteristics and life cycles (e.g., different migration routes and timing), with each genetically adapted to its specific environment upon which population survival depends. In British Columbia, sea-run salmon return to their birth river or stream to spawn anywhere from two to six years after beginning life there. These different characteristics are key to balancing salmon fishing with protecting the health of stocks.

Pacific Salmon: Downloadable poster. Painting of several species and life stages of salmon in a circle pattern on a blue and tan background. Bottom left: Red circular salmon eggs sit amongst grey pebbles, tiny alevins with red egg sacks swim above the eggs while small striped fish – known as fry - swim above them. Top left: Small grey fish – known as smolts – swim in a school while several species of silver and blue adult salmon swim above them toward the right of the painting. Bottom right: Brown adult salmon are shown jumping up a stream with red adult sockeye salmon swim below them. One adult salmon is shown moving its tail among grey pebbles.
What factors influence how many salmon return to spawn in their natal freshwater rivers and streams?
Answer:
High mortality among salmon occurs in both fresh water and the ocean, with return abundances and productivity varying between species and different populations of the same species. A range of biological factors can influence annual Pacific Salmon returns including spawning abundances in the brood year (i.e., the calendar year when parents of the returning salmon spawned), the age at which returning fish mature, and how many eggs successfully hatch and juveniles survive to maturity in both their fresh water and marine life stages.
Since Pacific Salmon produce several thousand eggs-per-female spawner, are relatively short-lived, and die after spawning, variations in environmental conditions throughout their life history can cause large changes in abundance from year to year. For example, temperature can directly affect salmon survival or affect it indirectly through its influence on salmon predators and prey. Other factors, such as fluctuations in the amount of nutrients that reach the ocean surface, can affect productivity throughout the food web. All these factors can also alter the distribution of salmon and the abundance, composition, and distribution of their predators and prey.
The La Niña Effect
The climate phenomena La Niña and El Niño often make the news, but what do they have to do with salmon returns? La Niña is the “cold phase” of the El Niño-Southern Oscillation (ENSO) cycle, which describes recurring fluctuations in large-scale climate interactions between the ocean and atmosphere in the east-central Equatorial Pacific. The cycle is marked by periods of below average (La Niña) and above average (El Niño) sea surface temperatures in the region. Shifts between the two phases occur irregularly every two to seven years, causing large-scale impacts on ocean processes, global weather, and climate. Not surprisingly, these shifts in large-scale climate patterns have also been associated with variations in salmon returns.
Fisheries and Oceans Canada research indicates that high returns of Sockeye indicator stocks (salmon stocks from “indicator” streams which are monitored annually) in British Columbia can be associated with strong La Niña events. In the early 1990s, for example, maximum returns for all indicator stocks from the north coast to the Fraser River were associated with a powerful La Niña event in the late 1980s. More recently, record to near-record returns of Sockeye to Vancouver Island (Barkley), the Fraser River (Chilko), and Columbia River (Okanagan) in 2010–11 followed a major La Niña in 2008 and reversed a multi-year trend of less-than-average returns.
On the flip side, a warmer than average ocean in 2015 followed by an El Niño in spring 2016 was indicative of unfavourable conditions for juvenile salmon survival. For this reason, significant reductions in returns are expected for many salmon populations in 2017–2018.
How did Sockeye returns in 2016 compare to previous years?
Answer:
Production trends for major Sockeye salmon populations in British Columbia provide an indication of how much each of these fish stocks varies across the whole B.C. coast. There are large variations in stock productivity between 1970 and 2016 -- some populations were 10-90 times greater than other years. How well as stock is producing new members, whether thriving, surviving or declining – it’s ‘productivity’ – is estimated by monitoring many indicators in order to gauge how much new biomass is annually being produced into a given species population. For many years scientists have been estimating how many mature salmon will return to spawn in the most important salmon-producing streams in B.C., by analyzing the number of individuals the stream produced and released to the ocean in previous years. They use this ‘spawning escapement’ data to estimate ‘returns’ to spawn. But understanding productivity is complex, as a host of stressors can impact salmon stocks between the escapement and the return.
Sockeye Indicator Stocks
In 2016, some Pacific Salmon stocks fared better than others. For example:
- In 2016, the total return of Fraser River Sockeye Salmon was the lowest on record, with some populations having better survival and others poor. Both freshwater and marine factors contributed to the poor returns observed for some populations.
- Returns of Sockeye Salmon stocks on the west coast of Vancouver Island (WCVI), the Central Coast, and the Columbia-Okanagan system exceeded the Department’s annual pre-season forecast and were above the average return levels based on all years of data. Juvenile salmon surveys have been conducted in this area since 1998, usually in October and November. Read the pre-season forecast of B.C. salmon returns
- Returns were near average to above average in the central (Smith Inlet Sockeye), north (Nass Sockeye), and transboundary (Tatsamenie Sockeye) coastal regions, with central coast Sockeye returns to Smith Inlet and Rivers Inlet rising above the all-year average return (Smith Inlet) for the first time in more than 20 years.
- As anticipated, due to a combination of reduced production in fresh water and reduced survival in the marine environment, southern Sockeye stocks (Okanagan and Barkley) declined compared to the records returns for Okanagan in 2014 and Barkley in 2015.
- In 2016, return patterns for Sockeye populations throughout their range—from the Columbia River in the south to Bristol Bay, Alaska, in the north—were generally consistent with the “inverse production regime hypothesis.” According to the theory, below average returns at the southern end of the B.C. Sockeye range are accompanied by above average returns at the northern end of their range from northwest British Columbia to Alaska.
The Salish Sea and Chilko Lake Sockeye Survival
Only a few percent of the juvenile salmon that out-migrate from their birth rivers through the Salish Sea return to spawn. Along the Pacific Coast, some salmon stocks are doing better than others. The situation has raised concerns about the viability of many salmon stocks in southern British Columbia. The Salish Sea encompasses the Strait of Georgia, Juan de Fuca Strait, and Puget Sound off the coast of southern B.C. and northern Washington State.
Fisheries and Oceans Canada is conducting ongoing research into salmon survival in the Canadian Pacific marine environment. In addition to other research, scientists in the department’s Pacific Region are collaborating on the Salish Sea Marine Survival Project, a multi-disciplinary, international research effort to determine which factors are contributing to poor marine survival for Pacific Salmon and Steelhead. A multitude of coordinated research projects involving more than 60 organizations and 150 scientists and technicians in Canada and the United States are examining three key hypotheses and a range of other hypotheses to determine why so many juvenile salmon are dying in the Salish Sea. Finding the answers would help to inform the development of effective strategies to improve or restore these fisheries.
Resources for Educators: Learn more about Pacific salmon
The State of Pacific Marine Mammals
The State of Pacific Marine Mammals
Answer:
The Department has carried out aerial surveys over the offshore waters of western Vancouver Island since 2012. Since 2002, the Cetacean Research Program of Fisheries and Oceans Canada has covered more than 55,000 kilometres surveying for whales, dolphins and porpoises from large-vessel platforms over shelf and off-shelf waters in Canada’s Pacific Exclusive Economic Zone. The Exclusive Economic Zone ranges from 12 nautical miles to a maximum of 200 nautical miles from shore.

Once depleted by commercial whaling, Humpback Whales like this young whale photographed near Langara Island (Haida Gwaii,) are increasing on Canada’s West Coast and re-occupying historical seasonal habitats including the Strait of Georgia. Photograph of a humpback whale breaching out of grey ocean water. The whale’s body is completely out of the water except for the tail and it is jumping sideways with one pectoral fin in the air. White sprays of water flow out around the whale. Photo courtesy Graeme Ellis.
Which marine mammal populations are showing signs of recovery and what are the implications for other species and the ecosystem?
Answer:
Research indicates the populations of Humpback Whales, Steller Sea Lions, and Pacific Harbour Seals were severely depleted by commercial harvesting and predator control programs in British Columbia during the late 19th to mid-20th centuries. The population trajectories of these three marine mammals are now either increasing or recovered/stable.
Humpback Whales (increasing)
Since being depleted by commercial whaling, the Humpback Whale population in British Columbia has increased substantially and is re-occupying historical seasonal habitats such as the Strait of Georgia, which they use as foraging habitat. The unique markings on the underside of their tail flukes can be used like fingerprints to identify and track individual Humpbacks. These markings also assist with population estimates; the B.C. population was last assessed in 2006 at 2,145 individuals. Observations in 2016 reveal these whales are continuing to increase in B.C. waters, with the greatest abundance occurring from spring to late fall.
The year-round presence and growing numbers of Humpbacks is expected to affect their prey including Pacific Herring and small pelagic forage fish, as well as nearshore ecosystems. Up-to-date population estimates are necessary to assess the potential impacts of this species on coastal ecosystems, and to mitigate threats to their survival including vessel strikes, underwater noise, oil spills, reduced prey availability, and entanglements. These threats are expected to increase in frequency and severity due to the expansion of industrial activities and the ongoing recovery of Humpbacks in the coastal waters of B.C.
Steller Sea Lions (increasing)
The Steller Sea Lion population on Canada’s West Coast has continued to grow, with an estimated population of 39,200 individuals during the 2013 summer breeding season. Earlier research indicates that sea lions are the second most common prey species (after Harbour Seals) for Threatened West Coast Transient (WCT) Killer Whales (CSAS ResDocs - 2017/035), supporting their recovery. Since sea lions prey on many commercially harvested fish, their growing population also has ecosystem-level implications.
Pacific Harbour Seals (recovered/stable)
Harbour Seals in the Strait of Georgia remain at carrying capacity.Footnote 3 Based on aerial surveys in 2014, the population was an estimated 40,000 individuals. This species represent 53 percent of observed kills and harassments by WCT Killer Whales. Their stable population also has ecosystem-level implications since they prey on many commercially harvested fish.
What is the status of other marine mammals on the Pacific Coast?
Answer:
Following are other marine mammal status updates, which have been detailed in various Fisheries and Oceans Canada State of the Pacific Ocean reports:
Transient Killer Whales
The increasing occurrence of Threatened West Coast Transient (WCT) Killer Whales in the Strait of Georgia over the last 40 years is thought to be linked to the rebound of the B.C. Harbour Seal population. Learn about Southern Resident Killer Whales, Northern Resident Killer Whales and Offshore Killer Whales.
North Pacific Right Whales
Right Whales, the most endangered large whale species in British Columbia, were sighted on the outer B.C. coast two times in 2013—the first confirmed observations of this species in Canadian waters since the 1950s. These sightings were reported in Fisheries and Oceans Canada’s 2013 State of the Pacific Ocean report.
The first sighting occurred on June 9, 2013, 8 nautical miles off the northwest coast of Haida Gwaii. Over 17 hours, the whale was mainly observed feeding on visibly dense zooplankton at the surface. The second Right Whale was spotted on October 25 among a group of Humpback Whales at Swiftsure Bank, off the southwest coast of Vancouver Island. Observations confirmed this was a different individual than the one spotted in June.
These sightings could have been influenced by variations in large-scale conditions given the atypical oceanographic and climatic conditions in the Gulf of Alaska in 2013. In addition, Right Whale prey was plentiful, at least during the June 2013 sighting, with a higher than average abundance of subarctic copepods along the shelf break in British Columbia.
The Right Whale population in the northeast Pacific is the smallest population of whales in the world—among those species for which population estimates are available—and is at serious risk of extirpation (local extinction). Learn more here.
Fin Whales
Listed as Threatened under the Species at Risk Act, Fin Whales are the second largest whale in the world after Blue Whales. They were severely depleted by commercial whaling in the North Pacific from about 1908 to the 1970s. Ship-based observations and recordings of vocal activity along the north coast of British Columbia reveal that Fin Whales are re-occupying historical habitat in Hecate Strait, Queen Charlotte Sound, and Caamaño Sound. These areas appear to be important for foraging and possibly breeding and calving—the most whale vocalizations in Hecate Strait occurred from November to January, which coincides with their breeding season in the North Pacific.
During aerial surveys off southwestern Vancouver Island from September 2012 to March 2015, Fin and Blue Whales were mostly sighted on the continental slope and farther offshore, in deeper water than Humpbacks.
Like other large baleen whale species, Fin Whales are filter feeders and consume large amounts of marine life that is low on the food chain including herring, caplelin, squid, shrimp-like crustaceans (krill), and small crustaceans (copepods). Consequently, recovering populations will likely contribute to changes in ocean ecosystems, which may become more apparent in Canada’s Pacific waters as the population continues to recover. Read more online about the status of Fin Whales and Blue Whales.
How many species of cetaceans were observed during the aerial surveys?
Answer:
Thirty-four aerial surveys were flown from September 2012 to March 2015 with survey efforts concentrated in the fall and winter (82 percent of surveys). Thirteen species of cetaceans were recorded during these surveys, as indicated in the following table.
| Cetacean Species Observed During Aerial Surveys, September 2012 to March 2015 | |
|---|---|
| Species name | Number of individuals sighted |
| Blue Whale | 5 |
| Fin Whale | 190 |
| Humpback Whale | 551 |
| Minke Whale | 1 |
| Grey Whale | 12 |
| Sperm Whale | 18 |
| Killer Whale | 50 |
| Baird’s Beaked Whale | 12 |
| Pacific White-Sided Dolphin | 1,073 |
| Northern Right Whale Dolphin | 804 |
| Risso’s Dolphin | 692 |
| Harbour Porpoise | 23 |
| Dall’s Porpoise | 73 |
| Cuvier’s Beaked Whale | 12 |
Learn more about Atlantic ecosystems
Below is a summary of topics in question and answer format that include emerging and ongoing issues not covered in the plain language report “Canada’s Oceans Now: Atlantic Ecosystems, 2018”.
Environmental Stressors
Climate Change
What do we know about Climate Change?
Answer:
Fisheries and Oceans Canada’s (DFO) Aquatic Climate Change Adaptation Services Program (ACCASP) studies the impacts of climate change on fisheries, ecosystems, and coastal infrastructure. Visit their website to see more information on the impacts of climate change in the Atlantic (e.g. sea level rise, ocean acidification, hypoxia) and the types of research being done to understand these changes.
Canada’s Changing Climate Report includes information on Canada’s current and projected climate changes: temperature, precipitation, ocean acidity and more.
Harmful Algal Blooms
What are Harmful Algal Blooms?
Answer:
Tiny organisms called phytoplankton or microalgae naturally bloom when a variety of seawater conditions occur, such as when there are high concentrations of certain inorganic nutrients, or when certain temperature, wind or water current conditions prevail after natural events like storms. Some species can cause harmful algal blooms (i.e., HABs), by increasing rapidly in number and producing toxins that can injure or kill marine organisms, and those that feed on them, including humans. The large mass of phytoplankton may itself be harmful as it decreases oxygen in the water and shades other organisms. While mobile organisms may be able to move away from these blooms, aquaculture facilities may be more vulnerable to increases in HABs.
In the last few decades, HABs have become more common, widespread, and intense worldwide, although not in all regions. Increases in HABs along the Pacific and Atlantic coasts of North America seem to indicate that warming due to climate change is an important factor leading to this increase.
Amnesic shellfish poisoning (ASP) and paralytic shellfish poisoning (PSP) are examples of illnesses caused by HABs which have been seen in Atlantic Canada. The first known example of ASP occurred in Prince Edward Island in 1987, and outbreaks of PSP have been seen in the Bay of Fundy and the Estuary and Gulf of St. Lawrence since the 1940s.
The apparent increase in HABs and their impact on human health and aquaculture makes studying and monitoring them important. In the Atlantic, HABS are monitored by DFO’s Atlantic Zone Monitoring Program (AZMP).
Aquaculture
What impact does aquaculture have on ecosystems?
Answer:
Shellfish and finfish aquaculture activities have the potential to affect natural aquatic ecosystems. These interactions are described in the report on Aquaculture Pathways of Effects (CSAS sar - 2009/071) , a framework by which aquaculture stressors on the ecosystem have been characterized and their respective effects categorized. Sustainability in aquaculture is informed by scientific research aimed at protecting aquatic ecosystems and conserving wild populations. Fisheries and Oceans Canada has a number of Science programs that help to inform our understanding and management of the interactions between aquaculture and aquatic ecosystems.
The Program for Aquaculture Regulatory Research (PARR) funds scientific research to study the interactions between aquaculture and the aquatic environment to inform regulatory decisions and policy development. The aquaculture impacts studied include research on fish diseases and pests, interactions between wild and farmed fish, the release of organic matter around farms, and effects on marine habitats, such as eelgrass. In evaluating aquaculture impacts, PARR results are often used in peer-reviewed advisory processes such as the Canadian Science Advisory Secretariat.
The Aquaculture Collaborative Research and Development Program (ACRDP) promotes collaborative research activities by pairing industry with DFO researchers on projects proposed by aquaculture producers and funded jointly through the ACRDP and industry. The broad research objectives of the program are to address optimal fish health and environmental performance of the Canadian aquaculture industry. The program’s research priorities apply to all aquaculture species (finfish, shellfish, or algae) in freshwater or marine ecosystems and look to answer questions related to pest and pathogen management for cultured stocks; ecosystem interactions; and production sustainability and species diversity.
The Aquaculture Monitoring and Modelling Program (AMMP) is a new program announced in 2016 with the objective of conducting long-term far-field monitoring of aquaculture inputs (i.e., organic matter, trace metals, drugs, pesticides, and antibiotics). In order to make appropriate, science-based management decisions within the Department, it is important to understand the fate and behaviour of these inputs in the environment and their spatial and temporal distribution away from the farm sites. Monitoring data will be available to research scientists to better inform science-based advice for policy and regulatory development and decision making.
The Aquaculture Ecosystem Interactions Program (AEIP), which was also announced in 2016, is a new research program aimed at addressing impacts of aquaculture activities and their interactions with the supporting ecosystem, as well as considering the cumulative effect of other stressors present in the environment to discriminate positive and negative associations induced by aquaculture specifically. The research funded through the AEIP will help to inform managers and policy makers in making complex, ecosystem-based management decisions.
Aquatic Invasive Species
What are aquatic invasive species?
Answer:
Aquatic invasive species (AIS) are non-native plants and animals that have invaded new ecosystems outside of their native habitats. They occupy habitats and out-compete native species. This means they threaten both the environment and the economy. AIS are successful partly because their natural predators are not present. They can make their way into Canadian waters naturally as larvae or as fragments drifting in ocean currents. They can also be found attached to boat hulls or in ballast water. Sometimes, unwanted aquarium pets are released into the ocean.
Warming ocean temperatures that result from climate change can make it easier for aquatic invaders to get established. The impacts they have can also be made worse by warming temperatures. AIS can affect the abundance of coastal fish communities, eelgrass and algae. They can cause changes in the invertebrate communities that live on the ocean bottom. They can also negatively affect commercial fishing and aquaculture.
As of 2017, 11 marine AIS are recognized as having various levels of negative impact on marine ecosystems in Atlantic Canadian coastal waters, including the following:
| Type of organism | Common name |
|---|---|
| Green algae | Oyster thief |
| Invertebrate | Coffin box bryozoan |
| Japanese skeleton shrimp | |
| European green crab | |
| Ascidian | Pancake batter tunicate |
| Vase tunicate | |
| Clubbed tunicate | |
| Golden star tunicate | |
| Violet tunicate | |
| European sea squirt | |
| Compound sea squirt |
Find out more about the types of aquatic invasive species in Canadian waters and what’s being done to control them on DFO’s AIS website.
Atlantic Species
North Atlantic Right Whale
What is being done to protect the North Atlantic Right Whale?
Answer:
Of great concern to Canadians are the human perils facing North Atlantic Right Whales. During the summer of 2017, 17 of the endangered whales were found dead off the North American east coast – 12 in Canadian waters. At the end of 2017, the population was estimated at just 411 individuals. Seven necropsies were performed in Canada, which indicated that two of the whales died due to entanglement in fishing gear and four other deaths were attributed to ship strikes (the cause of death of the seventh could not be determined because of the state of decomposition). This issue is being addressed by Fisheries and Oceans scientists in collaboration with other scientific and governmental organizations (e.g. Transport Canada) that are engaged in threat mitigation strategies, including temporary fishery closures and lowering the speed limits on large vessels traveling in areas where right whales have been spotted or along their usual migration route. In 2018, a total of 3 North Atlantic Right Whales were found dead, but none in Canadian waters.
In 2018, DFO conducted many science activities in support of protecting the right whale. Over 2000 hours of aerial surveys and over close to 1000 hours of boat surveys took place in 2018 to determine right whale distribution, as well as other cetaceans. Whale call data acquired through passive acoustic monitoring to monitor multiple species of marine mammals and right whale are being analyzed. A noise impact research program was launched to further the understanding of the effects of shipping noise on right whales. Whale detection technologies underwent testing with aims to develop a real-time whale detection system that can alert mariners of the presence of right whales and avoid vessel strikes. A satellite tagging project was initiated in collaboration with NOAA to study whale movement patterns, and tagging will be re-attempted in 2019-2020. Two peer-review science advisory meetings took place over 2017 and 2018 to support the development and refinement of both fishing and shipping measures.
Fisheries and Oceans Canada is working to study and protect Canada’s endangered whale species.
Atlantic Salmon
What is the status of Atlantic salmon?
Answer:
The Committee on the Status of Endangered Wildlife in Canada (COSEWIC) grouped the Canadian Atlantic salmon populations into 16 designatable units (DU) and assessed their status relative to a variety of criteria in 2010. COSEWIC’s assessment of the DUs varied, ranging from ‘Not at Risk’ (Northeast, Southwest and Northwest Newfoundland and Labrador populations), ‘Threatened’ (south Newfoundland population), ‘Special concern’ (Inner St. Lawrence, North shore of Quebec and Gaspé-southern Gulf of St. Lawrence populations), ‘Endangered’ (populations from the outer and inner Bay of Fundy, eastern Cape Breton, Nova Scotia southern upland and Anticosti Island) to ‘Extinct’ (Lake Ontario population). Most Canadian Atlantic salmon populations have declined in recent years.
Striped Bass
What is the status of striped bass?
Answer:
The Committee on the Status of Endangered Wildlife in Canada (COSEWIC) identified three designatable units (DU) of striped bass in Canada and have assessed their status most recently in 2012. The ‘Endangered’ striped bass population of the St. Lawrence estuary in Quebec is showing signs of recovery; the result of a re-introduction program with bass from the Miramichi River. Due to significant increases in the number of mature adult striped bass, COSEWIC re-assessed the southern Gulf of St. Lawrence population from ‘Threatened’ to ‘Special Concern’. Spawner abundance for Southern Gulf bass peaked in 2017 with estimates of nearly 1 million fish. After having been closed since 2000, the harvest of southern Gulf striped bass through indigenous and recreational fisheries was re-instated in 2012-2013 and access to the resource has steadily increased since then. The striped bass DU of the Bay of Fundy was assessed as ‘Endangered’ and largely the result of the loss of the Annapolis and Saint John River striped bass populations. The remaining Shubenacadie striped bass population spawns annually and numbers of mature adults appears to have been increasing since 2002.
Species at Risk
What Species at Risk are there in Atlantic Ecosystems?
Answer:
In order to be considered as a Species at Risk (SAR) a species may be extirpated, threatened, endangered, or of special concern as defined below. Examples of species at risk within Canada’s Atlantic bioregions include some populations of Atlantic salmon, leatherback sea turtles, and porbeagle sharks.
The Species at Risk Act (SARA) aims to protect endangered or threatened species and their habitats. Under SARA, Fisheries and Oceans Canada must produce recovery strategies and action plans for aquatic species listed as endangered or threatened.
For additional information on aquatic species at risk found in the Gulf, Maritimes, Newfoundland and Labrador and Quebec regions, please visit the Species at Risk website.
- Extirpated
- A wildlife species no longer exists in the wild in Canada, but exists elsewhere in the world.
- Endangered
- A wildlife species that is facing imminent extirpation or extinction.
- Threatened
- A wildlife species that is likely to become endangered if nothing is done to reverse the factors leading to its extirpation or extinction.
- Special concern species
- A wildlife species that may become a threatened or an endangered species because of a combination of biological characteristics and identified threats.
Ecosystem Monitoring and Protection
Atlantic Zone Monitoring Program
How do we monitor the marine environment?
Answer:
The Atlantic Zone Monitoring Program (AZMP) was established in 1998 to increase the capacity of Fisheries and Oceans Canada to understand, describe and forecast the state of the marine ecosystem. Part of this work is to measure changes in the ocean’s physical, chemical, and biological properties.
Atlantic Zone Off-Shelf Monitoring Program
How do we monitor the marine environment?
Answer:
The Atlantic Zone Off-Shelf Monitoring Program (AZOMP), similar to AZMP, collects and analyzes physical, chemical and biological properties of the ocean. However, it concentrates in deep water areas of the continental slope and the northwestern Atlantic Ocean.
Science research, advice and responses
How do Fisheries and Oceans Canada scientists provide advice on the health of fish stocks and marine ecosystems?
Answer:
Fisheries and Oceans Canada’s scientists study aquatic resources and ecosystems in Canada, which is essential in the sound decision making of fisheries management and oceans governance. Peer-reviewed scientific advice and research documents as well as stock, ecosystem and habitat status reports are available through the Canadian Science Advisory Secretariat (CSAS).
Ecologically and Biologically Significant Areas
What are Ecologically and Biologically Significant Areas?
Answer:
Scientists have identified many Ecologically and Biologically Significant Areas (EBSAs) (CSAS ESR - 2004/006) within Canada's oceans. These areas have special biological or ecological significance when compared with the surrounding marine ecosystem. Particular attention is given when managing activities in these areas to ensure ecosystems remain healthy and productive. Information about EBSAs is used in marine planning activities, such as environmental assessments and identifying potential areas for Marine Protected Areas (MPAs). These areas are identified through scientific review processes and these reports are available through the Canadian Science Advisory Secretariat (CSAS) (CSAS ESR - 2004/006-eng.html">Ecologically and Biologically Significant Areas (EBSAs) (CSAS ESR - 2004/006) within Canada's oceans. These areas have special biological or ecological significance when compared with the surrounding marine ecosystem. Particular attention is given when managing activities in these areas to ensure ecosystems remain healthy and productive. Information about EBSAs is used in marine planning activities, such as environmental assessments and identifying potential areas for Marine Protected Areas (MPAs). These areas are identified through scientific review processes and these reports are available through the Canadian Science Advisory Secretariat (CSAS)) .
- Date modified: