
Canada’s Oceans Now: Atlantic Ecosystems, 2022 - Calanus copepods returning to near-average levels
Text version
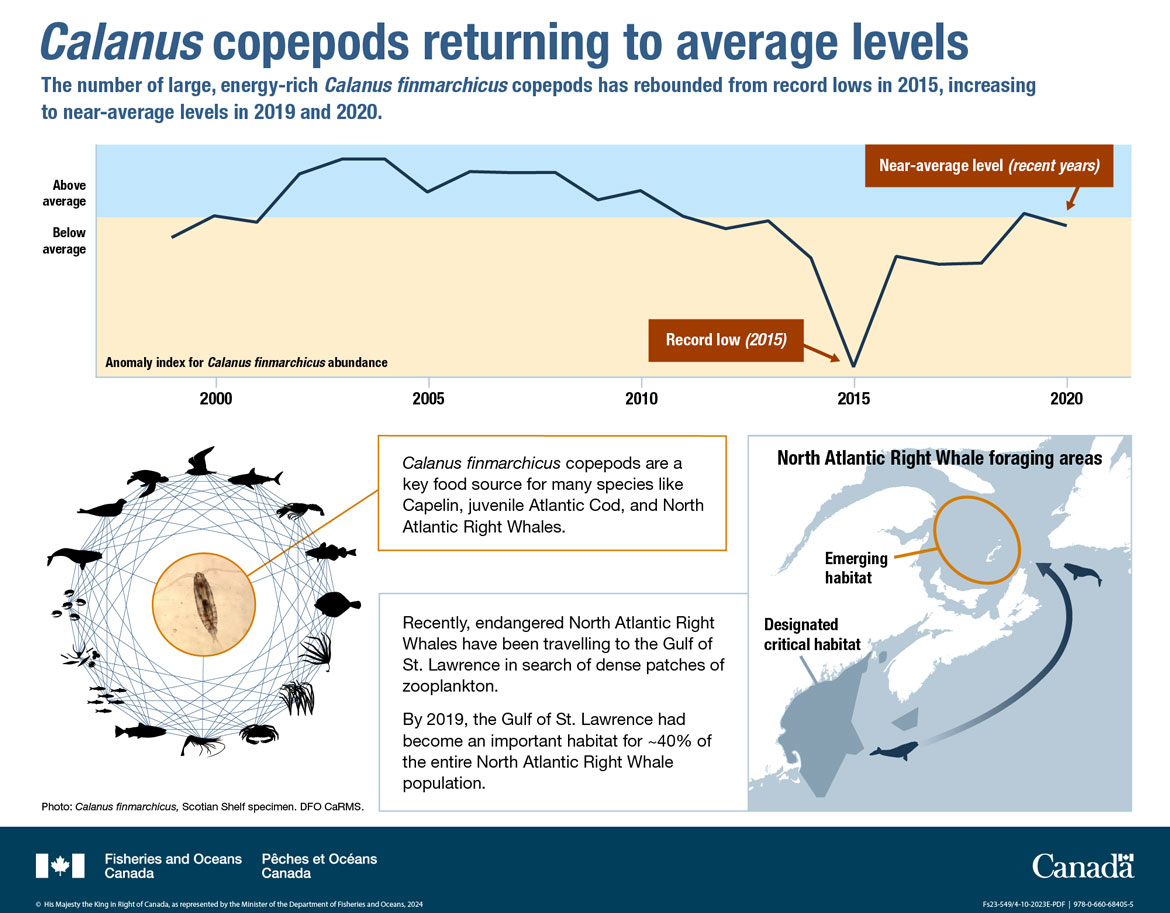
Calanus copepods returning to near-average levels
The number of large, energy-rich Calanus finmarchicus copepods has rebounded from record lows in 2015, increasing to near-average levels in 2019 and 2020.
The top of the infographic is a line graph representing the anomaly index for Calanus finmarchicus abundance for the years 1999 to 2020. Text to the left of the graph indicates that the top of the graph (coloured blue) represents above average, and the bottom of the graph (coloured yellow) represents below average. A black line represents the abundance index which was above average through most of the 2000 to 2015 time period, but then was below average until the last two years. There are two red boxes with arrows and white text on the graph.
- At bottom, pointing to 2015: Record low (2015)
- At top, pointing to most recent data point: Near-average level (recent years)
| Year | Calanus finmarchicus Abundance Anomaly Index |
|---|---|
| 1999 | -0.2 |
| 2000 | 0.0 |
| 2001 | -0.1 |
| 2002 | 0.5 |
| 2003 | 0.6 |
| 2004 | 0.6 |
| 2005 | 0.3 |
| 2006 | 0.5 |
| 2007 | 0.5 |
| 2008 | 0.5 |
| 2009 | 0.2 |
| 2010 | 0.3 |
| 2011 | 0.0 |
| 2012 | -0.1 |
| 2013 | 0.0 |
| 2014 | -0.4 |
| 2015 | -1.6 |
| 2016 | -0.4 |
| 2017 | -0.5 |
| 2018 | -0.5 |
| 2019 | 0.0 |
| 2020 | -0.1 |
On the bottom left of the infographic is an image of a Calanus finmarchicus copepod in an orange circle. Around this image are the various marine organisms in a circle with interconnecting blue lines illustrating that Calanus finmarchicus is a central food source supporting the marine food web. Beside this illustration are orange and blue outlined text boxes:
- Calanus finmarchicus copepods are a key food source for many species like Capelin, juvenile Atlantic Cod, and North Atlantic Right Whales.
- Recently, endangered North Atlantic Right Whales have been travelling to the Gulf of St. Lawrence in search of dense patches of zooplankton.
- By 2019, the Gulf of St. Lawrence had become an important habitat for ~40% of the entire North Atlantic Right Whale population.
On the bottom right of the infographic is a box with a map of North Atlantic Right Whale foraging areas in Atlantic Canadian waters. The land on the map is white and the ocean is blue. Designated critical habitat for NARWs on the bottom of the map at the southern end of the Scotian Shelf in the Gulf of Maine is shaded darker blue. Emerging habitat in the southern Gulf of St. Lawrence is outlined by an orange circle. A dark blue line extends from the bottom to the top of the map linking the habitats with an arrow at the top pointing towards the GSL. Blue solid outlines of NARWs are at the beginning and end of this line.
Related links
- Date modified: