
Canada’s Oceans Now: Atlantic Ecosystems, 2022 - Warming waters, less sea ice in 2021
Text version
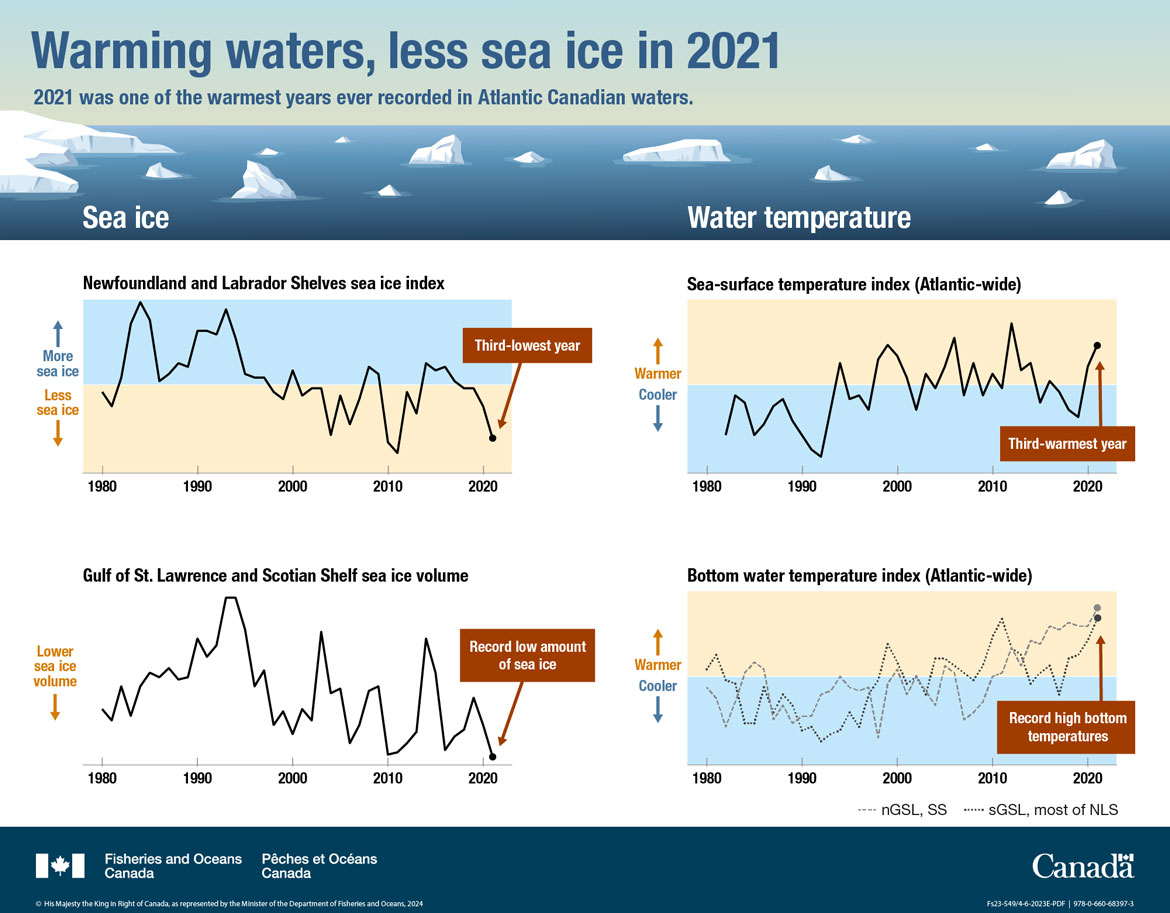
Warming waters, less sea ice in 2021
2021 was one of the warmest years ever recorded in Atlantic Canadian waters.
This infographic includes four graphs — two for sea ice and two for ocean water temperature to illustrate how temperatures are increasing in Atlantic Canadian waters.
Sea Ice
Newfoundland and Labrador Shelves sea ice index
A line graph illustrates the Newfoundland and Labrador Shelves sea ice index between 1980 and 2021. Blue and yellow text on the left side of the graph indicates that the top half (coloured blue) represents more sea ice and the bottom half (coloured yellow) represents less sea ice. A black line represents the sea ice index which is mostly below average in the 2000s. A red box and arrow with white text to the right of the graph indicates that 2021 was the third-lowest year for the sea ice index.
| Year | NLS Sea Ice Index |
|---|---|
| 1980 | -0.2 |
| 1981 | -0.6 |
| 1982 | 0.2 |
| 1983 | 1.7 |
| 1984 | 2.3 |
| 1985 | 1.8 |
| 1986 | 0.1 |
| 1987 | 0.3 |
| 1988 | 0.6 |
| 1989 | 0.5 |
| 1990 | 1.5 |
| 1991 | 1.5 |
| 1992 | 1.4 |
| 1993 | 2.1 |
| 1994 | 1.3 |
| 1995 | 0.3 |
| 1996 | 0.2 |
| 1997 | 0.2 |
| 1998 | -0.2 |
| 1999 | -0.4 |
| 2000 | 0.4 |
| 2001 | -0.3 |
| 2002 | -0.1 |
| 2003 | -0.1 |
| 2004 | -1.4 |
| 2005 | -0.3 |
| 2006 | -1.1 |
| 2007 | -0.4 |
| 2008 | 0.5 |
| 2009 | 0.3 |
| 2010 | -1.6 |
| 2011 | -1.9 |
| 2012 | -0.2 |
| 2013 | -0.8 |
| 2014 | 0.6 |
| 2015 | 0.4 |
| 2016 | 0.5 |
| 2017 | 0.1 |
| 2018 | -0.1 |
| 2019 | -0.1 |
| 2020 | -0.6 |
| 2021 | -1.5 |
Gulf of St. Lawrence and Scotian Shelf sea ice volume
A line graph illustrates sea ice volume for the Gulf of St. Lawrence and Scotian Shelf between 1980 and 2021. Yellow text to the left of the graph indicates that decreasing values on the graph correspond with lower sea ice volume. A black line represents the sea ice volume which fluctuates over time with generally lower values in the 2000s. A red box and arrow with white text to the right of the graph indicates that a record low amount of sea ice was recorded in 2021.
| Year | GSL and SS Sea Ice Volume (km3) |
|---|---|
| 1980 | 24 |
| 1981 | 19 |
| 1982 | 34 |
| 1983 | 21 |
| 1984 | 34 |
| 1985 | 40 |
| 1986 | 38 |
| 1987 | 42 |
| 1988 | 37 |
| 1989 | 38 |
| 1990 | 55 |
| 1991 | 47 |
| 1992 | 52 |
| 1993 | 73 |
| 1994 | 73 |
| 1995 | 59 |
| 1996 | 34 |
| 1997 | 41 |
| 1998 | 17 |
| 1999 | 23 |
| 2000 | 13 |
| 2001 | 24 |
| 2002 | 19 |
| 2003 | 58 |
| 2004 | 31 |
| 2005 | 33 |
| 2006 | 9 |
| 2007 | 17 |
| 2008 | 32 |
| 2009 | 34 |
| 2010 | 4 |
| 2011 | 5 |
| 2012 | 9 |
| 2013 | 14 |
| 2014 | 55 |
| 2015 | 40 |
| 2016 | 6 |
| 2017 | 12 |
| 2018 | 15 |
| 2019 | 29 |
| 2020 | 17 |
| 2021 | 3 |
Water temperature
Sea-surface temperature index (Atlantic-wide)
A line graph illustrates the Atlantic-wide sea surface temperature index for the years 1982 to 2021. On the left of the graph, yellow and blue text indicate that the top half of the graph, (coloured yellow) represents warmer temperatures and the bottom half of the graph (coloured blue) represents cooler temperatures. A black line represents the temperature index which has been mainly above average since the mid-1990s. A red box and arrow with white text to the bottom right of the graph indicates that 2021 was the third-warmest year on record.
| Year | Sea-surface Temperature Anomaly Index |
|---|---|
| 1982 | -1.4 |
| 1983 | -0.3 |
| 1984 | -0.5 |
| 1985 | -1.4 |
| 1986 | -1.1 |
| 1987 | -0.6 |
| 1988 | -0.4 |
| 1989 | -1.0 |
| 1990 | -1.4 |
| 1991 | -1.8 |
| 1992 | -2.0 |
| 1993 | -0.7 |
| 1994 | 0.6 |
| 1995 | -0.4 |
| 1996 | -0.3 |
| 1997 | -0.7 |
| 1998 | 0.7 |
| 1999 | 1.1 |
| 2000 | 0.8 |
| 2001 | 0.2 |
| 2002 | -0.7 |
| 2003 | 0.3 |
| 2004 | -0.1 |
| 2005 | 0.5 |
| 2006 | 1.3 |
| 2007 | -0.3 |
| 2008 | 0.6 |
| 2009 | -0.3 |
| 2010 | 0.3 |
| 2011 | -0.1 |
| 2012 | 1.7 |
| 2013 | 0.4 |
| 2014 | 0.6 |
| 2015 | -0.5 |
| 2016 | 0.1 |
| 2017 | -0.2 |
| 2018 | -0.7 |
| 2019 | -0.9 |
| 2020 | 0.5 |
| 2021 | 1.1 |
Bottom water temperature index (Atlantic-wide)
A line graph illustrates Atlantic-wide bottom water temperature indices between the years 1980 and 2021. Yellow and blue text to the left of the graph indicates that the top half (coloured yellow) represents warmer temperatures and the bottom half (coloured blue) represents cooler temperatures. A grey dashed-line representing the northern Gulf of St. Lawrence and Scotian Shelf is mainly above average since the 2010s. A black dotted-line representing the southern Gulf of St. Lawrence and most of the Newfoundland and Labrador Shelves is mainly above average since 2000. A red box and arrow with white text to the bottom right of the graph indicates that record high bottom temperatures were recorded in 2021.
| Year | Bottom Temperature Anomaly Index (sGSL, most of NLS) | Bottom Temperature Anomaly Index (nGSL, SSS) |
|---|---|---|
| 1980 | 0.2 | -0.3 |
| 1981 | 0.6 | -0.6 |
| 1982 | -0.1 | -1.4 |
| 1983 | -0.2 | -0.7 |
| 1984 | -1.3 | 0.1 |
| 1985 | -1.3 | 0.4 |
| 1986 | -0.3 | 0.2 |
| 1987 | -1.0 | -1.2 |
| 1988 | -0.5 | -0.8 |
| 1989 | -0.8 | -1.3 |
| 1990 | -1.5 | -1.1 |
| 1991 | -1.4 | -1.1 |
| 1992 | -1.8 | -0.5 |
| 1993 | -1.6 | -0.4 |
| 1994 | -1.5 | 0.0 |
| 1995 | -1.0 | -0.3 |
| 1996 | -1.4 | -0.4 |
| 1997 | -0.5 | -0.3 |
| 1998 | -0.1 | -1.7 |
| 1999 | 0.9 | -0.2 |
| 2000 | 0.4 | 0.2 |
| 2001 | -0.2 | -0.5 |
| 2002 | 0.0 | 0.0 |
| 2003 | -0.5 | -0.4 |
| 2004 | 0.5 | -0.8 |
| 2005 | 0.5 | 0.3 |
| 2006 | 0.3 | 0.1 |
| 2007 | 0.1 | -1.2 |
| 2008 | -0.1 | -1.0 |
| 2009 | 0.3 | -0.7 |
| 2010 | 1.1 | 0.0 |
| 2011 | 1.6 | 0.1 |
| 2012 | 0.8 | 0.8 |
| 2013 | 0.6 | 0.3 |
| 2014 | -0.2 | 1.0 |
| 2015 | 0.1 | 0.9 |
| 2016 | 0.3 | 1.4 |
| 2017 | -0.5 | 1.3 |
| 2018 | 0.5 | 1.5 |
| 2019 | 0.6 | 1.4 |
| 2020 | 1.0 | 1.4 |
| 2021 | 1.6 | 1.9 |
Related links
- Date modified: