
Center of Expertise in Marine Mammalogy: Scientific Research Report 2006-2008
Table of Contents
- Acknowlegements
- Message from the Director of CEMAM
- 1.0 Overview
- 2.0 Population Dynamics
- 3.0 How Marine Mammals Fit Into the Ecosystem
- 4.0 Human Impacts on Marine Mammals
- 5.0 Publications 2006-2008
4.0 Human Impacts on Marine Mammals
4.1 Commercial and Subsistence Hunts
4.1.1 Bowhead Whales in the Eastern Canadian Arctic and West Greenland
Jeff Higdon

Successful bowhead hunt
Photo: Jack Orr
Commercial harvesting of bowhead whales in eastern Canada and West Greenland has a long history, starting with Basque whalers in the Strait of Belle Isle in 1530. Inuit in Canada and West Greenland have also hunted bowheads for subsistence, and for trade, for centuries. Recovery planning for bowhead whales requires an estimate of pre-exploitation size to set population recovery targets. The estimated pre-whaling population size can be estimated using a population model and a harvest series. Establishing a catch series, as reported here, was the first step.
Commercial bowhead whaling started in the early 1500s in the Strait of Belle Isle area, and Danish and German whalers were voyaging to Davis Strait by the late 1600s. Danish-Norwegian colonization of West Greenland started in 1721, and these settlers were also active in bowhead whaling. British whalers were in Davis Strait by the mid-1700s and crossed into Baffin Bay in the early 1800s, starting another pulse in bowhead whaling off Baffin Island, in Lancaster Sound, Prince Regent Inlet, and the Gulf of Boothia. American whalers were active in Davis Strait in the 1700s and again in the 1800s, and in Hudson Bay after 1860, where they were joined by Scottish whalers. The last commercial whaling for bowheads in the Canadian Arctic was in 1915, when the population was at extremely low numbers and voyages were no longer profitable. The total (minimum) commercial harvest from 1530-1915 was estimated at 57,507-68,736 whales, with highest harvests by the Basques and British.

Figure 8. Estimated total bowhead harvest per decade in eastern Canada and West Greenland from 1530-2005, illustrating how small Inuit subsistence harvests were in comparison to commercial harvests.
The first native culture to be active bowhead whalers was the Thule. After 1500, bowhead whaling declined, possibly related to changing climatic conditions, a reduced whale population from Basque harvests, or a combination of both factors. The total estimated harvest between 1530 and the end of commercial whaling was 8,460 whales. Inuit whaling declined again after commercial whalers over-harvested the bowhead population, and only 56 whales are known to have been harvested after 1918. The estimated Inuit harvest is based on scattered data and a number of assumptions; there is some evidence that at least parts of the harvest series are underestimates. The long tradition of Inuit bowhead whaling was negatively impacted by commercial harvests. There is currently a limited hunt in Nunavut with similar hunts planned in Nunavik and West Greenland.
Combining the commercial and Inuit harvests after 1530 results in a total estimated kill of over 70,000 whales (not including struck and lost and known to be incomplete for some nations and eras). Nearly all (88 percent) were taken by commercial whalers. While still incomplete, the harvest series is more detailed than previously available data and should improve modeling efforts to estimate pre-whaling population size (Fig. 8). However, any modeling should rigorously assess the sensitivity of the results to varying aspects of the harvest series due to the number of assumptions included. The quality of the harvest data varies considerably by nation and era. Population modeling studies will need to explicitly incorporate this variability in data quality.
4.2 Providing Scientific Advice on TACs
4.2.1 The Management of Harp, Hooded and Grey Seals in Canada
Garry Stenson
Since the early 1980s, the Canadian government used a reference point known as ‘Replacement Yield' in the management of harp, hooded and grey seals in the Northwest Atlantic. Replacement yield is the number of animals that can be taken in any one year that will result in the population remaining the same as in the previous year. In 2003, however, Canada adopted a new approach to the management of seals in Atlantic Canada. This management approach, referred to as Objective Based Fisheries Management, incorporates the Precautionary Approach (PA) which strives to be more cautious when information is less certain, does not accept the absence of information as a reason for not implementing conservation measures, and defines, in advance, decision rules for stock management when the resource reaches clearly stated reference points. These points or levels are referred to as conservation (limit or critical), precautionary (or buffer) and target reference points.
One of the basic PA principles is the need to account for the uncertainty associated with estimates and to develop a basis for taking action even if stock status is insufficiently known. Therefore, we distinguish between species where a considerable amount of data are available (‘data-rich') and situations where resource information is more limited (‘data-poor'). Data-rich species are defined as requiring three or more abundance estimates over a 15-year period, with the last estimate obtained within the last five years, and current information (≤ five years old) on fecundity and/or mortality. If these data are not available, the species would be considered as data-poor.
For data-rich species, the conservation reference point (Ncritical) represents the (estimated) numerical abundance at which continued removals are considered to cause serious and irreversible harm to the population. However, estimates of abundance are associated with considerable uncertainty and this uncertainty increases as the population is projected into the future. Managing a population close to the conservation reference point could result in a high probability that the population unintentionally declines below Ncritical. Therefore, a Precautionary Reference Point (Nbuffer) identifies an ‘unsafe' population range within which risk-adverse management control rules would apply. When a population is above the precautionary reference point, managers may establish a target reference point based upon considerations such as ecosystem impacts and/or socio-economic benefits. As long as the population remained above Nbuffer, higher-risk harvest strategies could be adopted. In fact, in Canada there must be an 80 percent likelihood that a population is above Nbuffer to be considered in the healthy zone.
If the population is below Nbuffer (but above Ncritical), conservation concerns become a higher priority and pre-agreed harvest control rules would be applied with the objective to rebuild the population to above Nbuffer within a specified number of years. Although harvesting and other human-induced removals could continue, management strategies require a high probability that the population will increase (or conversely, a lower risk that the population would continue to decline).
A population below Ncritical is considered to be a conservation concern and continued removals present an unacceptable risk of serious or irreversible harm. Therefore, management actions should ensure that all human-induced mortality is eliminated.

Figure 9. Objective Based Fisheries Management approach adopted by Canada in 2003 with reference levels identified for Northwest Atlantic harp seals.
Currently, we have set Ncritical to be 30 percent of the highest population level estimated or inferred (‘N30'), while the Nbuffer is considered to be 70 percent of this maximum (N70) (Fig. 9). For management purposes we have also identified a level at 50 percent where more stringent management measures are required. The precautionary reference level is set quite high owing to the characteristics of the way in which seals are assessed and the age structure of the current harvest. Because the primary method of assessment is to estimate pup production every four to five years and the high level of YOY in the harvest, the impact of current catches cannot be evaluated until surviving animals have themselves reproduced five or more years later. Also, recent environmental conditions have been poor and will likely continue to worsen, on average. Finally, history has shown that marine mammal populations grow relatively slowly, but can decline quickly (e.g. St. Lawrence beluga, blue whales) and that failure to consider uncertainty can result in severe harm (e.g. Atlantic cod, salmon, abalone).
For species not satisfying the data-rich criteria, the uncertainty associated with resource status and with the effects of particular management actions increases. Therefore, an even more risk-adverse approach is needed. We apply a formula similar to the ‘Potential Biological Removals' approach developed by the United States under the Marine Mammal Protection Act.
Under the Objective Based Fisheries Management plan, hooded seals are considered to be ‘Data Poor'. Harp and grey seals are considered to be ‘Data Rich' and are currently considered to be above the N70 precautionary reference level.
4.2.2 Hunt Induced Mortality of Northwest Atlantic Hooded Seals
Garry Stenson
In order to determine the abundance of wild populations accurately, it is necessary to obtain the most complete data possible on the level of human induced mortality. This is particularly important for species that are exploited by subsistence or commercial hunts. In the Northwest Atlantic, hooded seals, like harp seals, are killed during a subsistence harvest in Greenland and a commercial hunt in southern Canadian waters. However, unlike harps, very few hooded seals are taken in the Canadian Arctic or as by-catch in Canadian fisheries.
The objective of this study was to summarize the available data on reported catches of hooded seals, and to estimate total hunt-induced mortality for the years 1954-2006. Prior to the imposition of quotas in 1974, catches were highly variable in Canada, ranging from a couple hundred to more than 25,000. Between 1974 and 1982 catches averaged 12,500 but declined after 1982 due to a collapse in the major markets. For the most part, annual catches were in the range of a few hundred until the mid-1990s. In 1996, a large number of bluebacks were taken illegally, and a subsidy for meat resulted in catches of 7,000 in 1997 and 10,000 in 1998. Since then the annual harvest has remained low.
Between 1945 and 1960, hooded seals were hunted by Norwegian vessels; annual catches ranged from 1,500 to 48,000 and averaged 14,500. Less than 1,000 were taken by Norwegian scientists biennially between 1970 and 1978. Meanwhile, catches in Greenland were 1,000 to 2,000 between the mid-1950s and 1972; catches are relatively steady now, averaging 6,000 to 7,000 seals.
Total removals averaged 34,800 between 1954 and 1960; from 1974 to 1982 the average was 24,600. The majority of hooded seals are caught in Greenland. With the exception of 1996-1998, when Canadian catches accounted for 70 percent of annual catches, Greenland accounted for 65 percent of hooded seals killed. Approximately 30 percent of hooded seals killed are young of the year.
4.2.3 Determining Total Allowable Catch Levels for Nunavut Beluga and Narwhal
Pierre Richard
Fisheries and Aquaculture Management (FAM) requested advice from Science on the total allowable catch (TAC) for all Nunavut stocks of belugas and narwhals. FAM also requested that science advice be framed by its draft Precautionary Approach Framework; this requires a sufficiently long time series of assessments of population size, hunting mortality and concurrent population dynamics parameters. This is not feasible for data-poor stocks – stocks for which population dynamic parameters cannot be estimated; the conservative Potential Biological Removal (PBR) method was used to determine TAC for these stocks.

Beluga whales surfacing in a polynya
Photo: M. Ramsay

Pod of narwhal
Photo: Larry Dueck
The PBR results were also compared to a simple growth model used to determine risk probability of different levels of decline. In this model, uncertainty distributions were used to model the imprecision of population size and hunting loss rate and to model uncertainty in the population growth rate. The recommended total allowable landed catch, i.e.: PBR- hunting losses, when compared to the risk model with simple growth model, was shown to have a small probability of resulting in a declining trend. In the future, more surveys of these stocks may help to estimate trend and population dynamic parameters for these stocks.
4.3 Marine Mammal By-Catch
4.3.1 By-Catch of Harp Seals in the Newfoundland Lumpfish Fishery
Becky Sjare

Harp seal bycatch in a crab pot
Photo: DFO Newfoundland
By-catch is defined as the incidental entrapment or capture of non-target species during a fishing operation. Unfortunately it is a key conservation issue for numerous marine species around the world. All species of seals found in Newfoundland waters are incidentally taken in both active fishing gears, such as trawls, and passive gears, such as gillnets. In Newfoundland, harp seals are involved in the majority of entrapments, and most are caught in gillnets set for lumpfish.
Lumpfish occur along all coasts of the province and there are major concentrations on the St. Pierre Bank. The fishery uses monofilament gillnets with a mesh size of 25-27 centimetres usually set in 3-33 meters of water. Fishermen typically use between 20 and 100 nets that are set in a series of long strings and left to fish for two to three days before they are hauled.
The types of gear used, and the timing of the lumpfish fishery in Newfoundland, are key factors influencing the level of harp seal by-catch. The large mesh nets used in the fishery pose a significant barrier to the seals, possibly by being invisible to them, or attracting them when they become full of fish. In certain areas of the province, seal migration routes overlap with fishing activities. Young harp seals born in late February and early March migrate out of whelping areas located in the southern Gulf of St. Lawrence and northeast coast of Newfoundland in April and May. During this spring migration, some of the seals travel along inshore areas of Newfoundland; it is these animals that encounter lumpfish gillnets.
This research provides estimates of the number of harp seals taken annually from 1970-2003. Data were obtained from a by-catch monitoring program that required lumpfish fishermen to record fishing effort (roe landings) and the number of seals caught on a daily basis from 1989-2003. Prior to 1989, annual by-catch was estimated using historic roe landings.
From the beginning of the lumpfish fishery in 1970 until 1985 the by-catch of harp seals remained below 5,000 animals. In 1987, catches increased to a high of 13,100 seals and then declined to 3,600 in 1990. The peak by-catch for the time series was 46,394 seals in 1994; catch levels remained higher than 18,000 animals until 1997. In 2002 and 2003 there was a major down-turn in the fishery and by-catch levels dropped below 10,000 animals. Since 2003, catches have remained low. These estimates of annual by-catch vary depending on several key assumptions but they provide a long-term view of by-catch as a source of mortality.
4.3.2 Modified Fishing Gear to Reduce Incidental Cetacean Mortalities
Edward Trippel

Modified fishing ropes and gear
Photo: Edward Trippel
Incidental mortality of cetaceans due to bycatch and entanglement in commercial fishing gear is a conservation concern worldwide. It is estimated that the North Atlantic right whale, a critically endangered species, owes more than ten percent of its mortality and over half of serious injuries to entanglement in lobster pot and gillnet gear lines. Since the 1990s, a number of mitigation techniques to reduce mortalities in the right whale population have been tested. The use of some of these techniques has now been legislated in the commercial fishery.
However, the North Atlantic right whale population remains in a precarious state. This study investigated the current state of development and effectiveness of mitigation techniques through the addition of barium sulphate to fishing gear rope.
The development of a neutrally buoyant groundline was undertaken to reduce the probability of large whale entanglements. The resulting product maintained a much lower profile in the water column compared to traditional groundlines but in hard bottom areas it was susceptible to chaffing and breaking. In order to reduce mortalities once large whales are entangled, a weak rope was developed, again with the addition of barium sulphate. The breaking strength of this product was 1,065 pounds, which meets U.S. legislated limits but is half the weight of traditional groundlines.
4.4 Seismic Surveys and Navy Sonar
4.4.1 Bowhead Whale Feeding Aggregations in the Canadian Beaufort Sea and their Role in the Mitigation of Effects of Seismic Underwater Noise
Lois Harwood

Bowhead whales as seen from survey airplane
Photo: Lois Harwood
A systematic strip-transect aerial survey of the south-eastern Beaufort Sea was conducted on August 22-23, 2007. The objective of the survey was to update the knowledge of distribution and use of Beaufort Sea by bowhead whales, as the last comprehensive survey was done in 1986.
Twenty-four north-south transect lines were flown, providing approximately ten percent survey coverage of the south-eastern Beaufort. Primary observers recorded 132 bowhead whales on-transect, 38 off-transect and 71 during reconnaissance flights, for a total of 241 whales. The number of bowhead whales sighted on-transect was more than twice that of the 1980s survey, but the general areas where they aggregated were similar.
According to the definition of feeding aggregation area, being more than five bowheads per 100 squared kilometres, bowheads occurred in three main feeding aggregations in 2007. These were found off the Yukon coast between Komakuk Beach to Shingle Point, near the shelf-break north of the Mackenzie River estuary, and off the Tuktoyaktuk Peninsula.
The propensity of bowheads to aggregate, and a real-time knowledge of aggregation areas, provides an opportunity to establish mitigation procedures that can be
- more restrictive within localized bowhead feeding areas, to ensure no disturbance or injury to feeding whales, and
- less restrictive outside the feeding areas, so as not to unjustifiably constrain industry activity. Replicated aerial surveys are planned for August 2008 and August 2009.
4.4.2 Acoustic Monitoring of Killer Whales off Canada's West Coast
John Ford

Deployment of an acoustic recording package at sea
Photo: Hiromi Naito
The killer whale – the world's apex marine predator – can be found in all oceans but they are very rare in most regions. The waters off Canada's west coast are home to an unusual abundance of this species, and they have become a high-profile icon of the wild marine environment of British Columbia. Killer whales have long been a focus of field research by marine mammal scientists at DFO's Pacific Biological Station (PBS). Each year since the early 1970s, killer whales have been studied using photo-identification of individuals from natural markings. Registries of over 700 individual whales from three distinct assemblages – or ecotypes – of killer whales in British Columbia waters are maintained at PBS. This annual population monitoring is critical to recovery efforts for these ecotypes, all of which are listed under Canada's Species at Risk Act.
Thanks to this long-term study, many aspects of the life history and ecology of killer whales in British Columbia are becoming clear, but many gaps in our knowledge remain. A major source of uncertainty is the whereabouts of killer whales in winter, when most whales vacate their summer habitats in the protected inshore waters around Vancouver Island. Finding killer whales in remote waters off the west coast during winter is a daunting task, and the small vessels we use during our summer studies are not suitable for such work. Satellite tagging the whales is not yet a viable option due to the difficulty in attaching tags to the whales without capturing them and the short lifespan of the tags, which is usually limited to a month or two.
To learn more about the winter distribution of killer whales, we are developing a network of remote underwater acoustic monitoring stations in strategic locations along the BC coast to track the whales using their own vocalizations. Killer whales are ideal for this kind of monitoring, as their vocalizations are highly stereotyped and differ between populations and social groups. Thus, with only a few minutes of killer whale calls, we can determine which ecotype of whales is present and, especially for the so-called ‘resident' killer whales, we can identify the clans and pods involved.
Our acoustic monitoring stations are of two different kinds: onshore and offshore. A prototype onshore station has been tested over four winters at Langara Island, off the northwest corner of the Queen Charlotte Islands, or Haida Gwaii. This station consists of a weatherproof case containing a specialized computer with a custom-engineered sound detection system. It is powered by storage batteries that remain charged with solar panels. The instrument is connected by armored cable to an underwater microphone, or hydrophone, located on the sea floor about 100 metres offshore. When whale sounds are received by the hydrophone, the sound detection system triggers the computer to record a sample of underwater sound on a hard disk for later analysis. This station has yielded a great deal of new information on whale occurrence at this remote site, and we hope to deploy additional shore-based stations in the future.

Remote acoustic recording station (“Orcabox”) at Langara Island
Photo: John Ford
Our second kind of monitoring station is similar in function to the onshore units but the whole system is housed in a submersible watertight case for deployment in offshore waters. The case contains the hydrophone, a miniaturized computer system with hard disk for storing digital recordings, and batteries that allow monitoring and recording for up to a year. The offshore stations are anchored to the seafloor and are suspended 50 metres beneath the surface by floats. They are retrieved by triggering an acoustic release, which disconnects the anchor and allows the station to float to the surface for pick up.
A third method of monitoring killer whales acoustically is becoming possible through our collaboration with two new initiatives off the west coast – VENUS (Victoria Experimental Network Under the Sea) and NEPTUNE (Northeast Pacific Time-Series Underwater Networked Experiments). Both VENUS and NEPTUNE involve oceanographic sampling nodes on the seafloor that are linked via fibre optic cable to the Internet. These nodes will include hydrophones optimized for monitoring whale sounds, and will provide opportunities for researchers and the public alike to listen to killer whales in real time.
As our killer whale acoustic monitoring network grows, we anticipate that it will continue to provide new insights into the seasonal movement patterns of these enigmatic predators.
4.5 Marine Mammals as Sentinels of Environmental Contamination
4.5.1 Assessing the Potential Effects of Near Shore Hydrocarbon Exploration on Ringed Seals in the Beaufort Sea Region
Lois Harwood

Ringed seal at a breathing hole
Photo: DFO
The objectives of this study were to identify and evaluate any potential impacts of offshore industrial activities on resident seal populations, with a view to providing advice on any mitigating measures and monitoring studies which might be employed effectively in the future. The study focused on ringed seals from 2003-2006 in the fast ice habitat north of the Mackenzie River estuary in the Beaufort Sea.
Devon Canada's 2006 Paktoa drilling site was located close to the edge of the fast ice, which is a highly important feature of the arctic marine ecosystem and important for seals. This feature is used for establishing and defending mating territories, giving birth to and nurturing their pups, breeding and basking. The first three years of the study were conducted prior to industry activity at Paktoa, while the fourth year was conducted during the latter part of an exploratory drill season. In 2006 Devon successfully completed drilling and abandoned the well.
The mean distance of lairs and breathing holes from Paktoa were not significantly different among the non-industry and industry years. The same was true for frozen and active seal structures, which showed no significant differences among those same years. In 2006, the frequency distribution of distances of seal structures from the ice road, the airstrip, and research camp showed no tendency toward avoidance or attraction to these sites.
Twenty ringed seals were captured, instrumented with satellite-linked transmitters and released near the Paktoa site. The movements and size of the territories used by these tagged seals did not statistically vary between 2005 and 2006, when ice conditions were vastly different. Additionally, 68 ringed seals were collected to examine body condition and reproductive status of the local seal population. The collected specimens showed good body condition with ample fat stores, in normal reproductive status and most with prey in their stomach.
Overall, the study provided important baseline information on the use of the near shore Beaufort Sea by ringed seals during spring, and is a benchmark for any future studies involving multiple or longer-term drilling operations. The results suggest that one season of drilling by industry at the Paktoa site had no detectable effect on ringed seals in the study area. The effects of longer exposures to industrial activity remain unknown.
4.5.2 Killer Whales as Sentinels for Ocean Pollution
Peter Ross
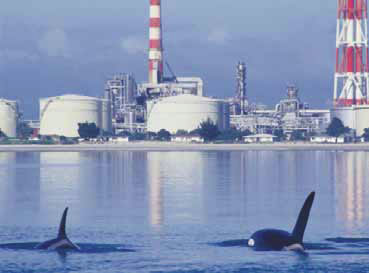
Orcas swim past an oil refinery
Photo: Ingrid Visser
Despite international efforts to control them, polychlorinated biphenyls (PCBs) and many other contaminants persist in the environment and can present health risks to marine mammals at the top of the food chain. British Columbia's killer whale populations face severe pressures. The Committee on the Status of Endangered Wildlife in Canada (COSEWIC) categorizes “southern residents” as endangered, “northern residents” as threatened and “transient” as threatened. “Resident” killer whales consume a diet that consists entirely of fish, while “transients” consume almost exclusively marine mammals.
Factors that threaten the recovery of B.C.'s resident killer whales include small population size, reduced availability of their primary prey (salmon), noise and disturbance. Resident killer whales are a charismatic viewing target for tourists, and steps are being taken to ensure that these ecotourism activities do not impede normal life processes, including feeding, socializing, and reproduction.
The harbour seal has helped provide insight into the threat posed to killer whales by contaminants such as PCBs. This small, non-migratory marine mammal has a similar physiology to killer whales. Sampling them is less disruptive than taking more dart biopsies from killer whales. The abundance of harbour seals, with 130,000 in B.C., allows researchers to select animals of a consistent age and condition, which gives more reliable data.
Whether contaminants originate nearby or far away, B.C.'s killer whales pick them up by eating coastal prey. Salmon, a major food source, migrate inshore from distant ocean waters, bringing small amounts of global toxics with them. Species such as rockfish, which spend their lives closer to the coast, carry more contaminants.
The prey's position in the food chain also makes a difference. Transient killer whales dine on seals, sea lions, porpoises, and other mammals that have already accumulated toxins from lower levels of the food chain. Thus the transient whales are more at risk for toxic effects than their resident, fish-eating cousins. B.C.'s killer whales are helping researchers and managers better understand the fate of environmental contaminants on a global scale.
4.6 Strandings and Mortality Events
4.6.1 Hunt Induced Mortality of Northwest Atlantic Harp Seals
Garry Stenson

Sealing vessels travelling to harp seal hunt near the Magdalen Islands
Photo: Mike Hammill
Information on the level of human induced mortality is required for accurate population estimates for any population. It is particularly important for exploited species that are subject to high catch levels, and thus it is needed to develop a responsible management plan. The Northwest Atlantic harp seal population is subject to various types of human induced mortality, including subsistence harvests in Greenland and the Canadian Arctic, commercial catches in southern Canadian waters, animals that are killed but not landed, and bycatch in commercial fishing gear.
The objective of this study was to summarize available estimates and update them for the years 1952-2004. Commercial and subsistence hunts accounted for the majority of removals. Between 1952 and 1971, catches averaged more than 288,000 seals in the commercial hunt. Quotas were introduced in 1972 and, until the demise of the large vessel hunt in 1982, 165,000 seals were taken annually. After 1982, catches averaged 52,000, until 1995 when they increased to an average of 258,000 seals.
In Greenland, catches were less than 20,000 prior to 1980, have increased steadily to a peak of over 100,000 in 2002, and declined again recently to approximately 70,000 seals. Limited data is available on catches in the Canadian Arctic, but it appears that the numbers are relatively low (less than 5,000). Thus, the total removals from 1952-1982 was 388,000 but declined to 178,000 annually between 1983 and 1995. Higher catches in Canada and Greenland commenced in 1996, resulting in an average annual removal of 471,000. Young of the year account for approximately 68 percent of current removals.
4.6.2 St. Lawrence Estuary Beluga – Review of Carcass Program
Lena Measures

Examination of a beached beluga whale
Photo: Lena Measures
In 2005, a workshop on the St. Lawrence Estuary beluga carcass program was conducted at the Maurice Lamontagne Institute with some 25 scientists and managers involved or interested in the program and invited external consultants. The workshop had two objectives: 1) to evaluate the value of the program in terms of four specified themes, causes of mortality and disease, contaminants and toxic effects, biology and demography and conservation; and 2) to determine the future of the program by examining options and consequences. A history of the carcass recovery program was presented as well as a description of the necropsy program. Additional presentations summarized present knowledge on parasitic and infectious diseases, exposure and toxic effects of contaminants, ecological and demographic information and conservation measures (national marine park and a proposed marine protected area) designed to protect the beluga and its habitat. A final presentation on the value of a marine mammal stranding program in California was presented for comparative purposes.
Four key recommendations resulted from the workshop:
- the St. Lawrence Estuary beluga carcass program is a world-recognized case study that should continue;
- available data should be shared and integrated, protocols should be standardized and documented, archived tissues and databases co-ordinated, etc;
- the core components of the program (monitoring, necropsy and sampling) should continue with adequate funding; and
- special research projects should be funded to investigate specific questions arising from the core program and to serve specific management needs. It was considered essential to validate, examine and integrate over 20 years of data made available in an accessible database so that various hypotheses could be tested and used to assist in understanding why this population has failed to recover. A proceedings report (2007/005) on the workshop is available at the following website:
www.meds-sdmm.dfo-mpo.gc.ca/csas/applications/Publications/publicationIndex_e.asp.
4.6.3 Reducing the Risk of Vessel and Right Whale Collision in the Roseway Basin Region of the Southwestern Scotian Shelf
Heath Stone
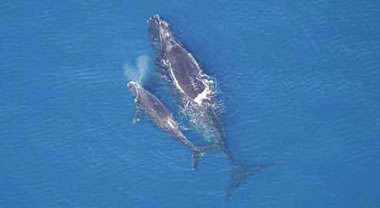
Right whale female and calf
Photo: NOAA-NMML

Figure 10. The southwestern Scotian Shelf with locations the Roseway Basin Right Whale Conservation Area (red) and designated right whale “Area to be Avoided” by commercial shipping (blue).
The North Atlantic Right Whale is one of the world's large whales. It is also one of the most endangered, and is listed as Endangered under Schedule 1 of the Canadian Species at Risk Act (SARA). Current population abundance is estimated at 350-400 individuals. The species appeared to decrease in abundance during the 1990s, and most of the documented human-induced mortality is attributed to vessel strikes. In 1993, DFO designated two conservation areas: Grand Manan Basin (Bay of Fundy) and Roseway Basin (between Browns and Baccaro Banks). Both areas are important for feeding and socializing and have high concentrations of right whales during the summer and fall.
Conservation measures to reduce the potential for right whale/vessel collisions in the Grand Manan Basin conservation area were successfully implemented in 2003 by Transport Canada and the DFO. Outside the Bay of Fundy, Roseway Basin is the only other known area in Canadian waters where North Atlantic Right Whales aggregate in relatively high numbers, but there are no current recognized vessel traffic management measures in this region.
In 2006, the National Marine Mammal Peer Review Committee (NMMPRC) of DFO Science reviewed a proposal to designate an “Area to be Avoided” around the Roseway Basin Conservation Area (Fig. 10). The proposal was based on scientific data, which compared the distribution of right whales with information on vessel traffic transiting the region. The NMMPRC concluded that a reduction in vessel traffic in this area would result in a reduced probability of right whale/vessel encounters, and thus increase the probability of species recovery.
On October 7, 2007, the International Maritime Organization (IMO) adopted the proposal (led by Transport Canada) to designate 1,780 square kilometres of Roseway Basin as an “Area to be Avoided” by ships 300 gross tons or more, solely in transit, from June 1 to December 31. The effective date is May 1, 2008.
4.7 Climate Change
4.7.1 Ringed Seals as Indicators of Change
Lois Harwood

Releasing a tagged ringed seal back to its hole
Photo: Lois Harwood
The ringed seal has a circumpolar distribution, and is the most abundant pinniped species in the Arctic Ocean. They are considered reasonable indicators of ecosystem health due to their position near the top of the food chain. They are omnipresent and important prey of polar bears; changes in seal distribution and abundance can have long-term survival consequences for polar bears. Ringed seals are a valued subsistence resource of the Inuvialuit. Past research on ringed seals of the Western Arctic revealed downward trends in seal abundance, reduced ovulation rates among mature females, reduced pups in the subsistence harvests, and reduced number of birth lairs in association with the heavy ice winter of 1974-1975.
Sampling of seals taken in the subsistence harvest has been done by a highly experienced seal hunter from Ulukhaktok, Northwest Territories. The parameters examined include determination of the ovulation rate of adult females, the proportion of pups in the subsistence harvest, year class strength, body condition (blubber thickness, body mass index) of harvested seals, and the recording of unusual observations and events by harvesters. Ovulation rates remained consistently high from 1992-1999 and have dropped slightly more recently. The annual proportion of pups in the open water harvest also showed a decreasing trend over the 2000-2006 time period. Blubber thickness showed a decline from 1992-2006 for all age classes except newly weaned pups.
This downward trend in seal reproduction and body condition tracked closely with the number of open water days in 2000, and 2002-2005. During years with a longer open water period, such as 1998 and 2001, ringed seals were fatter than in other years, and pup production was high. The mechanisms are not clearly understood, but appear related to changes in the timing of break up of sea-ice in spring. Timing of break-up influences the timing of the establishment of oceanographic conditions that favour the production of seal food items such as cod.
4.7.2 Killer Whales and Climate Change
Steve Ferguson

Killer whales spy-hopping
Photo: Graeme Ellis
Although controversial, killer whales have been implicated as major ecosystem modifiers creating trophic cascades as a result of ecosystem disruptions that include human commercial whaling. Climate change models predict major reductions in sea ice, likely resulting in changes in species distribution and abundance. It has been hypothesized that killer whales will move into Arctic waters as sea ice disappears, and that as top predators they will initiate major ecosystem adjustments. As such, the prediction is that killer whales will be major players in the reorganization of Arctic oceans currently undergoing global warming.
In this study, changes in distribution of killer whales in Hudson Bay were measured with decreasing sea ice as an example of global readjustments occurring with climate change. Records of killer whales in Hudson Bay, Hudson Strait, and Foxe Basin were summarized and related to an historical sea ice dataset. The results point to evidence of “choke points”, where sea ice inhibits killer whale movement, causing restrictions to their Arctic distribution. Hudson Strait appears to have been a significant sea ice “choke point” that opened up 50 years ago, allowing for the appearance of killer whales, and the advancing distribution of an ice-avoiding predator.
Killer whale sightings have increased exponentially, and are now reported in the Hudson Bay region every summer. The prediction is that other “choke points” will soon open up with the continued sea ice melt, producing punctuated predator-prey trophic cascades across the Arctic.
- Date modified: