
Habitat Highlight: Reconnecting aquatic habitat to improve fish passage in Newfoundland and Labrador
This Habitat Highlight describes Fisheries and Oceans' (DFO) collaboration with partners to identify and address the habitat degradation and modification caused by watercourse crossings in the province of Newfoundland and Labrador, with the goal of improving fish passage.
On this page
- Data collection through local and traditional knowledge
- How many barriers were found?
- Tools and technology
- Addressing barriers to fish passage
- What can you do to help?
- Future aquatic connectivity work in Newfoundland and Labrador
- References
Culverts are the most commonly installed type of watercourse crossing in Newfoundland and Labrador. They have the potential to act as full or partial barriers to fish passage if they are improperly installed or not maintained due to the buildup of debris, inadequate water depth, excessive water velocities, and vertical barriers (e.g. perched culverts)Footnote 1.
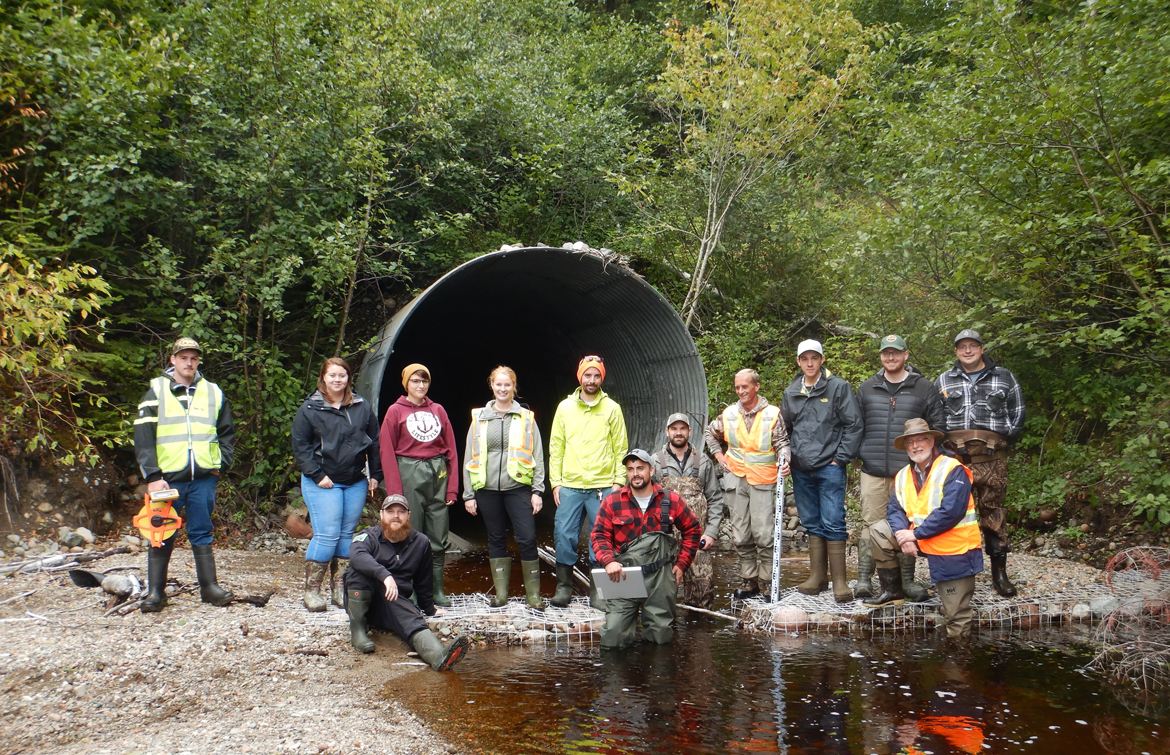
Aquatic habitat fragmentation is an issue of concern for the province's migratory fish species. To help address this concern, DFO's Aquatic Connectivity Assessment (ACA) Project, established in 2019, provided tools and survey protocols, and supported the collection of data on potential barriers to fish passage by various groups. Partners and stakeholders received funding to collect data in their regions of interest. DFO contracted environmental non-governmental organizations (ENGOs) and Indigenous groups to use their local and traditional knowledge to survey watercourse crossings and other physical barriers, which concurrently served to build capacity and partnerships, while building a database of barriers to fish. The ultimate goal of this project is to pair newly acquired data with existing information to assemble the big picture of aquatic connectivity in Newfoundland and Labrador. The information will be used to plan future work and prioritize restoration activities.
Data collection through local and traditional knowledge
Between 2019 and 2021, DFO issued 45 contracts to seven Indigenous groups and eight environmental non-governmental organizations (ENGOs) located on the Island of Newfoundland and the south coast of Labrador to survey culverts and other physical barriers on watercourses which were prioritized based on local and traditional knowledge. Surveys on watercourses that support Atlantic salmon and other fish species of local and cultural significance, such as brook trout and American eel were prioritized. Groups were provided with training to collect the data and supplied the data collection equipment. Once collected, data was analyzed by DFO, and results were shared with each group.
The ACA survey protocol was based on an existing protocol developed to assess fish passage in Terra Nova National ParkFootnote 2. It required taking standard culvert and water depth measurements at each culvert and measuring the slope for use as a surrogate for water velocity. The passability standards were set for salmonids, specifically, brook trout.
Departmental analysis of the measurements taken and photos collected determined if each site was a barrier, potential barrier, or not a barrier based on the following criteria:
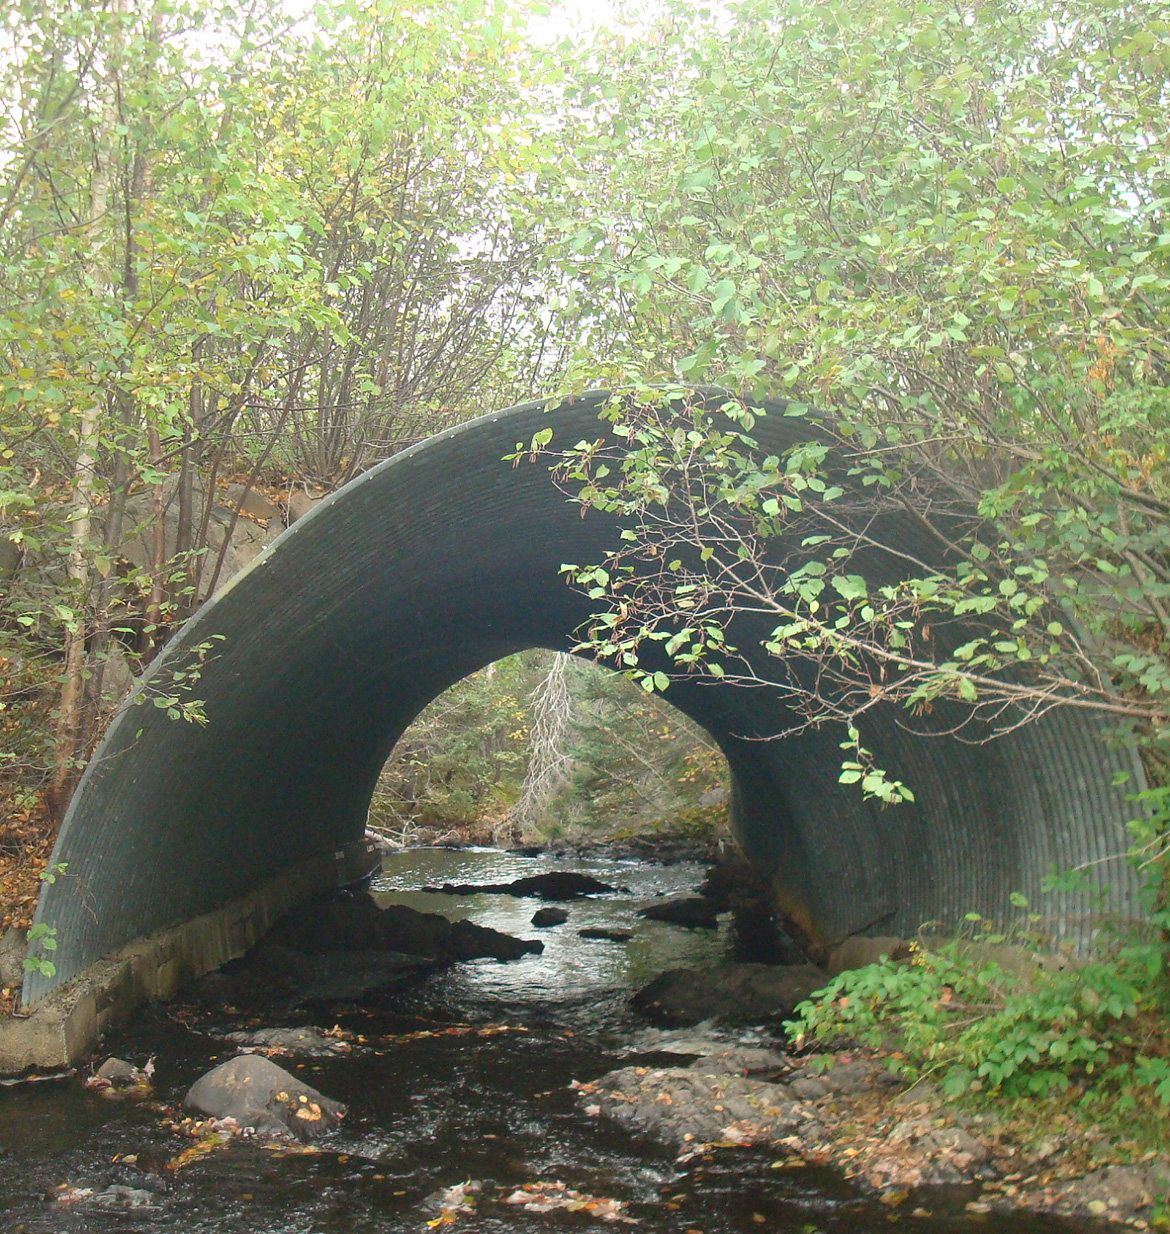
- if a culvert had a natural bottom or was backwatered, it was deemed to be a non-barrier
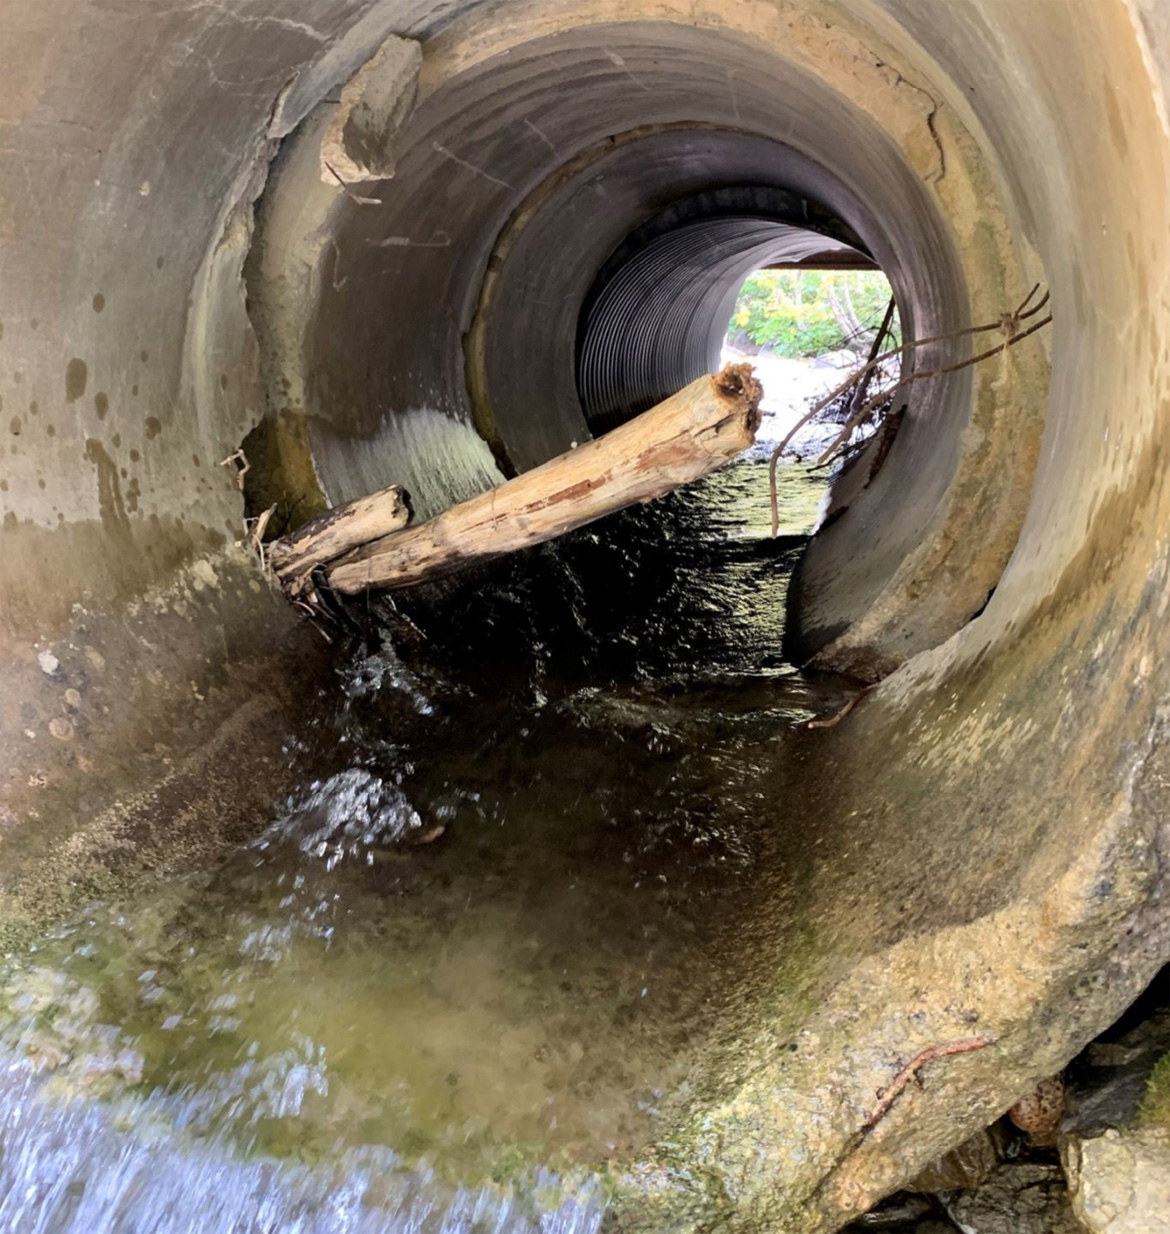
- if a culvert had a slope between 0.5-1.5% or other considerations (e.g. deteriorating condition, partially blocked, etc.), it was deemed to be a potential barrier to fish passage. This means it could be a barrier to a species or size of fish, or be a seasonal barrier (i.e. during periods of low water flow)
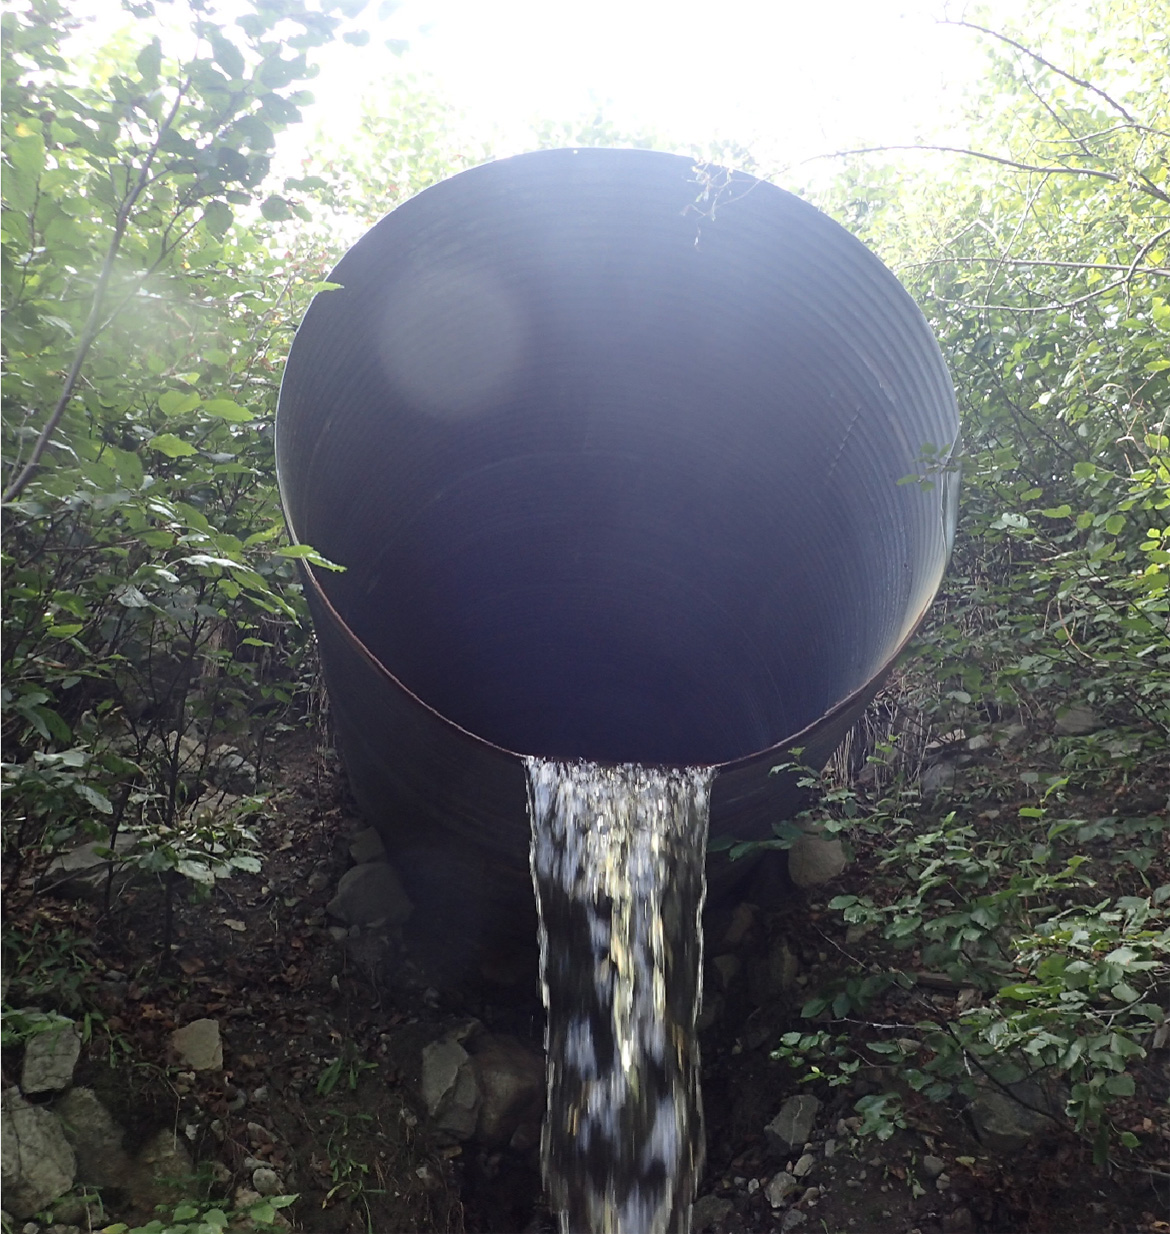
- if a culvert had an outlet drop (perch height) of more than 40 cm, or if outlet pool was less than 1.5 times the perch height, or if the slope was more than 1.5%, it was deemed a barrier to fish passage
Additional considerations such as deteriorating condition, partial blockages, culvert/bridge failure, grate blockages, and local knowledge were factored into the barrier determination. Figure 2 shows examples of culverts in good condition, poor condition, and very poor condition. The results of the barrier analysis are shown in figures 3 to 6.
How many barriers were found?
1750 sites were surveyed for the ACA project from 2019 to 2021. Figure 3 shows the percentage of crossings that were determined to be a barrier to fish passage for each National Hydrographic Network (NHN) watershed with greater than 10 surveys completed. As one example,104 crossings were surveyed in the Exploits watershed from 2019 to 2021; 16% were considered barriers to fish passage. Province-wide, figure 3 shows a relatively low percentage (0-20%) of crossings determined to be barriers throughout southern Labrador and large parts of the Avalon Peninsula and central Newfoundland. A relatively high percentage (21-40%) of crossings were determined to be barriers in western, southern, and northeastern parts of the Island. None of the watersheds with more than 10 surveys completed had more than 40% barriers.
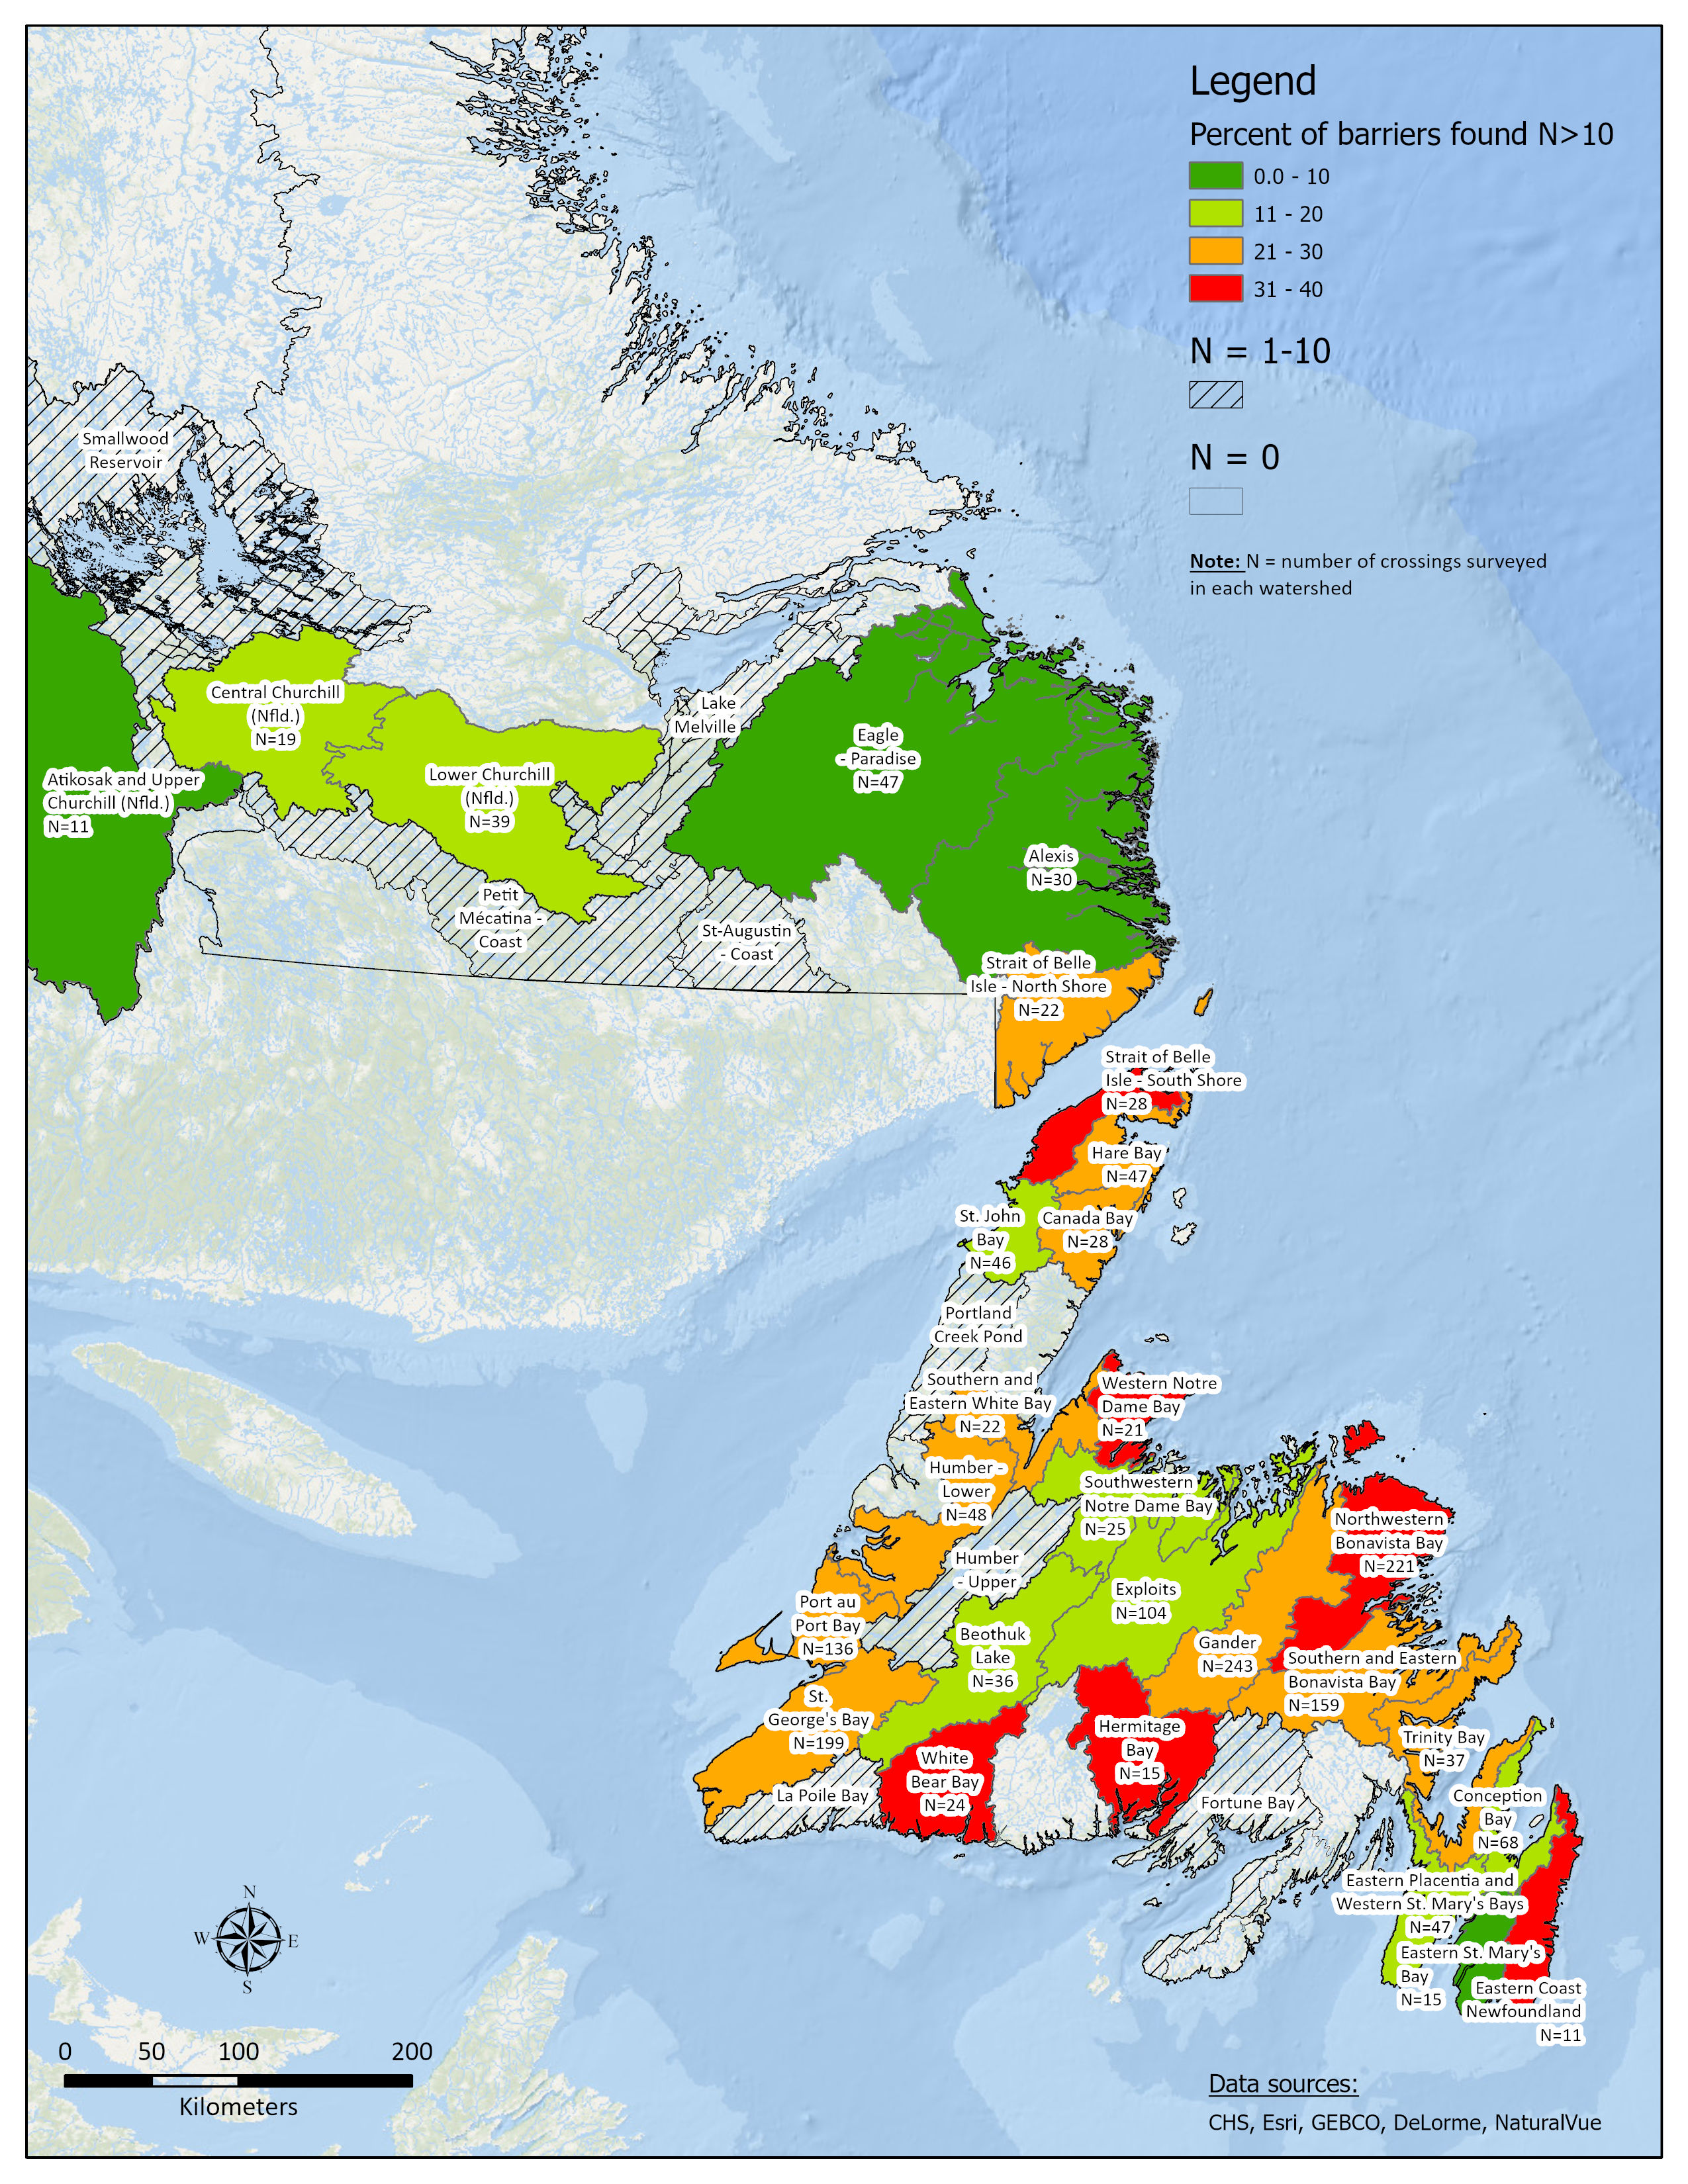
Figure 3 - Text version and data sources for base map
| National Hydrographic network (NHN) watershed name | Number of ACA surveys completed | Number of surveyed crossings that are barriers to fish passage | Percent of surveyed crossings that are barriers to fish passage |
|---|---|---|---|
| Alexis | 30 | 2 | 6.67 |
| Atikosak and Upper Churchill (NL) | 11 | 0 | 0.00 |
| Beothuk Lake | 36 | 7 | 19.44 |
| Canada Bay | 28 | 6 | 21.43 |
| Central Churchill (NL) | 19 | 3 | 15.79 |
| Conception Bay | 68 | 10 | 14.71 |
| Eagle - Paradise | 47 | 4 | 8.51 |
| Eastern Coast Newfoundland | 11 | 4 | 36.36 |
| Eastern Placentia and Western St. Mary's Bays | 47 | 5 | 10.64 |
| Eastern St. Mary's Bay | 15 | 0 | 0.00 |
| Exploits | 104 | 17 | 16.35 |
| Gander | 243 | 52 | 21.40 |
| Hare Bay | 47 | 12 | 25.53 |
| Hermitage Bay | 15 | 6 | 40.00 |
| Humber - Lower | 48 | 14 | 29.17 |
| Lower Churchill (NL) | 39 | 7 | 17.95 |
| Northwestern Bonavista Bay | 221 | 70 | 31.67 |
| Port au Port Bay | 136 | 33 | 24.26 |
| Southern and Eastern Bonavista Bay | 159 | 37 | 23.27 |
| Southern and Eastern White Bay | 22 | 5 | 22.73 |
| Southwestern Notre Dame Bay | 25 | 4 | 16.00 |
| St. John Bay | 46 | 7 | 15.22 |
| St. George's Bay | 199 | 47 | 23.62 |
| Strait of Belle Isle - North Shore | 22 | 6 | 27.27 |
| Strait of Belle Isle - South Shore | 28 | 10 | 35.71 |
| Trinity Bay | 37 | 11 | 29.73 |
| Western Notre Dame Bay | 21 | 7 | 33.33 |
| White Bear Bay | 24 | 9 | 37.50 |
| Watersheds with 10 or fewer surveys completed | |||
| Fortune Bay | 5 | 0 | 0.00 |
| Humber - Upper | 3 | 0 | 0.00 |
| Lake Melville | 4 | 0 | 0.00 |
| La Poile Bay | 8 | 0 | 0.00 |
| Petit Mecatina-Coast | 1 | 1 | 100.00 |
| Portland Creek Pond | 3 | 0 | 0.00 |
| Smallwood Reservoir | 10 | 2 | 20.00 |
| St-Augustin-Coast | 4 | 0 | 0.00 |
Data sources for base map
Canadian Hydrographic Service (CHS), Environmental Systems Research Institute Inc. (ESRI), General Bathymetric Chart of the Oceans, DeLorme World Basemap, NaturalVue.
Of the 1750 sites that were assessed during the span of three years, 73% were culverts, 20% were bridges, and 7% were other structures, such as dams, weirs, fording sites, and natural barriers.
Figure 4 summarizes the results of ACA project from 2019 to 2021. Of the total 1750 sites that were assessed, fifty-four percent (54%) of the total sites assessed were identified as not barriers to fish passage, whereas 22% of the sites assessed were identified as barriers to fish passage. The number of sites that were assessed as potential barriers to fish passage was 15%. Beaver dams constituted about 1% of the total sites assessed and are not considered to be permanent barriers to fish passage. Seven percent (7%) of the assessed sites were incomplete due to access issues, or inability to make a barrier analysis due to missing data. One percent (1%) of the sites were categorized as “Other”, which includes sites that are not likely fish bearing. The incomplete sites are flagged for future follow-up to collect the missing data if the area is safely accessible.
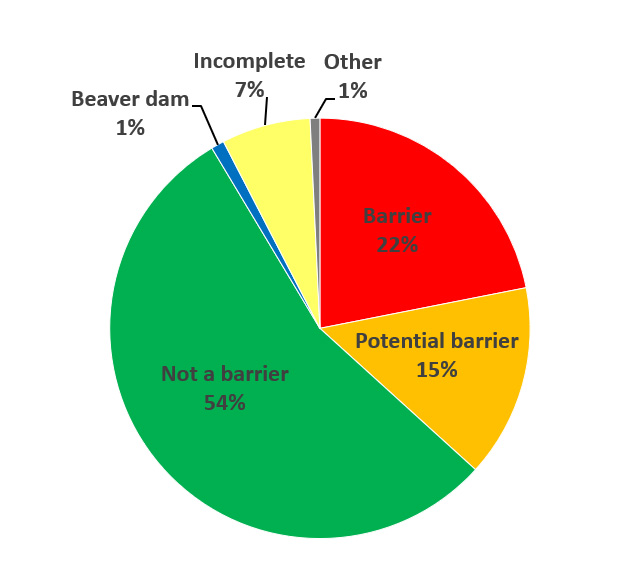
Figure 4 - Text version
| Year | Barrier | Potential barrier | Not a barrier | Beaver dam | Incomplete | Other | Total |
|---|---|---|---|---|---|---|---|
| 2019 | 128 | 86 | 193 | 15 | 65 | 11 | 498 |
| 2020 | 130 | 100 | 380 | 6 | 19 | 1 | 636 |
| 2021 | 123 | 72 | 378 | 7 | 35 | 1 | 616 |
| Total | 381 | 258 | 951 | 28 | 119 | 13 | 1750 |
| Pie chart percentage | 22% | 15% | 54% | 1% | 7% | 1% | 100% |
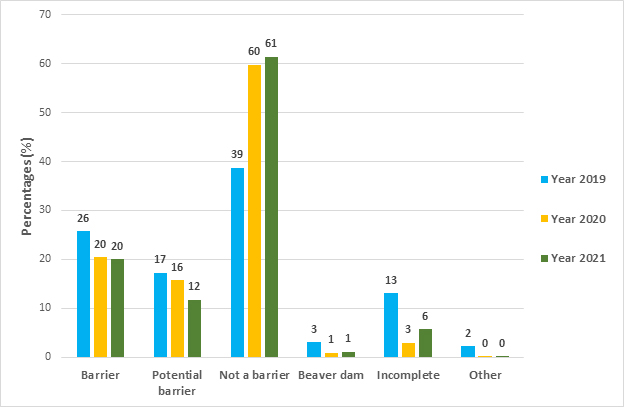
Figure 5 - Text version
| Year | Barrier (%) | Potential barrier (%) | Not a barrier (%) | Beaver dam (%) | Incomplete (%) | Other (%) |
|---|---|---|---|---|---|---|
| 2019 | 26 | 17 | 39 | 3 | 13 | 2 |
| 2020 | 20 | 16 | 60 | 1 | 3 | 0 |
| 2021 | 20 | 12 | 61 | 1 | 6 | 0 |
ACA project results separated by year are shown in figure 5 for years 2019 to 2021. The percentage range of each result does not change significantly from year-to-year.
Figure 6 shows ACA project results for culverts from 2019 to 2021. The percentages of culverts that were determined to be barriers ranged from 32 to 38%, the range for potential barriers was 21 to 30%, and the range for non-barriers ranged from 33 to 47%.
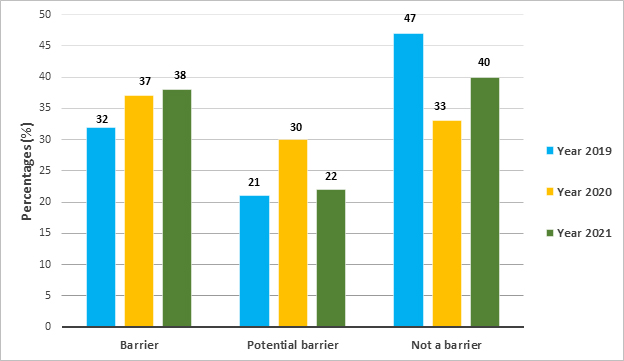
Figure 6 - Text version
| Year | Barrier | Potential barrier | Not a barrier | Total |
|---|---|---|---|---|
| 2019 | 128 | 86 | 193 | 407 |
| 2020 | 121 | 99 | 111 | 331 |
| 2021 | 117 | 69 | 124 | 310 |
| - | - | - | - | 1048 |
| Year | Barrier (%) | Potential barrier (%) | Not a barrier (%) | |
| 2019 | 32 | 21 | 47 | - |
| 2020 | 37 | 30 | 33 | - |
| 2021 | 38 | 22 | 40 | - |
Tools and technology
The right data collection tools and technology are needed to ensure safety and measurement accuracy. For example, using a self-levelling laser level kit to measure culvert slope greatly simplifies measurements, improves accuracy, and reduces potential human error. DFO provided partners with the equipment needed for the survey protocol and trained each contracted group to use it. In 2021, data collection was transitioned from paper forms to a publicly available application called Survey123. Feedback on this new method of data collection is extremely positive, as it saves time and effort for both contracted groups and DFO. This migration to electronic data collection makes the data available in real time and improves overall data quality and resource efficiency.
Addressing barriers to fish passage
DFO has been using the data from this project to flag barriers in order to work with the owners of the watercourse crossing structures to address issues. The department is also developing a prioritized inventory of structures that do not have owners that would be good candidates for future restoration (e.g. removal, mitigation, or replacement), where department and stakeholder resources allow. The department will use this information, as well as engagement input from partners and stakeholders, to identify restoration priorities.
What can you do to help?
Anyone can report a potential barrier to fish passage in Newfoundland and Labrador by emailing FPP-NL@dfo-mpo.gc.ca. Details to include are the GPS coordinates of the location of the barrier, photos, information about the perceived obstructions, and owner of the barrier (if known). DFO will respond to all inquiries. Any other harmful impacts to fish and fish habitat can also be reported to the same email address.
Future aquatic connectivity work in Newfoundland and Labrador
Due to the success and wide-reaching scope of the ACA Project since it began, the department plans to continue this work into the foreseeable future and to expand data collection activities into watersheds that have not yet been surveyed. This will continue to build on the work to date and expand to include historic dam sites. The goal is to integrate the barrier data into the publicly available Canadian Aquatic Barriers Database.
- Date modified: