
Threats to fish and fish habitat in the watersheds of Newfoundland and Labrador
Read about fish and fish habitat in Newfoundland and Labrador, and work that Fisheries and Oceans Canada (DFO) is doing with partners to identify and address threats like aquatic fragmentation caused by barriers and habitat degradation and loss caused, in part, by aquatic invasive species.
On this page
- Overview of fish and fish habitat in Newfoundland and Labrador
- Habitat Highlight: Reconnecting aquatic habitat to improve fish passage
Overview of fish and fish habitat in Newfoundland and Labrador
Land, water and hydrology
Newfoundland and Labrador (NL) (Figure 1) is the easternmost province in Canada. It has 405,720 km2 of land, three quarters of which is in Labrador (294,330 km2). An estimated 12.5% , or 31,240 km2 of the province, is water and there is 17,542 km of coastlineFootnote 1.
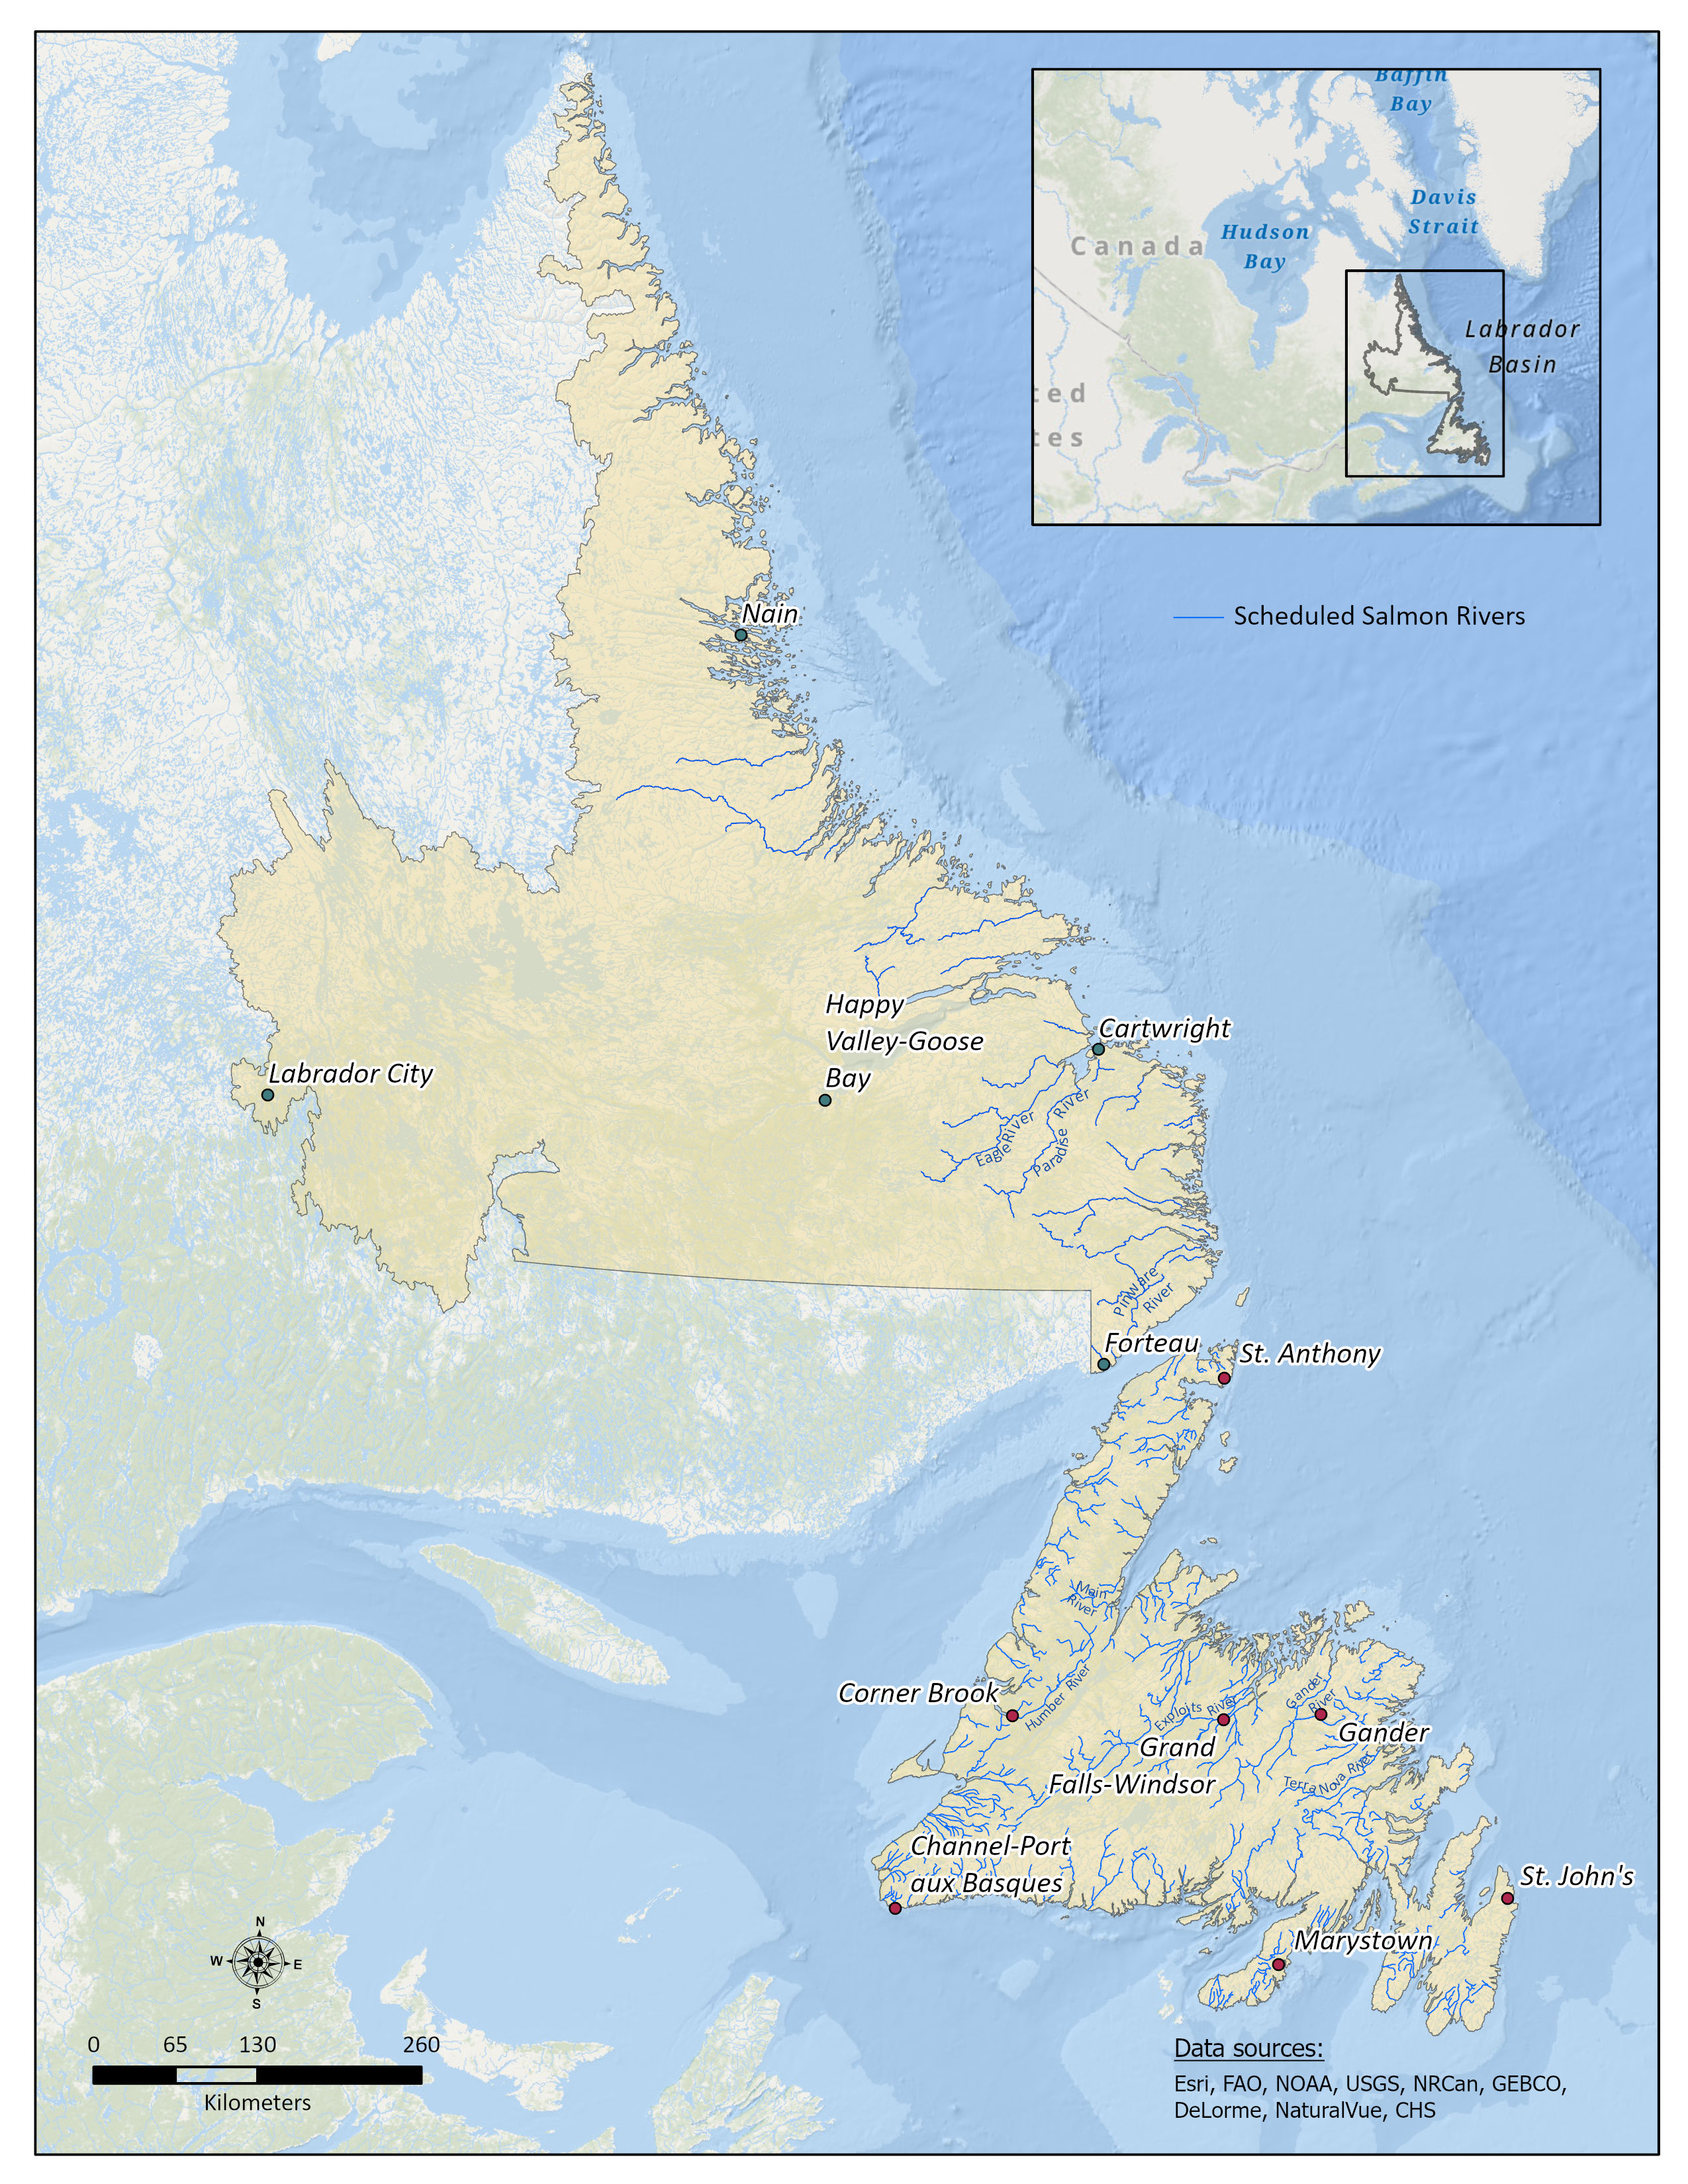
Figure 1 - Data sources for base map
Canadian Hydrographic Service (CHS), DeLorme World Basemap, Environmental Systems Research Institute Inc. (ESRI), Food and Agriculture Organization (FAO), General Bathymetric Chart of the Oceans, National Oceanic and Atmospheric Administration (NOAA), Natural Resources Canada (NRCan), NaturalVue, United States Geological Survey (USGS).
The Island of Newfoundland has a very rugged coastline that is highly indented with deep harbours, while the interior is mainly elevated, undulating plateau which generally tilts towards the northeast. The Long Range Mountains, which run from the extreme southwest region of the island and up along the Great Northern Peninsula, have the highest peak of 814 metres. The Humber Valley area, by contrast, consists largely of a northeast-southwest trough, in which lie Deer Lake and Grand Lake. The central to eastern region varies topographically from low relief to peaks of up to 300 metres on the Avalon and Southern Region plateau.
The surficial geology of Newfoundland is mainly characterized by glacial till, including glacial-fluvial sand, gravel, and large boulders called erratics. Due to glacial rebound, a relative fall in sea level has caused sediments originally deposited in a marine environment to be exposed above present sea level as sand and gravel in deltas and beaches, and as sand, silt, and clay in the nearshore environment.
The relief of Labrador ranges from sea level to over 1,500 metres in the Torngat Mountains. The coastline is rugged and consists of irregular bays bordered by rocky islets. The interior is essentially a large plateau with elevations varying between 300 and 650 metres.
The moist climate and plentiful snowfall in Newfoundland and Labrador accounts for a high-water table in all areas. That means lakes are usually full and rivers flow perennially. Lakes and ponds range in size from small peat-bog ponds of a few hundred square metres to lakes having surface areas in the hundreds of square kilometresFootnote 2.
In the interior of Labrador, hundreds of lakes have been combined by canals, dikes, and dams to create the Smallwood Reservoir behind the huge hydro development of Churchill FallsFootnote 3. With a surface area of 3,640 km2, this reservoir is the largest water body in the province. The largest water body on the Island of Newfoundland is Grand Lake, located in the interior of the western region of the province. It has a surface area of 354 km2. Gauged rivers with the largest flow in the province include the Churchill and Eagle Rivers in Labrador, and the Exploits, Humber, Gander, Cat Arm, Terra Nova, Bay du Nord, Grey, Piper's Hole, Garnish, Isle aux Morts, and Rocky River in Newfoundland.
Some notable trends have been observed in water quality since the commencement of standardized monitoring in the province in 1986Footnote 4. Described below are some trends, threats to fish and fish habitat due to the existing water quality, and stewardship programs in the province.
A recent studyFootnote 5 examined trends in water quality parameters from 1986 to 2013. The study examined trends in 36 different water quality parameters from 65 different water quality monitoring stations (including two from Labrador) located on representative rivers throughout the province. This study aimed to identify any difference in parameter trend results with an additional 10 years of data after the original studyFootnote 6. Throughout the province, copper, pH, zinc, and lead are consistently displaying improving trends (decrease in concentration) since 1986 due to a reduction in the rate of atmospheric deposition for copper, zinc, and lead. Turbidity, colour, dissolved organic carbon, and nitrogen generally displayed a deteriorating trend (increase in concentration). Increased precipitation from climate change along with global carbon emissions played a major role in influencing these parameters in non-urban or remote locations. Arsenic, beryllium, cadmium, chromium, cobalt, lead, molybdenum, and selenium consistently measured below lab detection limit, which influenced the trend results for these parameters. It has been observed that anthropogenic, natural, and global causes have played a role in these changes. Generally, urban water quality monitoring station parameters were influenced by anthropogenic activities where local stressors played a greater role in influencing water quality parameter trendsFootnote 7.
Pollution, sedimentation, and decreased water quality can affect fish by impacting their habitat, food sources, growth potential, and reproductive abilities.
Excessive quantities of suspended sediment may:
- destroy feeding and spawning areas by smothering plant and invertebrate growth on the bottom
- reduce light penetration
- decrease general food production
- affect certain respiratory tissues which have a negative impact on a fish's ability to swim
Suspended sediment also increases turbidity, which affects fish by making it harder for them to see their prey, reducing feeding rates, and, in turn, growth rates. Sediment deposition can smother fish eggs and alevins if occurring during spawning, incubation, or hatching periods. In most local waters lead is fairly rapidly precipitated out and is a lesser problem, though zinc and copper are toxic to fish at very low concentrationsFootnote 8. Proper precautionary measures to maintaining good water quality in the province are pivotal for healthy fish populations.
To address the water quality impacts to fish and fish habitat in NL, there are numerous river stewardship programs and societies which promote the health of several rivers including Rennie's River, Waterford River, Virginia River, Codroy Brook, and Corner Brook. The programs carry out urban river enhancement activities, including restoration to facilitate fish spawning, alleviation of pollution, and development of appropriate public access to the system. These stewardship programs continue to increase public awareness and education of activities that are detrimental to urban waterways. The efforts of river stewardship programs have led to an improvement in water quality by reduction of metals such as copper, cobalt, lithium, magnesium, and zinc in select eastern urban stations with the highest population density in NLFootnote 9. The existence of these stewardship programs is essential for the continual improvement of parameter trends in our waters.
Land use
Newfoundland and Labrador is sparsely populated, with most settlements on the Island of Newfoundland (insular Newfoundland) occupying the coastline and most of Labrador's largest towns located in the interior. The province has relatively limited industrial activity other than resource extraction; namely, mining, oil and gas, forestry, and fishing. There is also hydroelectric development and infrastructure development (e.g. roads and transmission lines). All of these activities put pressure on fish and fish habitat.
Human footprint mapping provides a composite measure of the developments noted above, as well as other human uses and developments on the landscape. It has been used to describe the impact of human activities in other regions of Canada, the US and the worldFootnote 10. The original methodology was developed at a global scale by scientists at Wildlife Conservation Society (WCS) and the Center for International Earth Science Information Network (CIESEN) at Columbia UniversityFootnote 11, and then re-scaled by WCS for the Northern Appalachian Region of the northeastern USFootnote 12. The methodology used for the Northern Appalachian Region was modified for the Island of Newfoundland in 2008Footnote 13 and extended to Labrador in 2013Footnote 14. It incorporated a variety of measures under 4 broad land-based categories: Human Habitation, Roads and Trails, Electrical Power Generation and Distribution, and Resource Development (plus Military, Aviation, and Communications for Labrador). Each measure was assigned a range of scores reflecting the level of anthropogenic impact, as can be seen in figure 2, ranging from low impact (0-2) to high impact (8-10). Figure 2 shows the average human footprint value for each of the National Hydrographic Network (NHN) watersheds on the Island of Newfoundland (data was not available for Labrador at the time of writing). Values are grouped into the following ranges: 0-2, 2-4, 4-6, 6-8, 8-10, with 0-2 being the lowest human footprint and 8-10 being the highest human footprint.
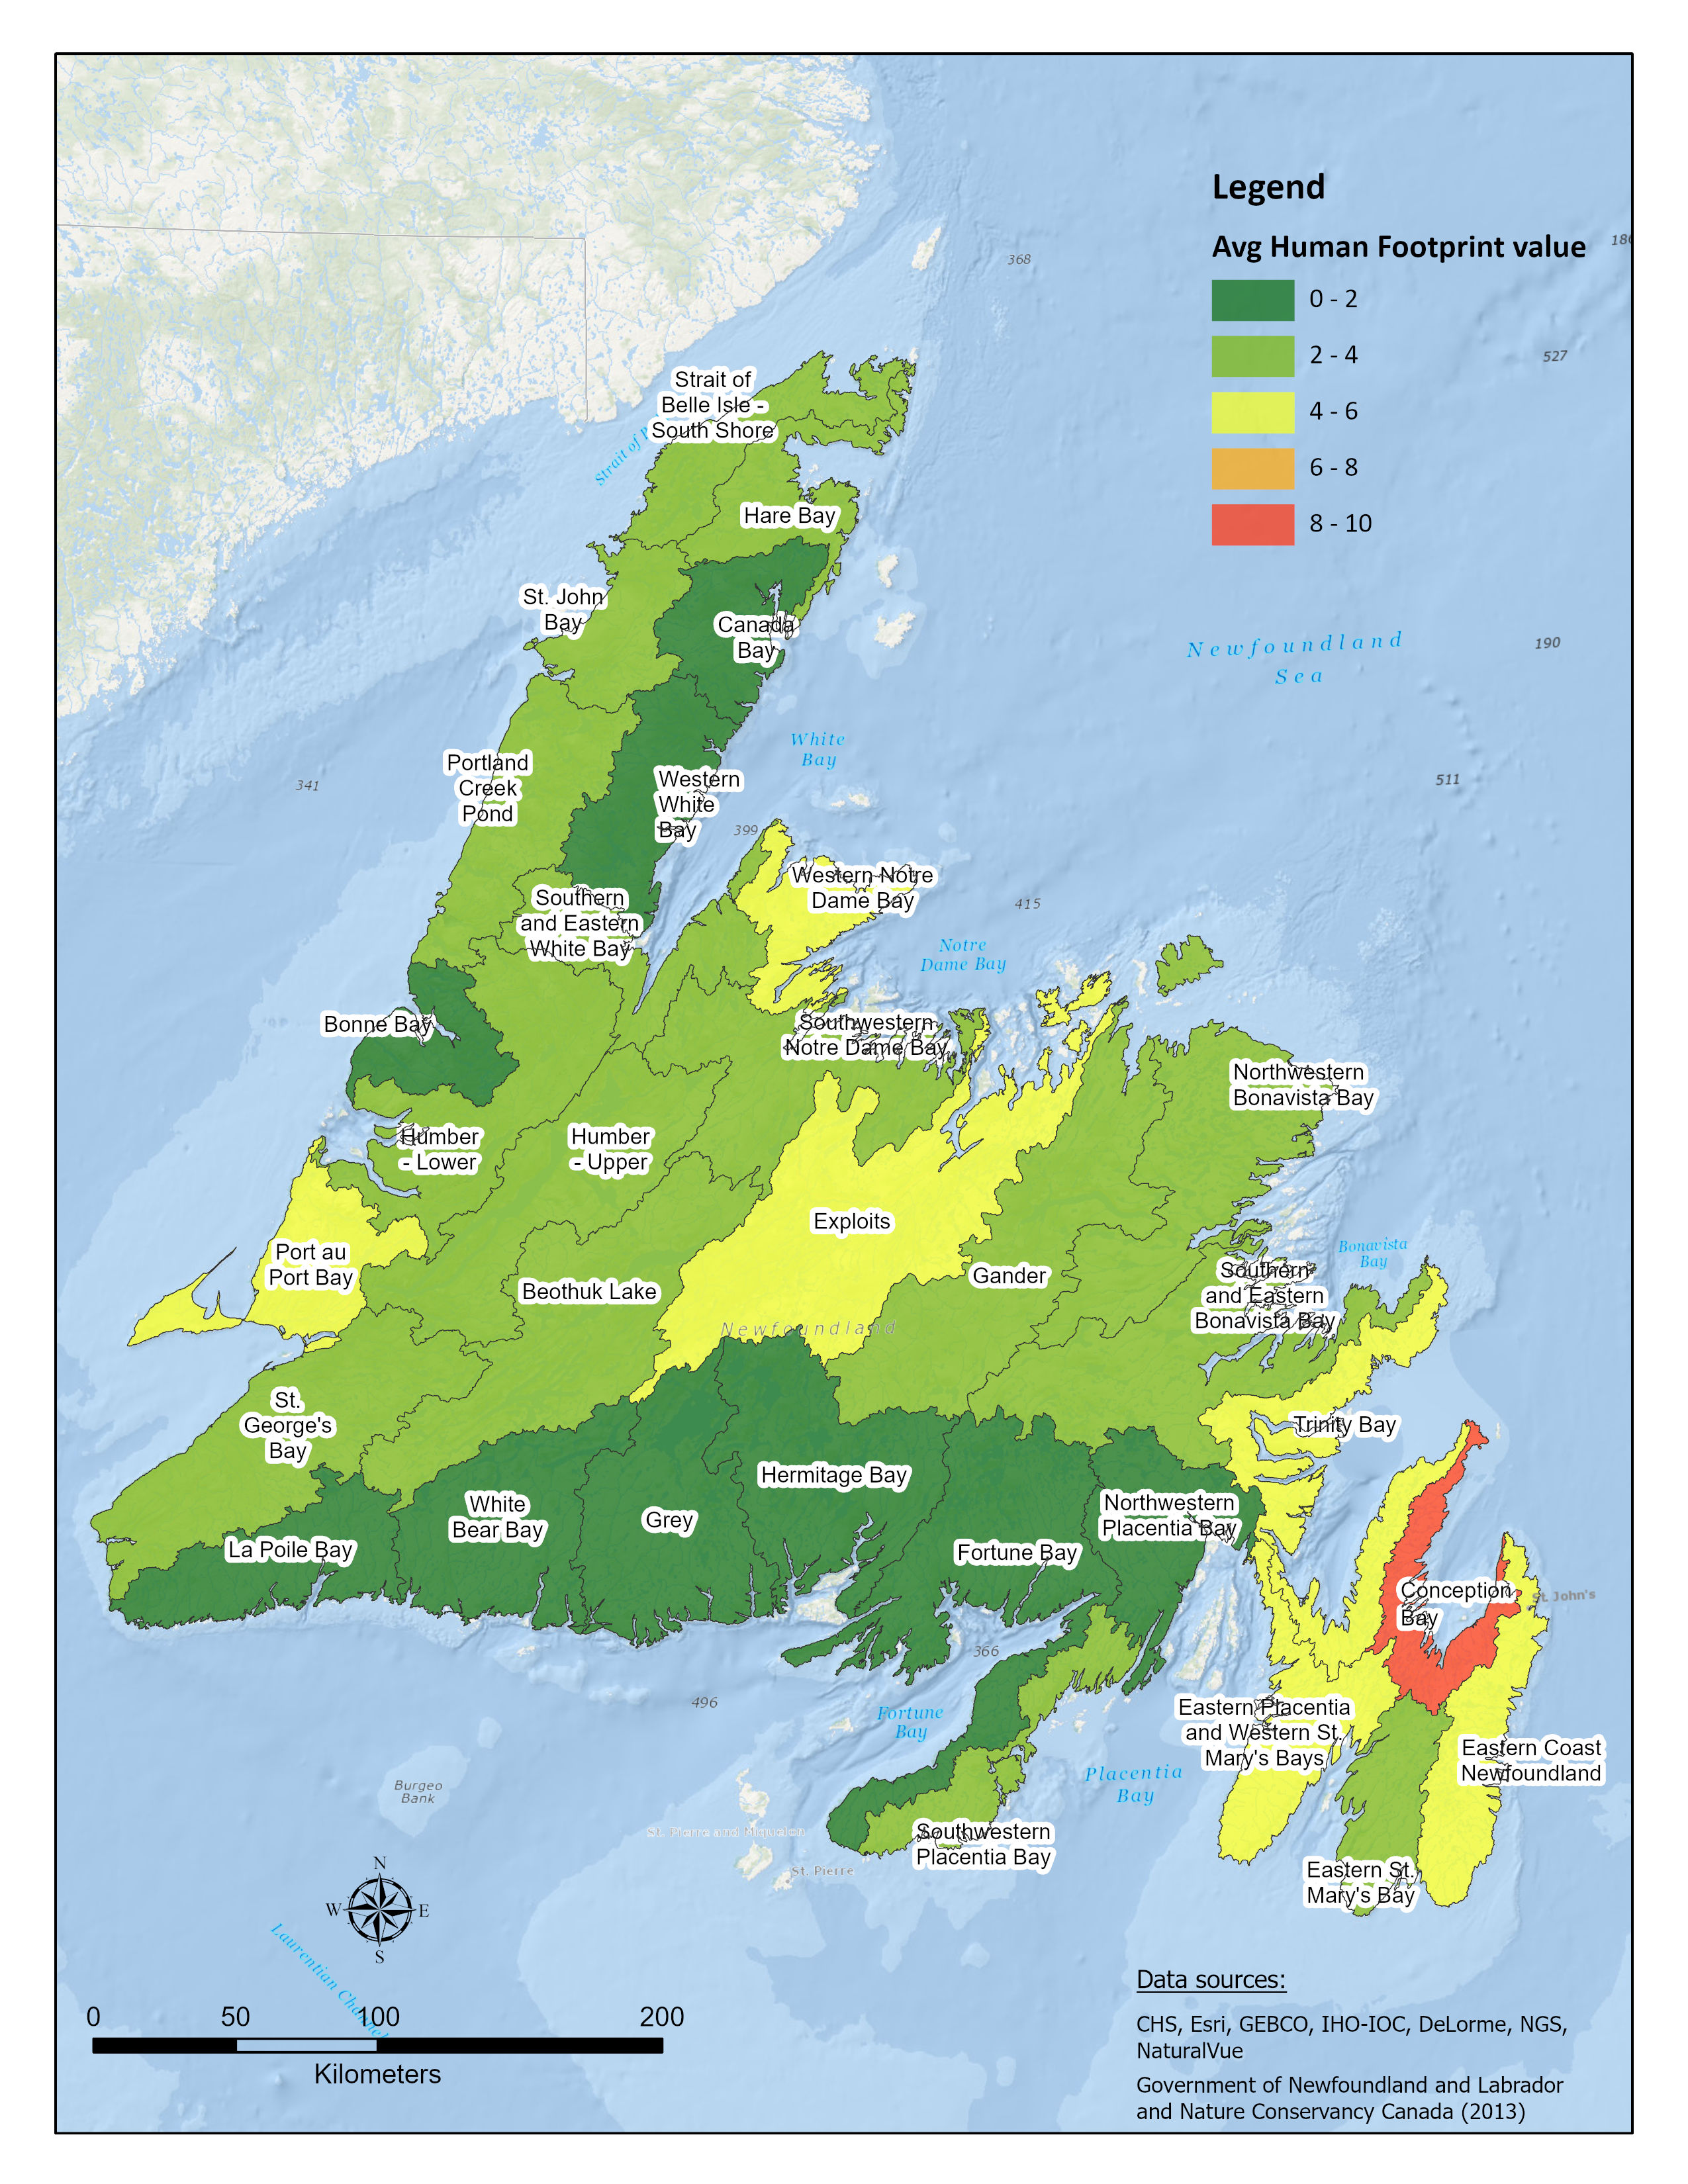
Figure 2 - Text version and data sources for base map
| National Hydrographic network (NHN) watershed name | Average human footprint value |
|---|---|
| Beothuk Lake | 2.57 |
| Bonne Bay | 1.82 |
| Canada Bay | 1.16 |
| Conception Bay | 8.81 |
| Eastern Coast Newfoundland | 5.62 |
| Eastern Placentia and Western St. Mary's Bays | 4.12 |
| Eastern St. Mary's Bay | 3.58 |
| Exploits | 4.34 |
| Fortune Bay | 1.34 |
| Gander | 3.11 |
| Grey | 0.32 |
| Hare Bay | 2.91 |
| Hermitage Bay | 1.76 |
| Humber - Lower | 3.65 |
| Humber - Upper | 3.05 |
| La Poile Bay | 1.03 |
| Northwestern Bonavista Bay | 2.98 |
| Northwestern Placentia Bay | 1.56 |
| Port au Port Bay | 4.63 |
| Portland Creek Pond | 2.02 |
| Southern and Eastern White Bay | 2.45 |
| Southwestern Notre Dame Bay | 3.96 |
| Southwestern Placentia Bay | 3.81 |
| Southern and Eastern Bonavista Bay | 2.49 |
| Strait of Belle Isle - South Shore | 2.85 |
| St. George's Bay | 3.06 |
| St. John Bay | 2.64 |
| Trinity Bay | 5.98 |
| Western Notre Dame Bay | 5.30 |
| Western White Bay | 0.79 |
| White Bear Bay | 0.78 |
Data sources for base map
CHS, DeLorme World Basemap, ESRI, General Bathymetric Chart of the Oceans, Government of Newfoundland and Labrador and Nature Conservancy of Canada 2013, International Hydrographic Organization-Intergovernmental Oceanographic Commission, National Geodetic Survey, NaturalVue.
Average human footprint values vary province wideFootnote 14. The lands draining into Conception Bay have the highest human footprint value of all NHN watersheds on the Island, reflecting the large number of small and medium-size communities in this region. The eastern coast of Newfoundland shows a moderate human footprint value, reflecting both the high footprint around the metropolitan St. John's region, and the sparse population and limited industrial activity for the larger southern extent of the watershed. Much of the south coast of the Island, the eastern flank of the Northern Peninsula, and the Bonne Bay watershed have the lowest average footprint values from a combination of sparse population, limited industrial activity, and the protections associated with Gros Morne National Park. The large majority of the Island, Western Northern Peninsula, west-central, and northeast coast sit in the mid-range.
Many watercourses throughout insular Newfoundland and later, some in Labrador, were dammed for hydro generation beginning in the late 1800s. Dams can impact riverine biological and physical longitudinal connectivity. Dams have also been built for agricultural, commercial, industrial, and domestic water supplies. Of the 708 dams in the provincial inventory, many are currently located on insular Newfoundland (550) with a lesser amount in Labrador (158)Footnote 15. From the late 1800s to the 1960s and 1970s, many dams were created by the forestry industry for log transport. Later increases in the use of skidders and pallet trucks meant more roads, with the need for bridges and culverts.
Key habitats and aquatic species
Newfoundland and Labrador has been categorized into 20 distinct ecoregions and 60 subregions (Footnote 16,Footnote 17). Although terrestrially defined, these ecoregions support aquatic habitats such as lakes, rivers, riparian zones, wetlands, and ponds, as well as coastal and marine areas such as estuaries, salt marshes, and eelgrass beds.
Coastal and estuarine areas support a diversity of marine fish and fish habitat in Newfoundland and Labrador. Seagrasses, specifically eelgrass beds (the only widespread species in Atlantic Canada), provide nursery and other critical habitat for many fish species (Footnote 18,Footnote 19,Footnote 20,Footnote 21). Eelgrass is particularly important habitat for small-bodied fishes along the Newfoundland coast and serves as nursery and rearing habitat for important commercial finfish species such as Atlantic cod (Footnote 22,Footnote 23,Footnote 24,Footnote 25,Footnote 26).
Estuaries also support productive and relatively rare saltmarsh and brackish water systems in the province (e.g. St. Paul's Inlet, Lake Melville). River inflow to these areas can result in input of organic matter, nutrients, and freshwater zooplankton from upstream (Footnote 27,Footnote 28). Studies on St. Paul's Inlet on Newfoundland's Northern Peninsula have shown that these saltmarsh ecosystems provide important habitat for numerous and diverse zooplankton (including copepods), and fish speciesFootnote 29. Differences in sampling type, location, time of day, or sampling effort along with human interaction with the inlet and the food web may have accounted for changes in species composition and abundanceFootnote 30. This comparative study therefore warrants a greater understanding of anthropogenic influences on fish habitat.
The biodiversity of freshwater fish species on the island portion of the province is relatively low compared to the rest of Canada, however Labrador's freshwater fish diversity is higher (Footnote 31,Footnote 32,Footnote 33) and similar to that of northern Quebec as they share a land border. Marine areas throughout the province support diverse communities of fish species. Newfoundland and Labrador's aquatic habitats are home to a number of fish species (Footnote 34,Footnote 35,Footnote 36) that are important for conservation efforts, and for cultural and socio-economic reasons.
Information regarding these key species can be found at the links below:
- Atlantic salmon and other salmonids, such as Arctic char and brook trout
- American eel
- banded killifish
- capelin
- Atlantic cod
Several of these species or populations have been listed as endangered, threatened, or of special concern by the Committee on the Status of Endangered Wildlife in Canada.
Species spotlight: Atlantic salmon
Atlantic salmon is often regarded as an indicator species due to its relatively large migration patterns, and its many life history stages occurring over various freshwater and marine habitats. Therefore, attention to the conservation of Atlantic salmon and its key habitats could prove beneficial to other freshwater species.
Atlantic salmon returns are monitored annually on 20 to 25 rivers in Newfoundland and Labrador. Although the monitored rivers may change slightly from year-to-year (i.e. through the addition of new sites), monitoring efforts focus on a relatively stable group of rivers. Monitored rivers for 2021 can be seen below in figure 3. Latitude and longitude are denoted on the y and x axis respectively. Rivers that are monitored for out-migrating Atlantic salmon smolts and returning adults are marked by a white dot. Rivers that are monitored for out-migrating adults only are marked by a black dot. Salmon fishing areas are numbered 1 to 14B. The abundance of most monitored populations are counted directly using counting fences or fishways. Trends in total returns to each river, as well as estimates of the number of spawners and eggs deposited by females (factoring in removals from the recreational fishery), are used to assess the general level of health for the species and its habitats each year. Water quality, temperature, and aquatic connectivity are important factors that have an effect on the health of Atlantic salmon and other freshwater fish species.
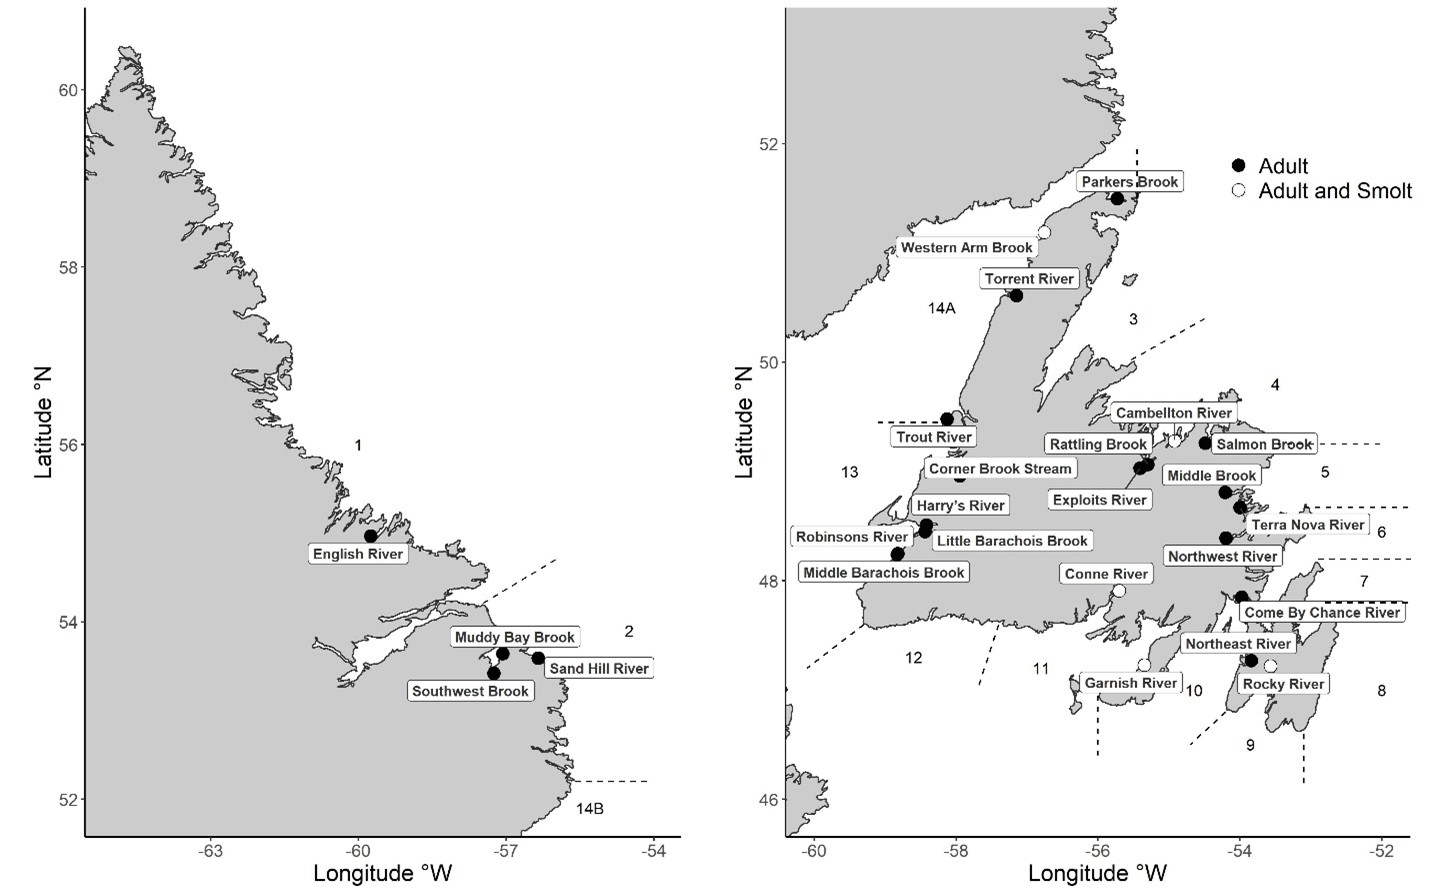
Figure 3 - Text version
| Region | River name | Type of Atlantic salmon monitored (either Adult or Adult and smolt) |
|---|---|---|
| Labrador | English River | Adult |
| Muddy Bay Brook | Adult | |
| Sand Hill River | Adult | |
| Southwest River | Adult | |
| Island of Newfoundland | Campbellton River | Adult |
| Come By Chance River | Adult | |
| Conne River | Adult and smolt | |
| Corner Brook Stream | Adult | |
| Exploits River | Adult | |
| Garnish River | Adult and smolt | |
| Harry's River | Adult | |
| Little Barachois Brook | Adult | |
| Middle Barachois Brook | Adult | |
| Middle Brook | Adult | |
| Northeast River | Adult | |
| Northwest River | Adult | |
| Parkers Brook | Adult | |
| Rattling Brook | Adult | |
| Robinsons River | Adult | |
| Rocky River | Adult and smolt | |
| Salmon Brook | Adult | |
| Terra Nova River | Adult | |
| Torrent River | Adult | |
| Trout River | Adult | |
| Western Arm Brook | Adult and smolt |
Note: Salmon fishing areas are labelled 1 to 14B.
For most monitored Atlantic salmon populations in Newfoundland and Labrador with sufficient time series data, returns have fluctuated with no significant trend over the previous three generations (17 to 20 years depending on the population). In northern Labrador, returns to English River have increased by more than triple over the previous three generations (2002 to 2022). In contrast, returns to Southwest Brook (southern Labrador), Rocky River, and Conne River (southern Newfoundland) show declining trends over the previous three generations. Atlantic salmon returns to Conne River have declined by approximately 91% since 2005Footnote 38.
Total returns of adult Atlantic salmon in 2021 were lower on five of 17 (29%) assessed rivers relative to the previous generation average (2015 to 2020 and 2014 to 2020 for Newfoundland and Labrador rivers, respectively), and total returns on three of these rivers (18%) declined by greater than 30%. Total returns in 2021 were higher on nine rivers (53%) relative to the previous generation average and three rivers showed no change (different of less than 10%) (figure 4). In comparison to the previous three generation average (figure 5), total returns declined on five of 13 rivers (38%), three of which (23%) declined by greater than or equal to 30%. Total returns to six monitored rivers (46%) were higher than the previous three generation average in 2021 and two rivers showed no changeFootnote 39.
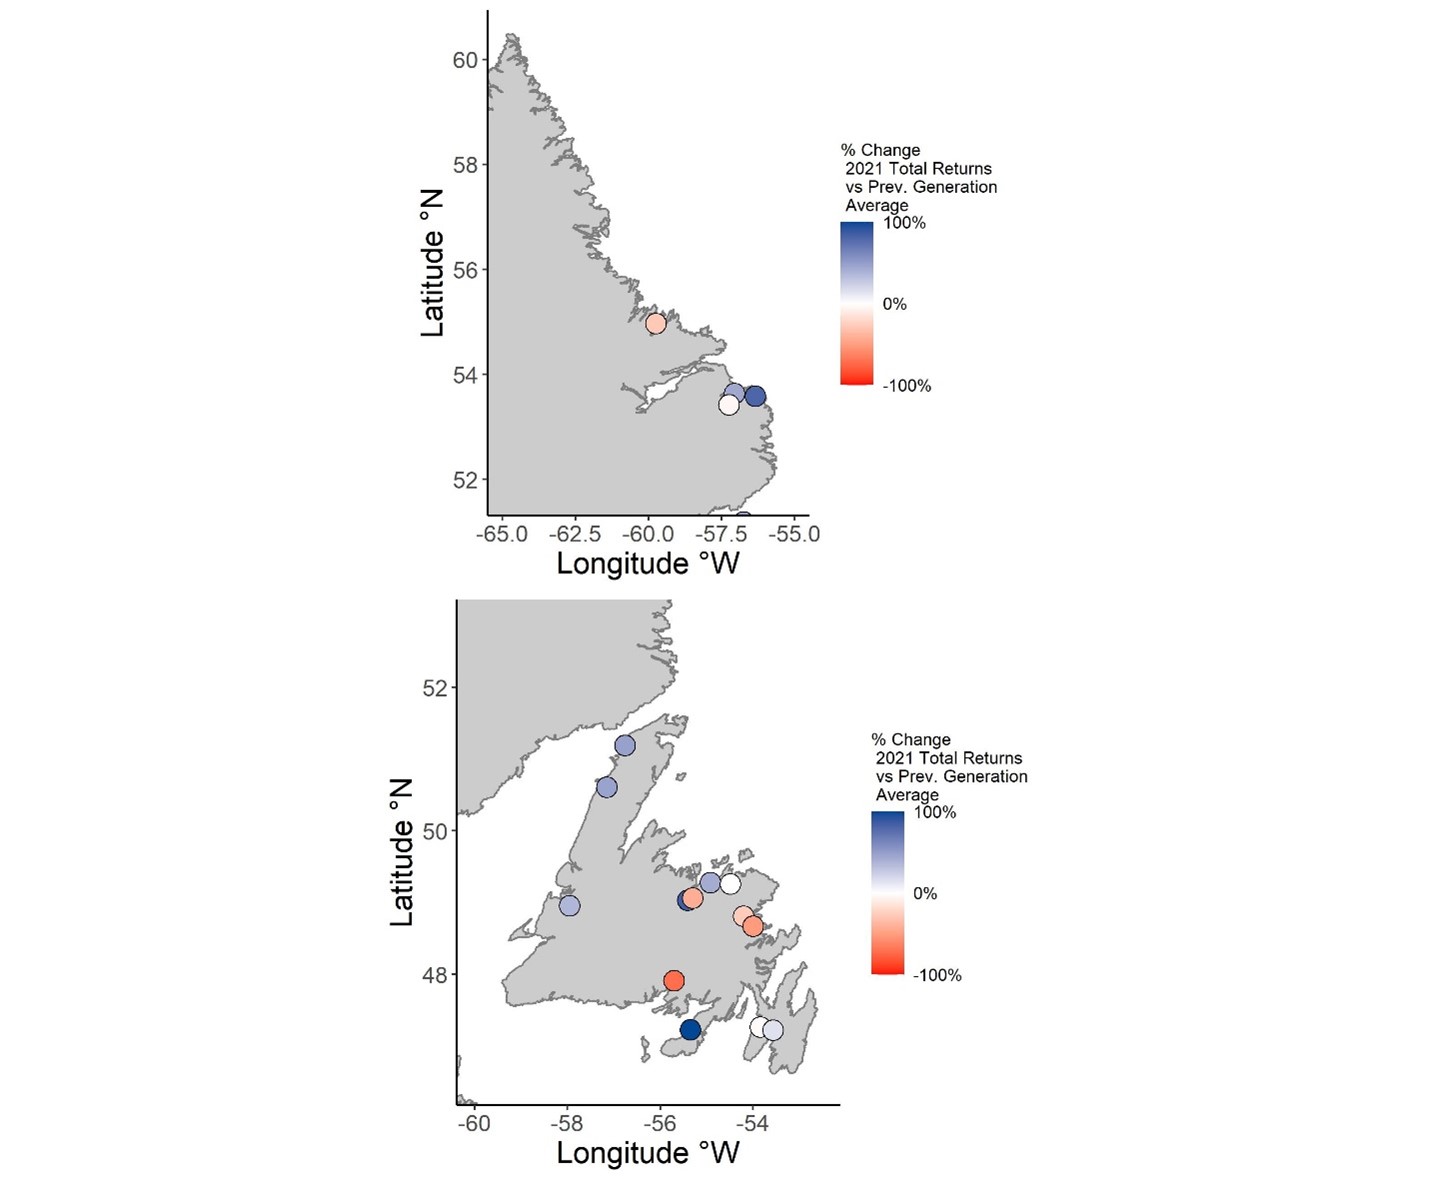
Figure 4 - Text version
| Region | River name | Percent change in total returns (2021) vs. previous generation average |
|---|---|---|
| Labrador | English River | -29% |
| Muddy Bay Brook | 49% | |
| Sand Hill River | 62% | |
| Southwest Brook | 0% | |
| Island of Newfoundland | Campbellton River | 49% |
| Conne River | -71% | |
| Corner Brook Stream | 28% | |
| Exploits River | 81% | |
| Garnish River | 138% | |
| Middle Brook | -26% | |
| Northeast River | -1% | |
| Rattling Brook | -41% | |
| Rocky River | 13% | |
| Salmon Brook | 4% | |
| Terra Nova River | -53% | |
| Torrent River | ≥48% | |
| Western Arm Brook | 44% |
Note: One generation corresponds to five or six years in Newfoundland and seven years in Labrador. Percent change estimates are scaled between +100% (blue) and -100% (red).
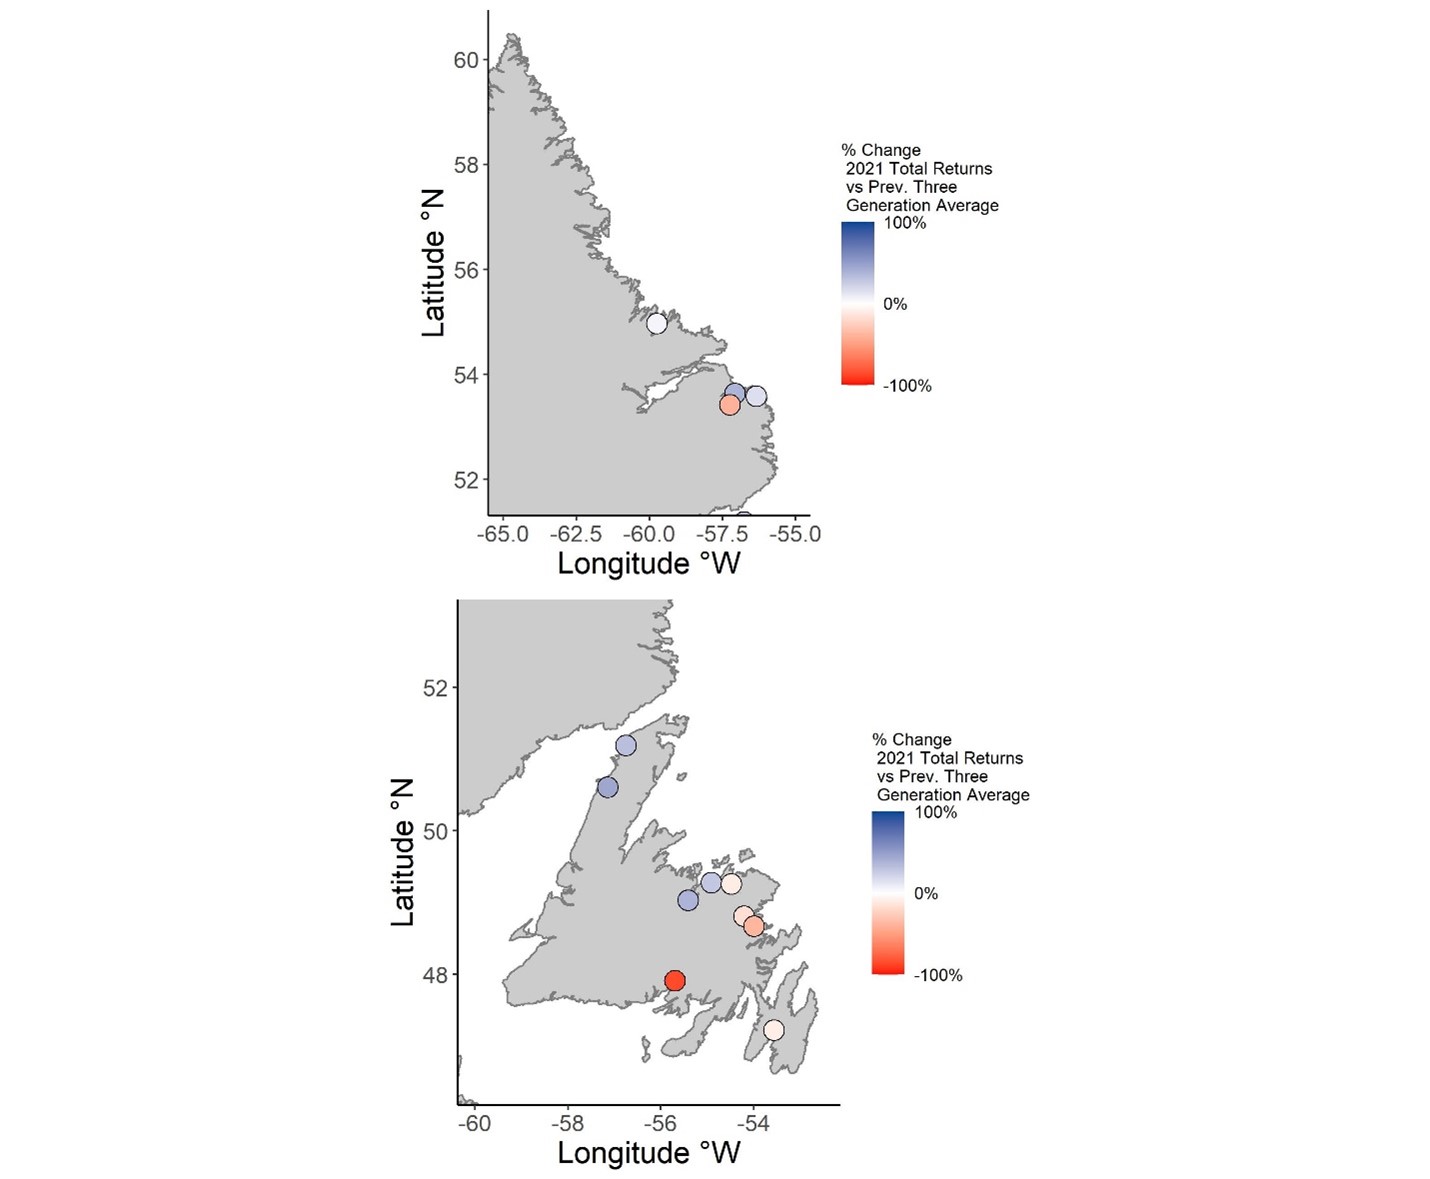
Figure 5 – Text version
| Region | River name | Percent change in total returns (2021) vs. previous 3 generation average |
|---|---|---|
| Labrador | English River | 8% |
| Muddy Bay Brook | 43% | |
| Sand Hill River | 12% | |
| Southwest Brook | -34% | |
| Island of Newfoundland | Campbellton River | 33% |
| Conne River | -85% | |
| Exploits River | 30% | |
| Middle Brook | -15% | |
| Rocky River | -17% | |
| Salmon Brook | -3% | |
| Terra Nova River | -40% | |
| Torrent River | ≥45% | |
| Western Arm Brook | 29% |
Note: The previous three generation time period is specific to each river: 16 to 18 years for most Newfoundland rivers and 19 to 20 years for most Labrador rivers. Percent change estimates are scaled between +100% (blue) and -100% (red).
Threats to fish and fish habitat
Lake and riverine habitat requirements of many freshwater fish species in Newfoundland and Labrador have been well documented (Footnote 42,Footnote 43), though available information for others can be limited. Based on the information available, key threats to habitat include:
- habitat degradation and modification (Footnote 44,Footnote 45,Footnote 16) such as barriers to the aquatic connectivity of upstream and downstream migration paths, and habitat access for fish passage due to anthropogenic sources (e.g. coastal and riverine developments, resource extraction)
- aquatic invasive species such as European green crab destroying eelgrass beds while they forage for foodFootnote 47
- impacts of climate change such as increased water temperatures, changes in precipitation patterns, and increased frequency of severe weather events causing erosion and sedimentation of aquatic habitat
In addition to DFO's role in protecting fish and fish habitat in Newfoundland and Labrador, the provincial Government of Newfoundland and Labrador is responsible for water resources management and is also involved in aquatic research and fish management.
Addressing gaps in freshwater data and information
Historically there has been a comprehensive body of research dedicated to understanding freshwater fish species and habitats in Newfoundland and Labrador. On the other hand, widely and publicly accessible data, information, and knowledge on the freshwater environment in Newfoundland and Labrador is limited. This is particularly evident when compared to the breadth of data available for the marine environment. DFO's NL Region staff have been engaging internally and externally to gather information on valued species, areas, and ecosystem functions in the region that will serve to fill freshwater data gaps. Such data also includes species presence/absence, and aquatic connectivity within the province.
The lack of accessible freshwater data and information has also resulted in the development of a Freshwater Working Group in NL in 2021, led by DFO's NL Region. Its mandate is to develop a forum which will provide information exchange between government, Indigenous groups, environmental non-governmental organizations (ENGOs), and the larger research community to help us better understand and improve access to data and knowledge that could support stewardship, science, and management of freshwater and estuarine systems.
- Date modified: