
Atlantic Herring
- Name:
- Atlantic herring
- Latin Name:
- Clupea harengus harengus
- Group Name:
- Pelagic
- Location:
- North Atlantic Ocean
- Fishing Gear:
- Purse seines, tuck-ring seines, fixed gear, midwater trawls, weirs and gillnets
- Season:
- Mainly spring and summer
Species at a Glance
Atlantic herring are one of the most abundant fish species on earth, living in the open ocean and gathering in large schools. The species migrate for feeding, spawning, and over-wintering purposes and are found on both sides of the Atlantic.
Herring are fished for both food and bait, and the catch may be exported smoked, fresh, frozen, marinated/pickled/cured, and canned as “sardines” or for their roe. Products from Canada’s herring fishery are destined for markets in Japan, the United States, and the Dominican Republic. One of the most valuable herring products is roe for the Japanese market.
- Landings:
- 126,102 tonnes in 2013, 113,990 tonnes in 2012, 134,301 tonnes in 2011 and 149,900 tonnes in 2010.
- Value:
- Landed value of $46.2 million in 2013, $44.3 million in 2012, $38.4 million in 2011 and $40.3 million in 2010.
- Abundance status and trends:
- Herring abundance is estimated using acoustic surveys where available. There are a number of herring stocks that DFO tracks. The spawning stock biomass estimates in the different stocks range from critical, cautious to healthy.
- Fisheries:
- Eight main fisheries: Scotia-Fundy (NAFO Divisions 4VWX) in four fishing areas; southern Gulf of St. Lawrence (NAFO Division 4T) spring and fall spawner components; and off the west coast (NAFO Division 4R) and east coast (NAFO Divisions 3KLPs) of Newfoundland spring and fall components.
- Conservation measures:
- Tailored to the unique needs of each fishery; measures include quotas, season and area closure during spawning period, enhanced monitoring, and more.
Species Background
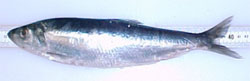
Herring are small silvery fish which feed primarily on phytoplankton, zooplankton, and small fish and larvae. The species swim with their mouths open to filter the plankton as they move through the water. Adults stay in the deeper waters during the day and come to the surface to feed at night.
Herring are known as a forage species because they are the prey of larger fish as well as marine mammals, such as harbour porpoises, dolphins, whales, and sharks. Herring may grow up to about 44 centimeters in length and weigh up to 750 grams.
The time and place of spawning depends on the stock. Some stocks spawn in the spring, (spring spawners) while others spawn in late summer or fall, and are called fall spawners.
Fisheries
Canada’s Atlantic herring fishery is commercially important in the areas where the main fisheries are located: off southwest Nova Scotia and the Bay of Fundy (Figure 1); the southern Gulf of St Lawrence (Figure 2); and the east and west coasts of Newfoundland (Figure 3). Efforts have also been made for some years to develop a fishery on Quebec’s Lower North Shore (NAFO Division 4S).
Herring landings on the west coast of Newfoundland have been rising since 1999 (Figure 4). In 2011, landings were 20,501 t compared to 19,205 t in 2010. Combined landings of all herring stocks fished in the Atlantic Ocean are shown in Figure 5.
Herring Fishing Areas:
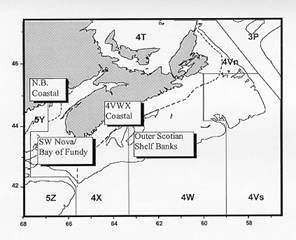
Figure 1. Herring fishing areas off Nova Scotia and south-west New Brunswick (NAFO Divisions 4VWX)
Figure 1 is captioned “Herring fishing areas off Nova Scotia and south-west New Brunswick (NAFO Division 4VWX)”. It is a map with latitudinal coordinates marked on the y-axis from 41 and 47 degrees and longitudinal coordinates marked on the x-axis from 68 to 57 degrees. The map shows the land masses of New Brunswick, Prince Edward Island and Nova Scotia and uses lines to outline the following fishing area boundaries: 5Y, 5Z, 4X, 4W, 4Vs, 4Vn, 3P, and 4T (counter-clockwise from 5Y). In addition, three-dimensional text boxes feature the following fishing locations: New Brunswick Coastal, South-West Nova/Bay of Fundy, 4VWX Coastal, and Outer Scotian Shelf Banks.
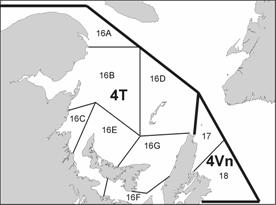
Figure 2. Herring fishing areas in the southern Gulf of St. Lawrence (NAFO Division 4T)
Figure 2 is captioned “Herring areas in the southern Gulf of St. Lawrence (NAFO Division 4T)”. It is a map showing the following herring fishing areas along the southern Gulf of the St. Lawrence River: (top to bottom, left to right) 16A, 16B, 16C,16D, 16E, 16F,16G, 17, and 18. In addition, the boundaries of two main fishing areas (4T and 4Vn) are outlined on the map.
Figure 3. Herring fishing areas off Newfoundland’s east (NAFO 3KLPs) and west (NAFO 4R) coasts
Figure 3 is captioned “Herring fishing areas off Newfoundland’s east and west coasts”. It is a map showing the island of Newfoundland and part of Labrador, as well as the north-eastern part of Quebec. The herring fishing areas are marked using lines along the Labrador coast line (at the top – area 2) and along the entire island of Newfoundland starting at the northern tip of the island and around clockwise from area 1/3 to 14.
Conservation Measures
The herring fishery is managed through Integrated Fisheries Management Plans, which identify quota allocations, fishing seasons and areas, as well as the tools used to control and monitor fishing activities, licensing, and regulation.
Specific management measures are also in place in some herring fishing areas to provide protection to the different stock components. For example, all licenced herring fish harvesters operating mobile gear vessels and fixed gear are required to provide detailed logbook records of catch and fishing activity. In addition, the commercial landings are verified at the port as part of the Dockside Monitoring Program.
Herring Landings – Historical View:
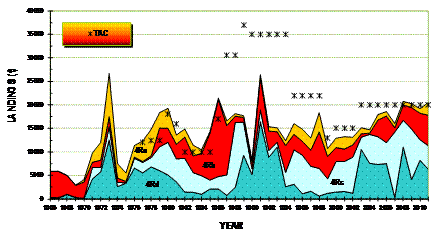
Figure 4. Herring landings by unit area and Total Allowable Catch in NAFO Division 4R (west coast Newfoundland) between 1966 and 2011
Figure 4 is captioned “Herring landings by unit area and Total Allowable Catch in NAFO Division 4R between 1966 and 2011”. It is a stacked area chart showing the trend of historical landings of herring by Newfoundland harvesters in fishing area 4R by unit areas: 4Ra, 4Rb, 4Rc, and 4Rd between 1966 and 2011. The y-axis shows landings in 5,000-tonne increments from 0 to 40,000 t and the x-axis marks each year from 1966 to 2011 (noting only even years in text, e.g., 1966, 1968, 1970, etc.). The table shows the peak herring catch years of 1973, 1980, 1986 and 1991, although landings remain relatively stable between 1992 and 2011 at between 15,000 and 20,000 t (total of all four sub-units of fishing area 4R). The total allowable catch (TAC) is marked every year beginning in 1977 using an asterisks along the chart.
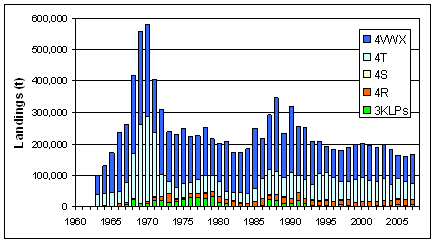
Figure 5. Total herring landings from the main fisheries from 1960 to 2007 (FRCC 2009)
Figure 5 is captioned “Total herring landings from the main fisheries from 1960 and 2007”. It is a two-dimensional column chart that uses the same bar to show both total annual landings of herring each year from 1963 to 2007, as well as the total landings in each of the following fishing areas: 3KLPs, 4R, 4S, 4T, and 4VWX. The y-axis shows landing measurements in 100,000-tonne increments from 0 to 600,000, and the x-axis marks each year (noting in text every five years, e.g., 1960, 1965, etc.). The table shows that the highest herring landings were made in 1969 and 1970 (more than 550,000 t) with the average catch between 1973 and 2000 around 200,000 t. Landings between 2004 and 2007 have hovered around 160,000 t.
Population Estimates
DFO scientists, external experts, and fish harvesters regularly review herring stock assessments and the results are published on the Canadian Science Advisory Secretariat website. DFO assesses 8 main fisheries of herring in eastern Canada.
The population abundance of the four southwest Nova Scotia herring stocks in 4VWX has declined since 2001. The stock has not rebuilt despite reduced catch levels in recent years.
The Gulf of St. Lawrence herring stock (4T) is composed of two components, fall spawners and spring spawners. The abundance of the population of fall spawners remains at a moderate level. The abundance of the population of spring spawners has been declining since 1997 and remains at a low level.
On the west coast of Newfoundland (4R), herring biomass estimates for 2010 and 2011 are higher than those from 2002.
On the east coast of Newfoundland (3KLPs) the status of the fall spawners has improved.
There are signs that the stock is increasing for herring in the Quebec Lower North Shore (4S).
In addition to reviewing herring landing data, various methods of research and assessment are used to estimate abundance, spawning biomass, and fishing mortality. These methods include:
- acoustic surveys;
- analytical assessments;
- catch rates from fishery data;
- size, weight, condition, and maturity of fish caught, as well as age; and
- bycatches in other fisheries.
Additional Information
- DFO: Canadian Commercial Fisheries Data (2011): Values and Quantities
- DFO: Canadian Science Advisory Secretariat: Research on Atlantic herring for the west coast of Newfoundland (NAFO 4R) in 2011
- DFO: Canadian Science Advisory Secretariat: Research on Atlantic herring on Quebec’s North Shore (NAFO 4S) in 2010
- DFO: Canadian Science Advisory Secretariat: Atlantic herring market (2008) (PDF 256.4 KB)
- DFO: Canadian Science Advisory Secretariat: Herring fishing areas 13 and 14 (NAFO 4R) and 2J3KLPs herring
- DFO: Sustainable Fisheries Framework policies
- Fisheries Resource Conservation Council: Fishing into the Future – the Herring Fishery of Eastern Canada (2009)
- DFO Canadian Science Advisory Secretariat: 2011 Assessment of 4VWX Herring
- Date modified: