
Haddock
- Name:
- Haddock
- Latin Name:
- Melanogrammus aeglefinus
- Group Name:
- Groundfish
- Location:
- North Atlantic Ocean
- Fishing Gear:
- Otter trawls, longlines, handlines and gillnets
- Season:
- June to February on Georges Bank; April to March on the Scotian Shelf
Species at a Glance
A member of the cod family, haddock are a popular Canadian bottom-dwelling groundfish species on both sides of the Atlantic, ranging in North American waters from southwest Greenland to Cape Hatteras, North Carolina.
Haddock are harvested as a directed fishery on eastern Georges Bank (5Zjm), and as part of a multi-species fishery in the southern Scotian Shelf and Bay of Fundy (4X). The Canadian haddock fisheries in these areas have been eco-certified by the Marine Stewardship Council.
The United States is the predominant export market for Canadian haddock.
- Landings:
- Canadian landings were 8,286 tonnes in 2013, 9,330 tonnes in 2012, 15,201 tonnes in 2011. Landings were 23,400 tonnes in 2009 and 22,400 tonnes in 2010.
- Value:
- Landed value was $12 million in 2013, $20.1 million in 2012, $26.1 million in 2011. In 2009, landed value was $36.9 and in 2010, $30 million.
- Abundance status and trends:
- The spawning stock biomass has increased over the past decade in the southern Scotian Shelf and Bay of Fundy area. In the eastern Georges Bank area, the adult population biomass increased to more than 173,000 t in 2009 from a historical low of 10,400 t in 1993.
- Fisheries:
- While Fisheries and Oceans Canada manages five haddock stock fisheries, directed fisheries are currently permitted in only two of these, i.e. NAFO Division 4X5Y in the southern Scotian Shelf and Bay of Fundy; and NAFO Division 5Zjm located in the eastern Georges Bank area. The 5Zjm stock is a transboundary stock and is managed jointly with the United States.
- Conservation measures:
- Tailored to the unique needs of each haddock fishery, there are a number of conservation measures including catch quotas, spawning area closures, mesh-size regulations.
Species Background
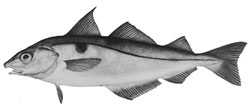
Haddock are elongated fish with a purple-grey back and head, and a black lateral line. Though similar in appearance to cod, haddock are smaller on average, from 38 to 69 centimeters in length and 0.9 to 1.8 kilograms in weight. The species can easily be recognized by the black mark above the pectoral fin, which is sometimes called the Devil’s thumbprint. A demersal fish, haddock usually live at depths of 50 to 250 meters and mainly feed on small invertebrates.
Haddock are found on both sides of the North Atlantic. Major stocks within Canadian waters are found on the southern Scotian Shelf and the Bay of Fundy, as well as eastern Georges Bank. Almost all eastern Georges Bank haddock are mature by the age of three, and the number of eggs produced increases dramatically with age. Haddock’s spawning peak occurs in April and May on the Scotian Shelf and about one to two months earlier on eastern Georges Bank.
Fisheries
There are approximately 1,000 licenced fish harvesters who take part in the haddock fisheries, with most of the catch occurring in the eastern Georges Bank area (Figures 1 and 2). Haddock are harvested with otter trawls, longlines, handlines, and gillnets.
Between 2006 and 2010 the total allowable catch in 4X5Y for the Scotian Shelf and Bay of Fundy haddock fishing area, ranged from 6000 to 7000 tonnes. In 5Zjm the total allowable catch for 2009 was 30,000 tonnes and in 2010 it was 29,600 tonnes.
Haddock Fishing Areas:
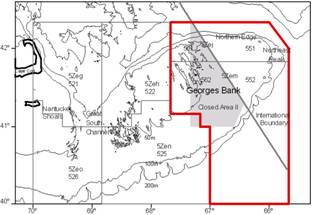
Figure 1. Map of haddock fishing areas on Georges Bank, showing the NAFO Division eastern 5Zjm, the international boundary of Canada and the US, as well as a closed area for fishing on spawning fish.
Figure 1 is captioned “NAFO Division 5Zjm eastern Georges Bank”. It is a map showing geographical coordinates south east of Newfoundland from 40 to past 42 degrees latitude along the y axis and from 70 to past 66 degrees longitude along the x axis. The map features ocean depth lines (of 50, 100 and 200 meters) around the area, and names specific geographic points of reference: Nantucket Shoals, Great South Channel, Georges Bank, Northern Edge, and Northeast Peak. The map also shows “Closed Area II” around Georges Bank in grey. It also outlines the Northwest Atlantic Fisheries Organization (NAFO) Division 5Zjm fishing area.
Figure 2. NAFO Division 4X5Y southern Scotian Shelf and Bay of Fundy
Figure 2 is captioned “NAFO Division 4X5Y southern Scotian Shelf and Bay of Fundy”. It is a map showing the following fishing areas south of New Brunswick and north/south west of Nova Scotia: (starting south of New Brunswick and around counter clockwise) 4Xs, 4Xr, 5Yb, 4Xq, 4Xp, 4Xo, 4Xn, and 4Xm.
Conservation Measures
Canada and the United States conduct a joint annual assessment of the eastern Georges Bank haddock stock. The two countries also collaboratively manage this stock through the Canada-United States Transboundary Management Guidance Committee that was established in 2000.
Groundfish fisheries off the coast of Atlantic Canada have been regulated since 1977. In 1995, an Integrated Fisheries Management Planning process was introduced and, in 2000, this process was strengthened with the addition of risk analysis and the precautionary approach to haddock fisheries management. Fisheries and Oceans Canada continues to work closely with regional management boards and the haddock fishing industry to develop and update Integrated Fisheries Management Plans for haddock.
Haddock fisheries have been managed using quota regulations since the 1970’s. Some conservation measures include:
- specific season and area closures during spawning;
- fishing practices to avoid high bycatch (in 5Xjm where this is not a multi-species fishery) such as the use of a separator panel in trawl nets to minimize cod bycatch; and,
- monitoring by at-sea observers
Haddock Landings – Historical View:
Haddock landings since 1969 from NAFO Division 5Zjm are shown in Figure 3. Both landings and TAC for haddock from NAFO division 4X5Y are shown in Figure 4.
Figure 3. Long-term trends in NAFO Division 5Zjm haddock landings
Figure 3 is captioned “Long-term trends in NAFO Division 5Zjm haddock landings”. It is a two-dimensional column chart featuring annual landings (as well as discards) by both Canada and the United States in a bar for the years between 1969 and 2011. Along the y-axis are the landing weights (in tonnes) starting at 0 and increasing in 5,000-tonne increments to 30,000 t. Along the x-axis are the five-year points starting at 1969 and going beyond 2009. The Canadian haddock quota is marked by a line starting in 1992 and along each year until 2011. The total quota is represented by a circle starting in 2004 and every year until 2011. The figure demonstrates that Canadian landings have been much higher than American landings since the mid-1980’s. It also shows that discards (particularly American discards which peaked sharply in 1980) have stopped in recent years. Canadian landings since 2005 have ranged between 13,000 and 18,000 t.
Figure 4. Long-term trends in NAFO Division 4X5Y haddock landings
Figure 4 is captioned “Long-term trends in NAFO Division 4X5Y haddock landings”. It is a two-dimensional column chart featuring annual landings in a bar for the years between 1970 and 2009. Along the y-axis are the landing weights (in tonnes) starting at 0 and increasing in 5,000-tonne increments to 35,000 t. Along the x-axis are the five-year points starting at 1970 and going beyond 2005. The total allowable catch (TAC) for each year is marked along the chart with a diamond and each diamond is connected by a line. The table demonstrates that landings of haddock between 1975 and 1985 were quite high (sometimes ranging more between 25,000 and 35,000 t. This trend fell sharply in 1989 (to a little more than 5,000 t) and has since hovered between 5,000 and 8,000 t.
Population Estimates
Fisheries and Oceans Canada has conducted annual summer research surveys in NAFO Divisions 4VWX, 5Y, and 5Z fishing areas using a standardized protocol since 1970. Annual winter research surveys have been conducted in NAFO Division 5Z since 1986. Results of these surveys provide information on trends in abundance for most groundfish species, including haddock including haddock on the Scotia Shelf and Georges Bank areas.
Adult biomass for the 5Zjm haddock stock, estimated from a population model, has fluctuated over the past decade: decreasing to 62,200 t in 2005; increasing to 172,700 t in 2009; and decreasing again to 70,700 t at the beginning of 2012 (Figure 5).
Adult biomass for the 4X5Y haddock stock, also estimated from a population model, has remained relatively stable over the past two decades and has increased in the past few years (Figure 6). Recent recruitment is variable, with poor incoming year-classes in 2007 and 2008 and large year-classes in 2009 and 2010. 4X5Y haddock spawning stock biomass is considered to be likely within the “cautious” zone.
The 4X5Y haddock spawning stock biomass is currently estimated as being in the Cautious zone based on Canada’s Fishery Decision-Making Framework Incorporating the Precautionary Approach.
In addition to research vessel survey results and commercial haddock landings data, the Department uses other methods to better understand the status of haddock. These include monitoring and analyzing:
- catch rates;
- size and weight of haddock caught; and
- abundance of young fish
Stock Biomass – Historical View:
Figure 5. Spawning stock biomass (ages 3+) and age 1 recruitment for NAFO Division 5Zjm haddock
Figure 5 is captioned “Spawning stock biomass (ages 3+) and age 1 recruitment for NAFO Division 5Zjm haddock”. It is a two-dimensional column chart representing the historical view of the haddock biomass from 1930 to 2010 (x-axis) by showing the age 1 recruitment estimates in bars (aligned to the y-axis points on the left of the chart starting at 0 and increasing in 20-million increments to 100,000,000) and the spawning stock biomass (ages 3+) using a line along the chart (aligned to the y-axis points on the right of the chart in the 20,000-tonne increments from 0 to 200,000 t. There is no data shown between the years 1955 and 1968. Between 1930 and 1955, age 1 recruits appear to have fluctuated every few years from about 30 million to more than 60 million, while the biomass (ages 3+) was as high as 50,000 and 30,000 t. The data in the figure between 1970 and 2010 shows more radical fluctuations with more years with more than 5 million age 1 recruits at the end of the 1960’s and most of the 1980’s, while the years 2000, 2003, 2010 and 2011 show more than 80- and even 100,000 million age 1 recruits. The biomass figures between 1970 and 2000 were more stable (between 20,000 and 40,000 t), with a very high jump to more than 80,000 t showing between 2007 and 2007.
Figure 6. Spawning stock biomass (ages 4+) and age 1 recruitment for NAFO Division 4X5Y haddock
Figure 6 is captioned “Spawning stock biomass (ages 4+) and age 1 recruitment for NAFO Division 4X5Y haddock”. It is a two-dimensional column chart representing the historical view of the haddock biomass from 1970 to 2006 (x-axis) by showing the age 1 recruitment estimates in bars (aligned to the y-axis points on the left of the chart starting at 0 and increasing in 5,000-tonne increments to 75,000 t) and the spawning stock biomass (ages 4+) using a line along the chart (aligned to the y-axis points on the right of the chart in the same 5,000-tonne increments). The table shows that between 1971 and 1983, age 1 recruits were relatively consistent: of between 45,000 and 5,000 t for about two years, then lower of between 25,000 and 35,000 t for one year. This trend changed in 1983 (until 1997) with about three years showing recruits between 5,000 and 10,000 t followed by two years of between 20,000 and 25,000 t. 1998 experienced a peak of more than 70,000 age 1 recruits, which was followed by a few years of age 1 recruits between 35,000 and 45,000 t and a few years of age 1 recruits of between 5,000 and 10,000 t. The spawning stock biomass also has ups and downs along the chart, with peaks of around 65,000 t in the late 1970’s and early 1980’s, and relatively consistent biomass of between 20,000 and 30,000 t between 1985 and 2002. In 2003, the spawning stock biomass rose to 50,000 t.
Additional Information
- DFO aquatic species profile: Haddock
- DFO Canadian Science Advisory Secretariat: Assessment of the Status of 4X5Y Haddock in 2011
- DFO: Atlas of the Scotian Shelf
- DFO: Canadian Commercial Fisheries Data (2011): Values and Quantities
- DFO: Sustainable Fisheries Framework policies
- Transboundary Management Guidance Committee management process
- Transboundary Resources Assessment Committee: Eastern Georges Bank Haddock (PDF 68.6 KB)
- Date modified: