
Evaluation of the Certification and Market Access Program for Seals (CMAPS)
Final Report
November 18, 2019
Table of Contents
- 1.0 Program Profile
- 2.0 Evaluation Context
- 3.0 Findings: CMAPS
- 4.0 Findings: Pillar 1
- 5.0 Findings: Pillar 2
- 6.0 Findings: Pillar 3
- 7.0 Findings: Overall
- 8.0 Lessons Learned and Conclusions
- Appendix 1: Methodology
- Appendix 2: Sealing Areas in Canada
1.0 Program Profile
1.1 Program Profile
Certification and Market Access Program for Seals responded to European ban on seal products
In 2010, the European Union (EU) implemented a ban on seal products that eliminated 36% of the Canadian export market value. While Canada appealed to the World Trade Organization (WTO), the ban remained in place. In its ruling however, the WTO agreed that the ban discriminated against Indigenous populations outside the EU and required the EU to extend its existing exemption to include seal products derived from non-EU Indigenous harvests.
To leverage this new exemption, the Government of Canada announced the Certification and Market Access Program for Seals (CMAPS). The CMAPS was designed to assist Indigenous communities in their efforts to access the EU market under the Indigenous exemption, and to support the broader seal industry to renew market access domestically and internationally through grants and contributions.
CMAPS is organized by pillars that reflect three program objectives
- Enable the European Union Indigenous exemption
- Build Indigenous capacity to leverage the Indigenous exemption
- Support marketing activities of the broader sealing industry
Program activities:
- soliciting and assessing proposals;
- negotiating contribution agreements,
- engaging stakeholders; and
- facilitating information exchange between stakeholders and other government departments, e.g., Canada Northern Economic Development Agency (CanNor), Atlantic Canada Opportunities Agency (ACOA), Global Affairs Canada (GAC), Agriculture and Agri-foods Canada (AAFC) and Crown and Indigenous Relations and Northern Affairs Canada (CIRNAC).
Pillars target specific points on the seal products value chain
Description
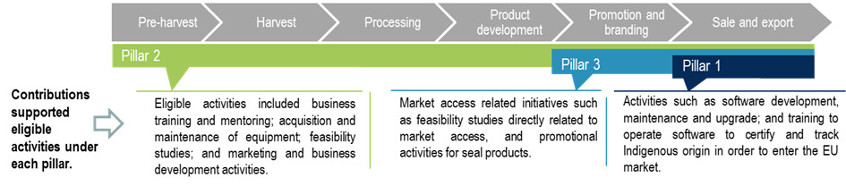
Pillars target specific points on the seal products value chain.
The graphic depicts a row of 6 interconnected arrow boxes. Each arrow represents a point along the value chain for seal products. From left to right, they are:
- Pre-harvest
- Harvest
- Processing
- Product development
- Promotion and branding
- Sale and export
Each of the three pillars of CMAPS target different sections of the value chain.
Pillar 1 activities target sale and exports at the end of the chain.
Pillar 2 activities target all points along the entire value chain from pre-harvest through to sale and export.
Pillar 3 activities target the two last steps of the value chain: promotion and branding, and sale and export.
Contributions supported eligible activities under each pillar as follows:
Pillar 1 - Activities such as software development, maintenance and upgrade; and training to operate software to certify and track Indigenous origin in order to enter the EU
Pillar 2 - Eligible activities included business training and mentoring; acquisition and maintenance of equipment; feasibility studies; and marketing and business development
Pillar 3 - Market access related initiatives such as feasibility studies directly related to market access, and promotional activities for seal products.
Budget 2015 allocated $5.7 million over five years to CMAPS
Fisheries and Oceans Canada (DFO) received approximately $5 million to deliver the CMAPS program. The remaining $700,000 was split evenly between ACOA and CanNor to supplement their grants and contributions for regional initiatives related to seal products. CMAPS is scheduled to sunset in March 2020.
| Vote | 2015-16 | 2016-17 | 2017-18 | 2018-19 | 2019-20 | Total |
|---|---|---|---|---|---|---|
| Vote 1: Personnel | 0.21 | 0.21 | 0.21 | 0.21 | 0.21 | 1.07 |
| Vote 1: Operating | 0.33 | 0.33 | 0.33 | 0.23 | 0.23 | 1.46 |
| Vote 10: Contributions | 0.19 | 0.79 | 0.59 | 0.45 | 0.45 | 2.47 |
| Total | 0.74 | 1.34 | 1.14 | 0.89 | 0.89 | 4.99 |
The evaluation period (2015-16 to 2018-19) covered planned spending of $3.7 million. Initially the program was late to start resulting in contribution funds from 2015-16 being re-profiled to later years.
With slight fluctuations annually, two full-time equivalents supported the program, supplemented by existing resources as appropriate.
Resources are discussed throughout the report. Where actual spending is being considered, the reference timeframe is the four-year evaluation period, 2015-16 to 2018-19.
Contributions are made using two transfer payment authorities
Financial assistance to external stakeholders was provided through contributions. Contributions to support Pillar 1 and Pillar 2 objectives were provided through the Aboriginal Aquatic Resources and Oceans Management (AAROM) authority. The Director General of the Indigenous Affairs and Reconciliation Division is consulted to approve funding.
Contributions under Pillar 3 were provided using the Class Grants and Contributions program authority. A steering committee composed of CanNor, ACOA, AAFC, and GAC was consulted on proposals under Pillar 3. The Deputy Minister of DFO approved these projects.
During the evaluation period (2015-16 to 2018-19), $1.87 M in contributions was disbursed through 28 agreements with 13 unique recipients.
| Pillar | Number of Agreements | Number of Recipients |
|---|---|---|
| 1 | 2 | 2 |
| 2 | 7 | 4 |
| 3 | 19 | 9 |
Figure 1: Total Contributions by Pillar, Actual $2015-16 to 2018-19
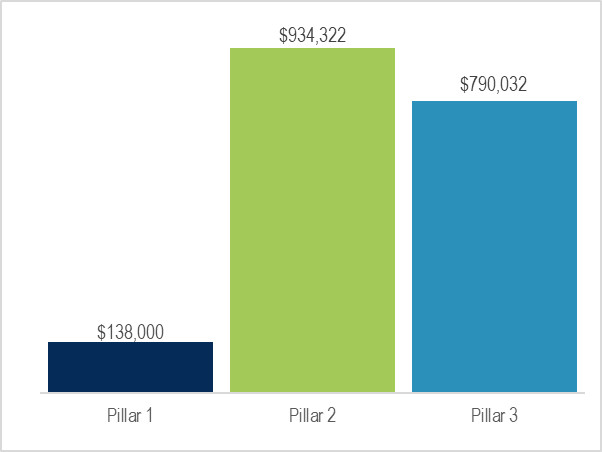
Description
Figure 1 is a bar graph that illustrates the contributions relative to each pillar. It has three bars that represent the contributions in actual dollars in each pillar. The dollar amounts are identified at the top of each bar. Pillar 1 contributions totalled $138,000. This is the lowest amount by a significant margin. Pillar 2 contributions totalled $934,322. This is the highest amount. Pillar 3 contributions totalled $790,032. This is slightly lower than contributions for Pillar 2.
1.2 Stakeholders
Whether directly or not, the entire sealing industry is implicated in the CMAPS. The seal products industry is composed of a few small companies producing oil, meat, fashion, and pelts; and the fur auction houses who supply pelts to the domestic and international markets. The commercial seal industry is mostly located in Eastern Canada, with auction houses and tanning facilities located in Ontario, Quebec and Manitoba.
Indigenous and non-Indigenous crafters and designers, who are mostly women, operate at a cottage industry level. They sell their products through local stores and online through social media outlets. Some designers produce fashion products that are sold in retail outlets outside their local area.
“The market makes no distinction between an Inuit and commercial seal hunt.” -Selheim, 2016
Stakeholder groups are identified as follows:
Commercial Industry
A small number of companies producing oil, seal, meat, fashion, and pelts; and the fur auction houses who have traditionally supplied pelts to the domestic and international markets.
Indigenous Organizations
Organizations representing communities and cultures that traditionally rely on the seal, and Indigenous entities with the potential to become Recognized Bodies and support capacity building.
Crafters
Indigenous and non-Indigenous individuals who make products at home and sell them through small retail outlets and online.
Harvesters
Indigenous hunters and landsmen hunters who hunt seal for subsistence, cultural, or commercial practices.
Communities
Coastal and northern communities in Atlantic Canada, the Arctic, and Quebec where the seal harvest and seal products industry is an important economic and cultural activity.
1.3 Program Operating Context
Seals are an important resources in coastal and northern communities
At its peak in 2006, the global export value of seals reached $17.8M, with the largest markets in the EU (Denmark, Finland and Germany). While low relative to other sectors of the Canadian economy, these revenues were, and continue to be, primarily concentrated in low income and remote coastal communities where sources of revenue are limited.
In eastern Canada, the seal harvest provided income at the transitional time between winter work ending and spring work beginning; it also provided skins for weatherproof clothing and meat for consumption. In the Arctic, seal hunting is carried out year-round. The skills gained from hunting, and the observations made from being on the ice, transfer to other activities that assist residents in those communities.
Anti-sealing hit communities hard, especially in the Arctic
All communities involved in the seal harvest felt the economic blow of anti-sealing activism. It was particularly acute among Inuit communities where the impact extended to the cultural core of the community. For them, there were few alternatives for food and income. The loss of income from sealing accelerated the loss of skills and ability to access the marine resources on which northern and coastal communities rely. Numerous sources note the link between food insecurity in Inuit communities and the decline in seal hunting. Without the income from sealing, the ability to hunt is severely diminished because costs to outfit a hunter are higher in the north.
Two exceptions to the European Union ban directly impact Canadian seal products
1. The Indigenous exemption
The Indigenous exemption is a focus of CMAPS.
The Indigenous exemption permits seal products derived from an Indigenous hunt to be placed for sale in the European Union market provided that all of the following conditions are fulfilled:
- the hunt has traditionally been conducted by the community;
- the hunt is conducted for and contributes to the subsistence of the community, and is not conducted primarily for commercial reasons;
- the hunt is conducted in a manner which has due regard to animal welfare, taking into consideration the way of life of the community and the subsistence purpose of the hunt.
At the time of its being placed on the market, a seal product shall be accompanied by a document attesting compliance with the conditions. An attesting document shall, upon request, be issued by a body recognized for that purpose by the Commission.
2. Exemption for personal use
Personal Use exemption permits sales to EU customers in Canada.
The EU exemption for Personal Use allows seal products purchased for personal use to enter the EU, either with the person, or by shipping. Proof of purchase in a non-EU country is required in the case of products shipped. EU residents can buy seal products in Canada, and carry them into the EU.
2.0 Evaluation Context
This report presents the results of the Evaluation of CMAPS. The evaluation was requested by program management in winter 2019 during consultations for the 2019-2020 Departmental Evaluation Plan. The evaluation was undertaken by DFO’s Evaluation Division between March and November 2019.
2.1 Evaluation Purpose and Scope
The evaluation was conducted in accordance with the Treasury Board’s Policy on Results (2016), which requires departments to measure and evaluate performance and use the resulting information to manage and improve programs, policies and services. Data was collected using multiple lines of evidence and findings were triangulated to draw conclusions. The methodology can be found in Appendix 1.
The scope and objectives for the evaluation were identified through consultations with program management and a review of key documents. The evaluation examined activities undertaken by the program during the period 2015-16 to 2018-19. The evaluation was calibrated to provide senior management with information necessary to support decision-making about the program within the required timeframes.
2.2 Evaluation Objectives
- Examine Stakeholder Needs
- Assess Program Effectiveness
- Identify Factors Impacting Performance
- Document Lessons Learned
2.3 Evaluation Questions
- To what extent does the program meet ongoing needs?
- To what extent has the program achieved its expected outcomes?
- Were there any unintended outcomes?
- To what extent does CMAPS design and delivery support the achievement of results?
- What factors impact program performance (effectiveness over time)?
- What lessons can be learned for application to future programming?
As per the Treasury Board Directive on Results (2016), the evaluation included a Gender-Based Analysis Plus (GBA+). GBA+ is an analytical tool to assess the potential impacts of policies, programs, services, and other initiatives on diverse groups of women and men, taking into account gender and other identity factors.
3.0 Findings: CMAPS
3.1 CMAPS is the only program to focus solely on market access for seal products
CMAPS objectives require long-term attention
Building capacity and improving market access require a long-term commitment. External interviewees expressed the need in the following ways:
“[Regaining market access] is a monumental task that can not be done on a shoestring budget.”
“You can’t undo 20 years of market damage in 5 years.”
Need to raise awareness about the seal harvest, seal products, and the EU exemptions is fundamental to market access
There is an ongoing need for awareness raising and education about seal products, the EU exemptions, and the importance of the harvest to communities. For example:
- People perceive seals as an endangered species. However, seals are not listed as a species of concern.
- Buyers in the EU stopped purchasing seal products because they did not understand or were unaware of the Indigenous exemption.
CMAPS reflects need for collaboration
Factors impacting market access fall outside any single department or program. To address the fundamental challenges impacting the seal products industry, collaboration across government jurisdictions and departmental mandates is needed.
- CMAPS incorporated collaboration opportunities into its program design through its steering committee to review project proposals so that proposals were complementary and did not overlap.
- The collaborative approach was reflected in the Canadian Council of Fisheries and Aquaculture Ministers collaborative approach to seals action plan developed in 2017.
Visible Government of Canada support is needed to secure market access
A critical component of securing market access is defence by the Government of Canada. Foundational documents describe CMAPS as a means of demonstrating that support. In the 2013 Speech from the Throne, the Government of Canada committed to “continue to defend the seal hunt, an important source of food and income for coastal and Inuit communities”.
Stakeholders believed that Canada’s visible and ongoing support was needed if their marketing efforts were to yield results. The declaration of a National Seal Products Day was a prime example of visible support from the Government of Canada.
All lines of evidence indicated that engagement at the local level is needed - in all parts of the country.
4.0 Findings: Pillar 1
4.1 Pillar 1: Enable the Indigenous Exemption
Planned approach
Administrative mechanisms to certify the Indigenous origin of seal products were required to enable the Indigenous exemption. Under Pillar 1, the first step was to identify entities with potential to meet the EU criteria for a Recognized Body*, and leverage the expertise within DFO regarding the ban to assist in the application process. Direct financial support to develop certification and tracking systems to document origin of the seal product was planned. Recognized Bodies would issue certificates to exporters and importers wishing to place seal products in the EU market.
Goals
- Support Canadian applications for Recognized Body* status.
- Establish tracking / certification systems to document the origin of seal product.
Targeted stakeholders
Governments and national and regional Indigenous organizations with potential to meet EU criteria to be a Recognized Body*.
Eligible Activities
Activities to certify and track Indigenous seal products in order to enter the EU. For example:
- Software development, purchase or lease, and maintenance and upgrade
- Training to operate software
* Recognized Bodies are entities with a national or regional scope that can certify the Indigenous origin of a seal product. Such status is awarded by the EU on application.
To obtain status, the applicant must meet specific criteria, including evidence of a certification process with sufficient tracking (document and record-keeping) capacity to prove product origin.
Resource allocation
To implement the planned approach, $2.7 million was originally allocated to Pillar 1. The bulk of the funding was allocated to Vote 1. Funding allocations reflected the high involvement of CMAPS staff in identifying and supporting potential applicants to become Recognized Bodies. Costs were expected to be upfront rather than ongoing.
| Vote | Amount |
|---|---|
| Vote 1: Personnel and Operating | $1,973,525 |
| Vote 2: Contributions | $676,475 |
| Total | $2,650,000 |
Contributions under Pillar 1
Contributions supported activities in three projects (one joint with Pillar 2) with two recipients.
During the four-year evaluation period, 23% of the planned contributions spending under Pillar 1 was allocated to projects.
Figure 2: Pillar 1 Contributions, Planned and Actual, 2015-16 to 2018-19
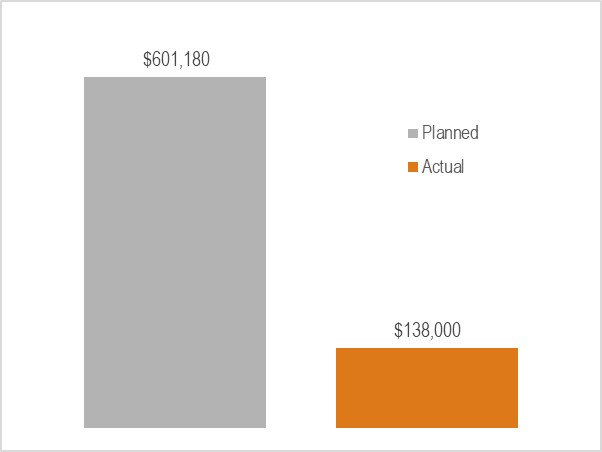
Description
Figure 2 is a vertical bar graph that illustrates planned and actual contributions for Pillar 1. The dollar amounts are identified at the top of each bar. The planned funding for contributions was $601,180 and is significantly higher than the actual contributions. The actual spending for contributions was $138,000 under Pillar 1.
4.2 Basic capacity to enable the Indigenous exemption was established
The Governments of Nunavut and Northwest Territories obtained Recognized Body status in 2015 and 2017 respectively
Applications for Recognized Body status was a first step in enabling the Indigenous exemption.
- Evidence indicated that the CMAPS staff worked closely with the Government of the Northwest Territories and the Government of Nunavut to aid them in completing and submitting their applications.
- The CMAPS staff expertise on the Indigenous exemption, knowledge of certification processes, and knowledge of Government of Canada resources supplemented the capacity of the applicants.
Certification processes are in place but have limited application
There is little evidence that tracking processes evolved beyond those existing prior to 2015.
Challenges arose when certifying origin of secondary seal products such as meat, oil and fashion because the processing is further removed from point of origin (e.g., oil is rendered from multiple sources), or species other than ringed seals. As a result, tracking systems supporting certification reflect those of existing fur purchasing programs, which are based on the pelt market.
- Both Recognized Bodies raised concerns about spending resources to implement an electronic certification system without certainty that it would comply with the regulation.
- They have raised these points for discussion with the European Commission in order to facilitate certification and ease the administrative burden as currently set out in the EU Regulation.
Interest in Recognized Body status continues
Additional entities that meet the EU eligibility criteria expressed interest in becoming Recognized Bodies. They indicated they would need support to complete applications and develop processes.
Certification is poorly understood by stakeholders
Evidence showed that a high level of confusion exists among stakeholders about certification due to a lack of transparency in the requirements. The certification process was unpublished and information was hard to find.
CMAPS funded a project to ease seal products crossing borders by using Quick Response codes
Quick Response (QR) codes provide information to buyers and customs officers easily and complements certification
With CMAPS funding, representatives from the Northwest Territories and Nunavut attended meetings in Brussels to discuss implementing a QR initiative led by Greenland. The proposal would involve attaching a tag with a QR code to seal products entering the EU. When scanned, the tag would refer to an accessible European Commission website indicating if the product is of Inuit or other Indigenous communities’ origin. The EU implemented these changes to their website.
5.0 Findings: Pillar 2
5.1 Pillar 2: Build Indigenous Capacity to Leverage the Indigenous Exemption
Planned approach
Capacity building to leverage the Indigenous exemption was the focus of Pillar 2. The approach recognized that Indigenous communities had varying levels of capacity, which permitted a wide range of activities to be eligible for contributions. Further engagement would be required in order to develop strategies and plans to assess needs and interest, as well as to develop and implement projects to build capacity that aligned to the needs of the various communities. Activities took the form of workshops, trade missions, circumpolar networking, and awareness raising campaigns and materials.
Goal
Provide capacity building assistance so Indigenous communities can take advantage of renewed market access.
Targeted stakeholders
Indigenous organizations, partnerships or aggregations of Aboriginal groups; stakeholders in fisheries or fishing industries working with Aboriginal people.
Eligible Activities
Activities directly related to seal harvesting, processing, marketing and retail, such as:
- Business training and mentoring;
- Acquisition and maintenance of appropriate equipment;
- Feasibility studies; and
- Marketing and business development
Pillar 2 Resources
To implement the planned approach, $981,000 was allocated to Pillar 2. The bulk of the funding was provided to contributions reflecting the expectation that goals under Pillar 2 would largely be achieved through activities by external stakeholders.
| Vote | Amount |
|---|---|
| Vote 1: Personnel and Operating | $150,000 |
| Vote 2: Contributions | $831,000 |
| Total | $981,000 |
Pillar 2 Contributions during the evaluation period
Contributions under Pillar 2 during the evaluation period totalled $934,000. They supported activities in seven projects (one joint with Pillar 1) with 4 recipients. One recipient received 75% of the funding.
| Recipient | Number of Projects | Value of Projects |
|---|---|---|
| 1 | 1 | $14,000 |
| 2 | 1 | $158,000 |
| 3 | 1 | $20,000 |
| 4 | 4 | $700,000 |
Actual contributions under Pillar 2 exceeded planned contributions by 30%. The gap was bridged by unused contribution funding from Pillar 1.
Figure 3: Pillar 2 Contributions Planned and Actual, 2015-16 to 2018-19
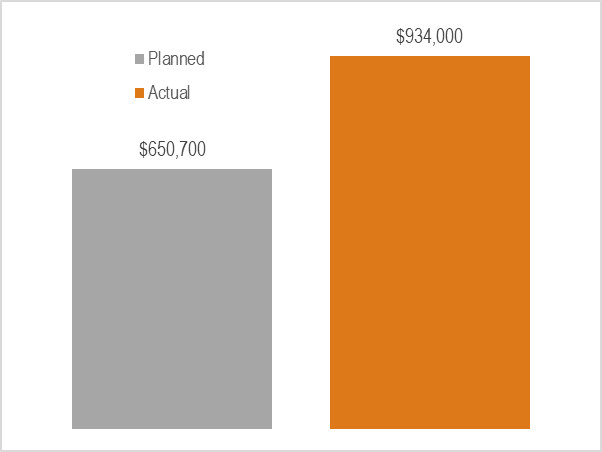
Description
Figure 3 is a vertical bar graph that illustrates planned and actual contributions for Pillar 2. The dollar amounts are identified at the top of each bar. The planned funding for contributions was $650,700 which is less than the actual contributions. The actual spending for contributions was $934,000 for Pillar 2.
5.2 Capacity building results are limited and challenging to identify
Projects to build capacity - results
To build capacity within Indigenous communities to export seal products, CMAPS supported skills development workshops, craft sales, awareness and publicity materials and events, networking opportunities, and trade missions.
- Networking opportunities resulted in a Circumpolar Crafters’ Network whose goal is to support trade and product development among crafters.
- Craft sales and workshops involving Inuit seamstresses provided exposure to international marketplaces for a small number of individuals. Some of them learned about international currency exchange, and what is involved in attending international markets.
- Market intelligence specific to opportunities for leveraging the EU exemption was obtained through trade missions in the EU and meetings with potential buyers.
- Successful product development and skill-building workshops were held, but were not widespread. The involvement of local organizations was a notable factor in their success.
Certificates issued were dependent on CMAPS projects
A key indicator of capacity to leverage the Indigenous exemption is the number of certificates issued to export seal products to the EU. Since 2015, 176 certificates were issued. Most of these were issued due to CMAPS projects that involved transporting products to Europe.
Few products available for export
Projects that focused on the later stages of the value chain (page 3) experienced challenges with the availability of products for export. In one case, an order was filled almost a year after being placed. In another case, a call for samples to bring to the EU yielded few products.
Low supply of raw material
Fewer hunters are hunting seals. As a result, there is a low supply of raw material.
Long-term objectives are unclear
Capacity building requires a long term commitment. However, there is a lack of clear long-term objectives for capacity building activities to leverage the EU exemption.
- Project activities were considered positively, but interviewees noted that the long-term impact on leveraging the Indigenous exemption was not evident.
- Evidence indicated a lack of consensus among stakeholders as to the most effective way to build capacity to leverage the Indigenous exemption.
5.3 GBA+: Demographic factors impact approaches to building capacity
Gender
The supply of products available for export is impacted by gender. In Inuit culture, men hunt to provide raw material, which is then processed further by the women.
- For men, time and costs are barriers to hunting. As communities move to wage-based earning, time to access the land becomes limited to weekends and vacations. For men without wage employment, the higher costs associated with hunting in the north limits their access to the land.
- An assessment of the needs of women seamstresses noted the following challenges to producing products: “Many of them are not always able to sew. Some might just need materials, some: a place to work, others might need training and others counselling - plus a combination of the above.”
Transfer of skills and knowledge also followed gender-based patterns. For example, participants in craft-making workshops were women, while the primary processing project was targeted to men.
Location and climate
Remote northern locations had an impact on project delivery. In some cases, project implementation had to be adjusted because of location and climate.
- Because of the location, air lift was used to acquire materials to complete a project, which increased costs.
- Delays in booking travel or shipping can result in significant increases in costs. In one case, travel estimates used in the proposal were no longer valid by the time project approval was provided, resulting in significant increases to travel and shipping costs, and an adjustment to project scope.
- Poor ice conditions reduced the availability of raw material to develop processing skills in one project. As a result, the project was not fully implemented.
Language and communication practices
How targeted stakeholders receive and share information is an important consideration in engagement, particularly in remote Inuit communities. In this respect, direct engagement at the local level is the most effective way to generate awareness and interest. Other communication factors were also identified as follows:
- Language can impact uptake of a program. One recipient noted that she had positive results with providing introductory information in Inuktitut so that information could easily be shared within communities and suggested that CMAPS try a similar approach.
- In small coastal and remote communities, there is a low level of experience with government processes (e.g., writing proposals, completing applications, making reports). There was a high level of agreement among interviewees that a need to shepherd stakeholders through application and project development processes, which requires direct contact, was required.
- In remote communities, access to internet is often limited, given high costs and low bandwidth. Email is therefore a less effective means of communication than other methods.
5.4 Capacity building to leverage the exemption requires clearer definition
Engagement to refine needs was identified during early consultations on the program design
The foundation documents acknowledged that capacity needs required refinement in order to be addressed. The original expectation was that engagement with regional organizations and communities would be a first step in building capacity, and plans and strategies would be developed through CMAPS. The evaluation found little evidence that this activity occurred between DFO and targeted communities. Clear goals for capacity building to leverage the Indigenous exemption remained undefined.
Clarification of needs was limited by lower than planned engagement at the local level
Initially, the program envisioned engaging local communities through the territorial governments and other regional players in order to facilitate program uptake. The intent was to work with stakeholders to refine identified needs and develop projects that reflected those assessments. However, the level of engagement that occurred was less than intended.
- The evidence indicated that a higher level of engagement with local communities was required to develop sound projects. However, there was no explicit articulation of what those projects should be, and evaluation evidence suggested that a needs assessment with respect to producers and other stakeholders be undertaken.
- Program reach became concentrated in a small number of recipients. Instead of working with regional partners to develop local uptake and projects, the program focused on supporting the territorial governments. Without an expanded level of engagement, project development and implementation became reliant on the capacity of a limited number of proponents to deliver. For example, some projects were delayed or not implemented because of low capacity within recipients.
- Stakeholders identified the risk arising from the concentration of recipients. They noted that key community stakeholders were unaware of CMAPS. They suggested that CMAPS look beyond DFO’s regular partner organizations to expand capacity building opportunities. For example, industry interviewees pointed out that they had knowledge and expertise that could be integrated into project delivery. Others noted that community organizations with a health or justice focus delivered workshops to re-establish traditional skills and could co-deliver projects.
- In the last quarter of 2018-19, the program increased its engagement with stakeholders. As a result, a broader range of applicants under Pillar 2 in 2019-2020 was anticipated. [The program confirmed this was the case during validation of the report.]
A needs assessment would help to define the capacity building needs of Indigenous communities.
6.0 Findings: Pillar 3
6.1 Pillar 3: Support marketing activities of the broader sealing industry
Planned approach
To support market access for the broader seal products industry, CMAPS provided funding to support promotional and branding activities as well as marketing activities and strategies.
Goals
- Increase domestic and international market access
- Develop an industry-wide marketing strategy
Targeted stakeholders
Canadian organizations directly involved in the sealing industry, post-secondary institutions working with seal industry representatives, and governments.
Eligible Activities
Activities that support market access related initiatives for seal products can include:
- feasibility studies directly related to accessing markets for seal products; and
- promotional activities for seal products.
Resource allocation
To implement the planned approach, $1.36 million was allocated to Pillar 3. The bulk of the funding was allocated to contributions, reflecting the expectation that goals under Pillar 3 would largely be achieved through activities by external stakeholders.
| Vote | Amount |
|---|---|
| Vote 1: Personnel and Operating | $400,000 |
| Vote 10: Contributions | $959,000 |
| Total | $1,359,000 |
Contributions under Pillar 3
Contributions made to 9 recipients for 19 projects under Pillar 3, resulted in a 96% utilization rate of planned spending during the evaluation period.
Figure 4: Pillar 3 Contributions, Planned and Actual 2015-16 to 2018-19
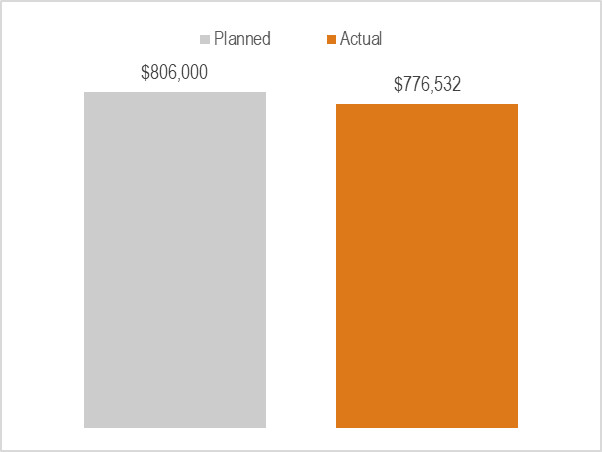
Description
Figure 4 is a vertical bar graph that illustrates planned and actual contributions for Pillar 3. The dollar amounts are identified at the top of each bar. The planned funding for contributions was $806,000 and is only marginally more than the actual contributions. The actual spending for contributions was $776,532 for Pillar 2.
6.2 Achievement – Marketing strategy for seal products was developed
Increased market intelligence available to the Canadian seal products industry
Evaluation evidence showed that business intelligence gathered by the industry was reported to be a key factor in helping the Seals and Sealing Network (SSN) access other sources of funding for the deployment of the strategies in the coming years.
Crystallization of industry players around a clear strategy for marketing and advocacy
Evaluation evidence showed that CMAPS was a catalyst for the seal industry and contributed to the emergence of new industry leaders. The SSN was able to bring together a majority of industry players to develop a proposal for the Canadian Fish and Seafood Opportunities Fund (CFSOF).
Funding was identified as key for the market access needs of the commercial industry
The SSN proposal to CFSOF would support advocacy and awareness needed to obtain social acceptance domestically, and continue to obtain the market intelligence needed to deploy the strategy at a national scale. In the absence of sufficient funding, there was a consensus among the industry players that it would be challenging for the industry to develop the Canadian market and to access foreign markets.
- However, successful project funding under CFSOF does not replace the support needed by individual companies. Continued support is necessary in order to align company marketing activities to the larger strategy.
As reported by the stakeholders, the terms and conditions of CMAPS were best suited to meet their needs because they reflect the realities of the industry in terms of activities permitted and eligibility requirements. Stakeholders reported that accessing other programs was challenging because stakeholders either did not have the capacity required to participate, or did not meet program priorities for funding. In addition, industry interviewees pointed out the need for individual companies to educate program officers (outside DFO) about the seal industry as a whole in order to be considered for funding. This consumed resources that the individual companies did not have.
Market access goals require the ability to meet market and regulatory requirements that fall outside the direct purview of CMAPS
- Ongoing needs of stakeholders for product development assistance to support full use of the seal and to address regulatory challenges for edible seal products (both domestically and internationally) requires collaboration among federal, provincial, and territorial entities and programs.
- The market demands proof of sustainability, and the industry is assessing standards programs as part of its branding strategy. Such industry-led programs require scientific evidence to support certification. In this regard, two needs were identified:
- 1. Updated population surveys to ensure that catch levels are sustainable. In particular, stakeholders indicated a need for a population study of ringed seals. They suggested this should include traditional knowledge.
- 2. Research to improve harvesting techniques. Sources indicate that research in the area of harvesting techniques had difficulty obtaining funding because “it doesn’t have a home [in the federal science community]” (e.g., research for humane harvesting practices in the Gulf Region).
7.0 Findings: Overall
7.1 Facilitators
- Networking and sharing information
- Ability to learn from other Indigenous peoples
- Achieving high level of consensus among industry players on marketing strategy for seal products.
- CMAPS expertise and focus
- DFO is trusted to understand the issues facing the industry vis a vis other federal departments and agencies.
- Valued for scoping projects and as a point of entry to access other federal expertise and programs.
- Eligible activities
- The wide range of funded activities enabled “on the ground” changes in projects for those with very little financial capacity.
- Local stakeholder involvement
- All of the projects with local involvement had positive impact. (e.g., Long John Jamboree in Yellowknife, kamik-making workshop in Iqaluit).
- Evidence of personal impact
- Inuit telling their own stories of the impact of the ban on their lives (e.g. engagement with the EU in Brussels by the two Inuit women, and the screening of the film Angry Inuk).
7.2 Challenges
- Timing of project decisions
- Call for proposals occurs in March, however agreements were not usually signed until after the second quarter, leaving little time for implementation.
- Time delay in processing meant that decisions came after the proposed activities occurred.
- Management of contribution agreements
- Project files were poorly maintained and it was challenging to identify project results.
- Inconsistent program practices were applied which caused confusion among recipients, particularly with respect to reporting requirements.
- 75% of the projects funded did not receive the initial holdback, but the reasons were unclear.
- Leveraging resources of other federal programs
- The value of involving other governmental departments and agencies in the program remains unrealized.
- Other expertise and programs were needed by stakeholders, but the governance model had not leveraged the involvement of other federal programs.
- Lack of capacity in the program and among stakeholders
- In the Indigenous context this was exacerbated by a lack of clearly defined goals and a strategy to address capacity and leverage the Indigenous exemption.
- Project’s information and knowledge were lost due to high turnover of staff.
7.3 CMAPS Resources
Planned spending during the evaluation period was $3.7 million of which 81% was spent. Funding for contributions and salaries was expended at 94% and 92% respectively.
Figure 5: CMAPS Expenditures, Planned and Actual, 2015-2016 to 2018-2019
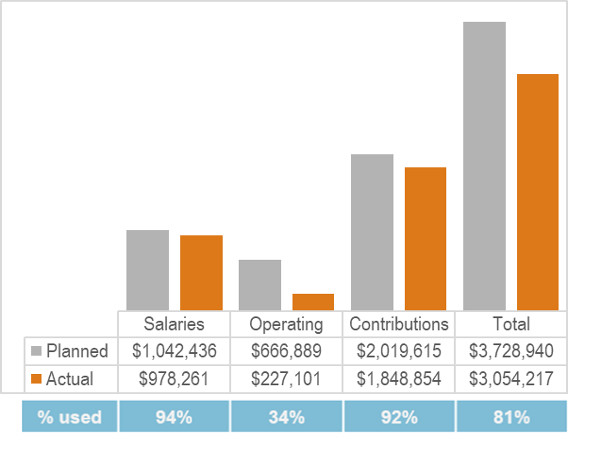
Description
Figure 5 is a vertical bar graph comparing the planned and actual expenditures for the program over three different categories as well as the overall total of the three categories. An accompanying table below shows the values associated with each bar on the graph. Below this, an additional table shows the percentage of funds used per category.
The first of the three categories is salaries. The planned salaries was $1,042,436 and the actual was $978,261. This means that 94% of the funds were used that were planned for salaries.
The second category is operating. The planned operating was $666,889 while the actual was only $227,101. This means that only 34% of the planned operating funds was actually spent.
The third category is contributions. The planned contributions was $2,019,615 and the actual was $1,848,854. This means that 92% of the contributions funding was actually allocated.
Finally, the total spending for the program during the period of evaluation was planned to be $3,728,940 while the actual spending was $3,054,217. This means that overall the program actually spent 81% of the planned amount.
| FTEs | 2015-16 | 2016-17 | 2017-18 | 2018-19 |
|---|---|---|---|---|
| Planned | 2 | 2 | 2 | 2 |
| Actual | 1.52 | 3 | 2.98 | 1.85 |
A marked drop in operating expenditures occurred in 2017-2018
In 2017-18, the program spent 15% of its planned operating funds. In 2018-19, the program spent 10% of its planned operating funds.
Figure 6: Annual Operating Costs, Planned and Actual 2015-16 to 2018-19
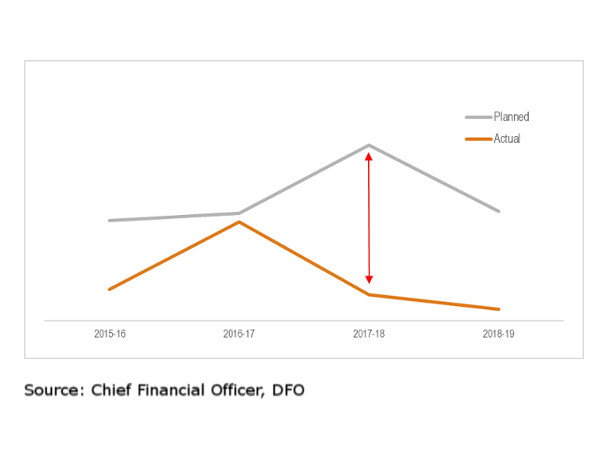
Description
Figure 6 shows a line graph with two lines that represent the planned and actual operating costs for the program. The gap between the lines illustrates the variation between planned and actuals costs.
Planned operating costs exceeded the actual in each of the four years presented. In 2016-17, the gap narrowed considerably from the previous year as actual costs approached planned costs. In 2017-18, actual costs dropped steeply, while planned costs rose sharply. This created the highest variation between planned and actual amounts and is depicted by an arrow. The gap narrowed somewhat in 2018-19, but is still the second widest of the four years presented
Foundational documents allocated operating funds by pillar. However, salary dollars were not broken out and the program did not track operating funds according to pillar. Therefore, it is challenging to explain the drop in operating costs. Two points are noteworthy however:
- A reduction in operating spending was planned as the need to support Recognized Body applications under Pillar 1 ebbed.
- Under Pillar 2, lower than planned engagement occurred which may have affected overall expenditures. External informants reported that program staff seemed unavailable to work with them on developing projects or to partake in engagement opportunities with local organizations.
8.0 Lessons Learned and Conclusions
8.1 Lessons Learned
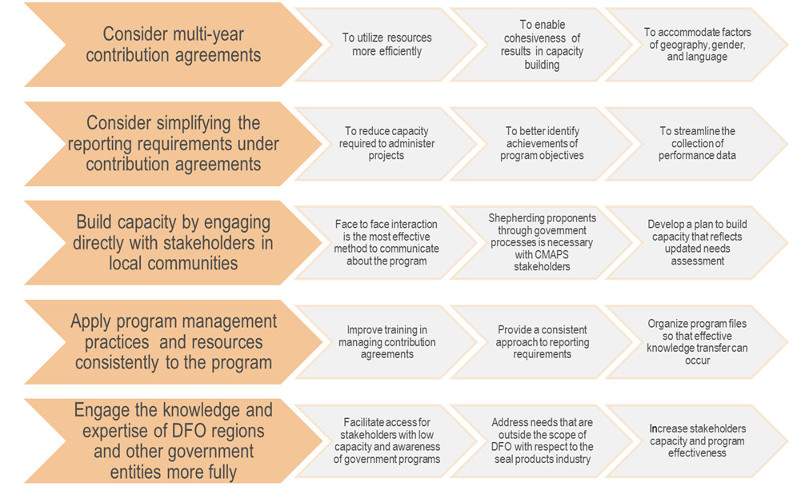
Description
Lessons Learned
The graphic depicts five rows of interconnected arrow boxes. Each row starts with a lesson learned followed by three supporting points, for a total of four arrow boxes per line. The arrows point forward to illustrate that the lessons learned are considerations for future programming.
Lesson 1: Consider multi-year contribution agreements
- To utilize resources more efficiently
- To enable cohesiveness of results in capacity building
- To accommodate factors of geography, gender, and language
Lesson 2: Consider simplifying the reporting requirements under contribution agreements
- To reduce capacity required to administer projects
- To better identify achievements of program objectives
- To streamline the collection of performance data
Lesson 3: Build capacity by engaging directly with stakeholders in local communities
- Face to face interaction is the most effective method to communicate about the program
- Shepherding proponents through government processes is necessary with CMAPS stakeholders
- Develop a plan to build capacity that reflects updated needs assessment
Lesson 4: Apply program management practices and resources consistently to the program
- Improve training in managing contribution agreements
- Provide a consistent approach to reporting requirements
- Organize program files so that effective knowledge transfer can occur
Lesson 5: Engage the knowledge and expertise of DFO regions and other government entities more fully
- Facilitate access for stakeholders with low capacity and awareness of government programs
- Address needs that are outside the scope of DFO with respect to the seal products industry
- Increase stakeholders capacity and program effectiveness
8.2 Conclusions
The need to maintain support for market access for seal products continues. Support to enable the Indigenous exemption continues as organizations still lack capacity to operationalize Recognized Body status. Capacity to support market readiness within Indigenous communities is still needed in order to leverage the exemption, and there is a need for more work to articulate needs and design responses. The need to support commercial sector participation in marketing activities remains. As well, the need for advocacy and awareness-raising by governments and industry stakeholders to address misconceptions about seal products continues and is vital to achieving objectives.
There is a need for a collaborative approach to address challenges earlier in the value chain to fully realize CMAPS objectives. The importance of certification and tracking systems for market access extends beyond the requirements of the Indigenous exemption. For example, industry-led standards to certify sustainability are a critical component of the branding strategy. In this regard, stakeholders identified a need for updated research into harvesting techniques and population science to be eligible for certification. Demand for product exists, but there is insufficient supply. A need to establish reliable supply chains and rebuild markets is critical for all stakeholders. Clarification of trade regulations around seal products is also needed to develop markets for seal products beyond fur.
To varying degrees, the CMAPS has made progress on meeting its objectives. Perhaps the greatest accomplishment is that positive results were realized given the challenging context in which the program operates.
Under Pillar 1, capacity to enable the Indigenous exemption was established. Nunavut and the Northwest Territories became Recognized Bodies. However, tracking systems to support certification remain largely as they existed prior to CMAPS, and do not extend to processed products. Uncertainty over compliance with the EU regulation created challenges, and Recognized Bodies are still seeking clarification from the EU before investing in further systems development. In addition, information about the certification process has not been widely distributed, and stakeholders outside the process have limited understanding of requirements.
Under Pillar 2, there was some improvement in capacity to support exports. Project funding resulted in a Circumpolar Crafters’ Network whose goal is to support trade and product development among crafters. Market intelligence specific to opportunities for leveraging the Indigenous exemption was obtained through direct experience and meetings. Some product development and skill-building workshops were held, but were not widespread. The key challenge in this regard is the initial underestimation of what was needed to increase capacity to leverage the Indigenous exemption.
Under Pillar 3, the objectives related to the broader seal products industry were well advanced. The contributions supported promotional events; participation in international trade shows; and market research. For the first time, there is a high level of consensus among industry players on a marketing strategy to securing market access, and a funding application to the Canadian Fish and Seafood Opportunities Fund received a high level of support from stakeholders. However, this does not replace the need for funding to support individual marketing activities.
Appendix 1: Methodology
Data was collected using multiple lines of evidence to increase reliability and findings were corroborated by triangulated. A preliminary scan of data available revealed performance information was limited; therefore, mitigation strategies were utilized.
1. Interviews
Interviews were undertaken with CMAPS staff and management, as well as external stakeholders. Interviews were used as a means of obtaining current and ongoing needs of the stakeholders, as well as their perception of results achieved and suggestions for improving design and delivery. Interviews were held by phone and in person at the Fur institute of Canada’s 36th annual general meeting. In addition to consultations with program managers, a total of 13 interviews were conducted.
2. Project File Review
Contribution agreements, as well as associated project reports, were examined and related correspondence in order to assess the effectiveness of the program. All of the program’s projects were reviewed in order to mitigate the lack of performance data.
3. Document Review
Reviewed program documents relating to planning, communications, budgeting, and performance to obtain insight into needs, programs , effectiveness, and design and delivery. A total of 56 documents provided useful information to the evaluation.
4. Literature Review
Examined external literature provided by DFO Library Services in order to develop knowledge about CMAPS, especially the effectiveness and efficiency of the program. In addition, to mitigate the lack of interviewees from northern communities, a review of northern media outlets (e.g., CBC North, Nunatsiaq News) was integrated into the literature review.
5. Case Studies
Two case studies were conducted to form a single line of evidence and fill expected information gaps. The first was looking at the Fur Institute of Canada, the second was looking at pillar two of the program. Case studies focused on design and delivery, factors impacting performance, lessons learned, and GBA+ considerations.
Appendix 2: Sealing Areas in Canada
Seals are accessed by foot using snowmobiles where ice is thick and close to land, or from small vessels (under 65’) among the ice floes further offshore. Rifles are used by most hunters; although the hakapik and harpoon are permitted.
Commercial harvesters require licenses and professional sealer designation. Since 1995, residents adjacent to sealing areas throughout Newfoundland and Labrador and Quebec have been allowed to harvest up to six seals for their own use, and require a personal use license to do so. A total allowable catch (TAC) determines how many seals can be taken. TACs are established for hooded, harp and grey seals.
Aboriginal peoples and non-Aboriginal coastal residents who reside north of 53°N latitude can harvest seals for subsistence purposes without a license, or as determined by specific treaty rights.
In 2016, harvesters landed 66,800 harp seals and 1,612 grey seals. Landings for ringed seals are not tracked. (Source: DFO website)
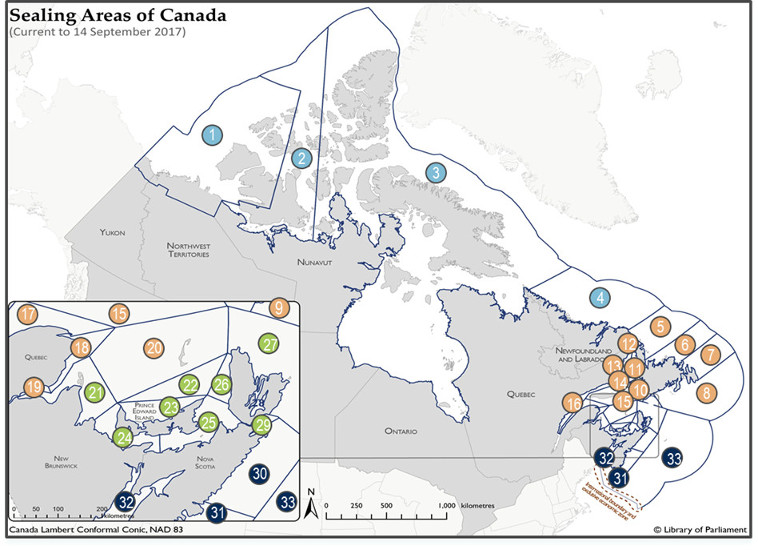
Figure 7: Sealing Areas of Canada (Current to 14 September 2017).
Description
Figure 7: Sealing Areas of Canada (Current to 14 September 2017)
The map depicts Canada’s 33 Sealing Areas located in the Arctic, Newfoundland and Labrador, and the Gulf of St. Lawrence. The numbering of areas begins with Sealing Area 1 in the western Arctic, continuing along Canada’s northern and eastern coasts to Sealing Area 33 off the coast of Nova Scotia.
Areas 1 – 4, encompassing all of Northern Canada, from Yukon in the east to Labrador in the west:
- Mainly Inuit subsistence harvest of Ringed Seals (ringed and harp seals in Area 4)
- No licenses required
- No population survey for ringed seal, estimated at 1 million animals
Areas 5 -20, encompassing the north, west and south coasts of Newfoundland and Quebec:
- Mainly licensed commercial harvest of harp (some hooded) seals
- Areas 5-7 known historically as the front
- Area 20 has increasing population of grey seals
- Personal use licenses allowed
Areas 21 –29, encompassing the north coasts of New Brunswick and Nova Scotia, and surrounding Prince Edward Island:
- Mainly licensed commercial harvest of harp seals
- High abundance of grey seals with impact on cod recovery in the southern Gulf of St. Lawrence
Areas 30-33, encompassing the south and southwest coast of New Brunswick and Nova Scotia:
- Grey seals TAC permitted
- Date modified: